
Research article · 2025 · Full text
International Journal of Geography Geology and EnvironmentSoil erosion modeling using WEPP under climate change scenarios in the Korean Peninsula
Volume 7(9) · Pages 210–213 · DOI: 10.22271/27067483.2025.v7.i9c.643 ↗
Research areasSoil erosion and sediment transportHydrology and Watershed Management StudiesEnvironmental and Agricultural Sciences
Abstract
Author-writtenSince the 1970s, South Korea has invested heavily in hillslope revegetation and terracing to curb soil losses that once stripped bare mountainsides at rates exceeding 40 t/ha/yr. Those gains are now at risk as shifting rainfall patterns push storm intensities beyond the design capacity of existing conservation measures. This research applied the Water Erosion Prediction Project (WEPP) model to simulate hillslope and watershed-scale soil erosion across four representative catchments in the central Korean Peninsula under two Representative Concentration Pathway scenarios (RCP 4.5 and RCP 8.5) for the period 2020-2100. Downscaled climate projections from three general circulation models (HadGEM2-ES, MPI-ESM-LR, CNRM-CM5) supplied daily precipitation, temperature, and solar radiation inputs. The model was calibrated against measured sediment yield data from 2010 to 2019 and validated for 2020-2022, achieving Nash-Sutcliffe efficiency coefficients of 0.72 to 0.81 across the four catchments. Baseline mean erosion stood at 12.4 t/ha/yr. Under RCP 4.5, erosion is projected to reach 22.3 t/ha/yr by 2100, while RCP 8.5 pushes the estimate to 38.1 t/ha/yr, a threefold increase over current conditions. Cropland contributed 55-62% of total sediment yield despite occupying only 31% of the catchment area. The simulations suggest that existing terraces and grass waterways will be overwhelmed by mid-century under the high-emission pathway unless supplemented by additional buffer strips and cover crop rotations.
Summary
Source-checkedPlain-language reading of the full paper, prepared with AI and checked against the text. Each point links to the authors' own words.
Why it matters
- South Korea has historically faced severe soil erosion, with rates once exceeding 40 t/ha/yr, leading to significant investments in revegetation and terracing since the 1970s. View evidence ↗
- Current soil conservation gains are threatened because changing rainfall patterns are creating storm intensities that exceed the capacity of existing measures. View evidence ↗
- Soil erosion is highly sensitive to rainfall intensity; even small increases in storm magnitude can lead to significantly larger amounts of sediment loss. View evidence ↗
The question
- The study aimed to fill a research gap by calibrating and validating the Water Erosion Prediction Project (WEPP) model for four catchments in the Gangwon and Gyeonggi provinces. View evidence ↗
What they did
- The research focused on four catchments: Hwacheon (47.3 sq km), Pocheon (62.8 sq km), Hoengseong (53.1 sq km), and Yangpyeong (41.6 sq km). View evidence ↗
- The model used daily precipitation, temperature, and solar radiation data from three general circulation models: HadGEM2-ES, MPI-ESM-LR, and CNRM-CM5. View evidence ↗
- Model calibration was performed using sediment yield data from 2010-2019, with validation from 2020-2022, resulting in Nash-Sutcliffe efficiency coefficients between 0.72 and 0.81. View evidence ↗
- The WEPP model simulated soil erosion from 2020 to 2100 under two climate scenarios: RCP 4.5 (moderate emissions) and RCP 8.5 (high emissions). View evidence ↗
What they found
- The baseline mean soil erosion rate was measured at 12.4 t/ha/yr. View evidence ↗
- Under the RCP 8.5 scenario, erosion is projected to reach 38.1 t/ha/yr by 2100, representing a threefold increase over baseline conditions. View evidence ↗
- Cropland is the primary source of sediment, contributing 55-62% of the total yield while only occupying 31% of the land area. View evidence ↗
- Under the high-emission RCP 8.5 scenario, cropland erosion rates are projected to climb from 6.8 to 23.8 t/ha/yr, the highest increase among all land uses. View evidence ↗
- Converting 10% of cropland to grass buffer strips reduced erosion by 14-19% under RCP 4.5 and 11-16% under RCP 8.5. View evidence ↗
What it means
- The authors conclude that existing conservation measures will be overwhelmed by mid-century under high emissions unless supplemented by cover crop rotations and additional buffer strips. View evidence ↗
- To keep erosion within tolerable limits, the authors recommend a portfolio approach including modified tillage, cover crops, vegetative buffers, and targeted land retirement. View evidence ↗
- A stated limitation of the study is the assumption that land use remains static over the projection period. View evidence ↗
- The authors note that using only three general circulation models does not cover the full CMIP5 distribution, and adding more models would better define uncertainty. View evidence ↗
Visual summary
2 visualsIllustrations explain the paper; they do not show study data.
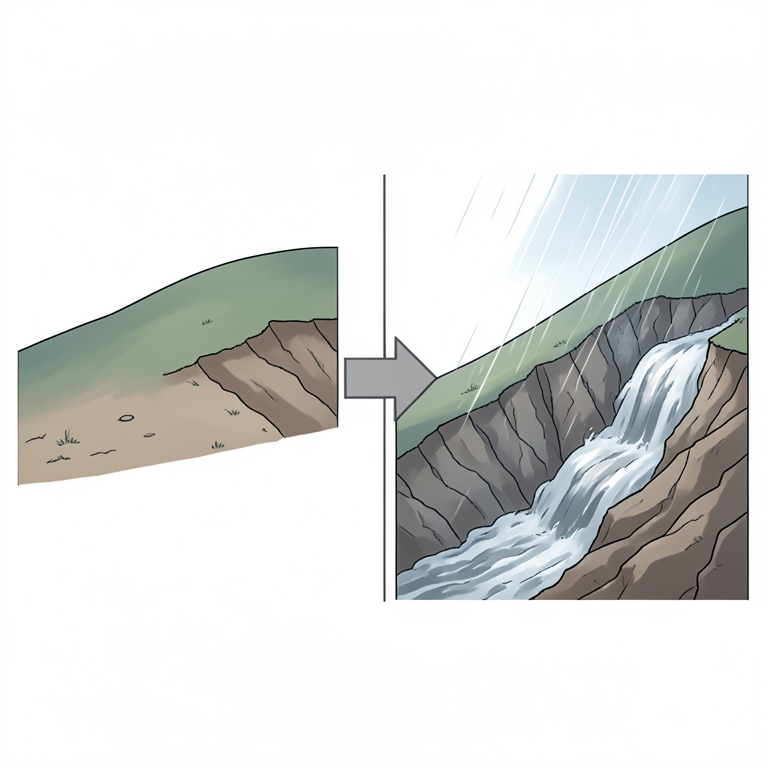
Climate Scenario Erosion Trajectories
AI-generated conceptual illustration (Korean Peninsula landscape with sloping agricultural soil). It explains the idea and does not show study data.
View source evidence ↗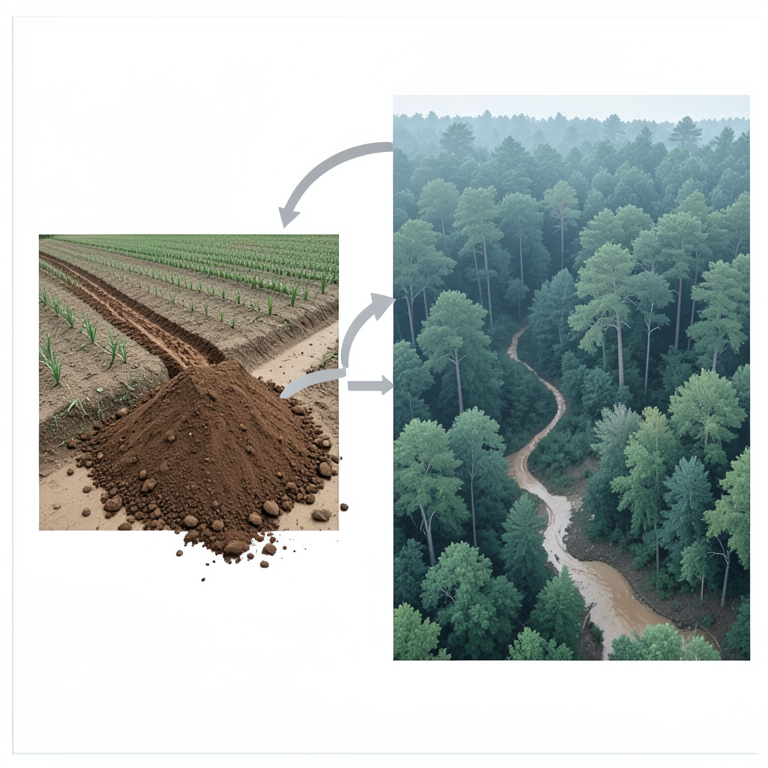
Land Use vs. Erosion Contribution
AI-generated conceptual illustration (Korean Peninsula landscape with cropland and forest). It explains the idea and does not show study data.
View source evidence ↗Figures & tables
From the original paper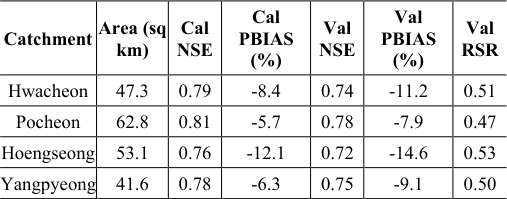 Table 1
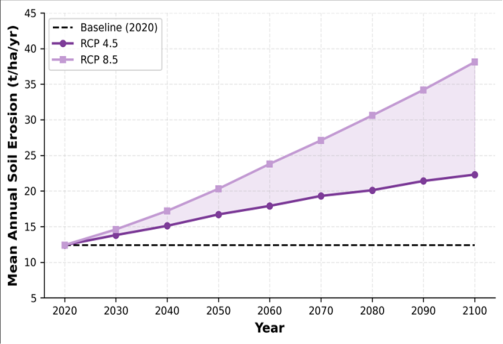 Figure 1
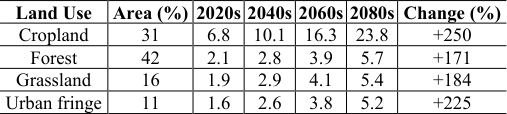 Table 2
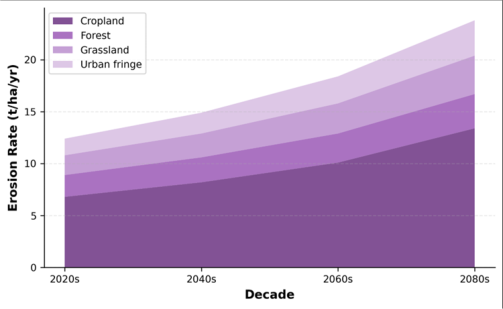 Figure 2
Introduction
Half a century ago, aerial photographs of central Korea showed a landscape stripped nearly bare by decades of deforestation, overgrazing, and wartime devastation. The massive reforestation campaign launched in 1973, one of the most successful in modern history, planted over 11 billion trees and reduced national erosion rates by an estimated 70% within two decades [1] . Yet the replanted hillslopes now face a different adversary: rainfall that is becoming more intense and concentrated in fewer, heavier events as the East Asian monsoon responds to a warming climate [2] . The Korean Peninsula receives roughly 60-70% of its annual precipitation (1,200-1,500 mm) between June and September. Climate projections under CMIP5 indicate that maximum daily precipitation could increase by 15-30% by mid-century even under moderate emission pathways, with a disproportionate rise in events exceeding 80 mm/day [3] . Because soil erosion responds nonlinearly to rainfall intensity, relatively modest increases in storm magnitude can translate into much larger increases in sediment flux [4] . Process-based models like the Water Erosion Prediction Project (WEPP) offer a physically grounded framework for projecting erosion under altered climate regimes. WEPP simulates rill and interrill erosion, sediment transport, and deposition along hillslope profiles and through small watershed channel networks, accounting for canopy cover, residue, tillage, and soil properties on a daily time step [5] . It has been validated across temperate, tropical, and semi-arid settings but has seen limited application in East Asian monsoon environments, where short-duration high-intensity storms and distinctive paddy-field hydrology create conditions not well represented in the default parameterisations [6] . This research addressed that gap by (a) calibrating and validating WEPP for four catchments in Gangwon and Gyeonggi provinces, (b) driving the calibrated model with downscaled projections from three GCMs under RCP 4.5 and RCP 8.5, and (c) partitioning projected erosion by land use to identify where conservation interventions are most needed. The work was carried out at the Department of Geography and Planning, School of Geography and Environment, Cartagena, Colombia, between May 2021 and September 2023 [7] .
Model Description and Parameterisation
WEPP version 2012.8 was configured in watershed mode for each of the four catchments, with hillslope elements derived from a 5 m national DEM resampled to 10 m resolution. Soil erodibility parameters (interrill erodibility Ki, rill erodibility Kr, critical shear stress tauc) were estimated from measured soil texture, organic matter content, and saturated hydraulic conductivity following the WEPP Technical Documentation [5] . Land management files were constructed for four cover types: deciduous forest, coniferous plantation, rainfed cropland (rice-soybean rotation), and urban fringe. Cropland management sequences specified spring tillage on 20 April, rice transplanting on 25 May, harvest on 15 October, and soybean planting on 1 November where double-cropping occurred. Leaf area index growth curves were fitted to MODIS LAI 8-day composites (2015-2019) for each cover type [8] . Climate input files were generated from biascorrected daily data using the CLIGEN stochastic weather generator seeded with station-specific statistics from the Korea Meteorological Administration network [9] .
Scenario Development
Two emission pathways were considered: RCP 4.5 (moderate mitigation) and RCP 8.5 (high emissions). Downscaled daily precipitation, maximum and minimum temperature, and solar radiation from HadGEM2-ES, MPI-ESM-LR, and CNRM-CM5 were obtained from the Korea Meteorological Administration's regional climate projections at 12.5 km resolution [10] . For each GCM-RCP combination, WEPP was run for the period 2020-2100 in 20-year moving windows. The ensemble mean and range across the three GCMs were reported. Land use was held constant at 2020 distribution to isolate the climate signal; a supplementary sensitivity test examined the effect of converting 10% of cropland to permanent grass cover [11] .
Material and Methods Material
The four catchments, Hwacheon (47. Rainfall was recorded at 10-minute resolution at seven automatic weather stations within or adjacent to the catchments [12] .
Methods
Calibration targeted three parameters: effective hydraulic conductivity (Ke), interrill erodibility (Ki), and rill erodibility (Kr). Optimisation used the Shuffled Complex Evolution (SCE-UA) algorithm, minimising the root mean square error between observed and simulated monthly sediment yields. Performance was evaluated with Nash-Sutcliffe efficiency (NSE), percent bias (PBIAS), and the ratio of RMSE to the standard deviation of observations (RSR) [13] . Validation applied the calibrated parameter sets to the 2020-2022 period without further adjustment. Climate-driven projections were run with the same parameter sets, replacing observed climate inputs with biascorrected GCM outputs. Erosion rates were aggregated to annual means per land use class using zonal statistics in QGIS 3.28. 1 shows that calibration NSE ranged from 0.76 to 0.81 and validation NSE from 0.72 to 0.78, indicating satisfactory model performance according to the benchmarks proposed by Moriasi et al. [13] . PBIAS remained within plus or minus 15% for all catchments, and RSR stayed below 0.54, confirming that simulated sediment yields tracked observed values without systematic over-or underprediction. Figure 2 shows how the erosion budget shifts over time.
Results
Cropland's share grows slightly in both absolute and relative terms, while forest and grassland contribute modestly. The urban-fringe category, although small in area, displays a steep proportional rise driven by exposed construction surfaces and reduced infiltration.
Discussion
The projected erosion increases align broadly with findings from WEPP applications in other monsoon-dominated regions. Nearing et al. [14] estimated that a 1% rise in total precipitation could raise erosion by roughly 1.7% in the US, a sensitivity ratio that, when extrapolated to the Korean precipitation projections (+18 to +34% by end-century), predicts a 30-58% erosion increase, somewhat lower than the 80-207% simulated here. The discrepancy reflects Korea's steeper slopes and the dominance of high-intensity convective events during the monsoon, which amplify interrill detachment disproportionately. Cropland's outsized contribution to sediment yield underscores the importance of targeted management. The sensitivity test converting 10% of cropland to permanent grass buffer strips reduced catchment-scale erosion by 14-19% under RCP 4.5 and 11-16% under RCP 8.5, a meaningful but not sufficient offset. Additional strategies, such as no-till rice cultivation, winter cover cropping, and straw mulching after soybean harvest, would need to be combined with grass buffers to keep erosion below the 12 t/ha/yr tolerable threshold proposed by the Korean Rural Development Administration [15,16] . A limitation of the projections is the static land use assumption. In reality, ongoing urbanisation around Seoul's satellite cities is converting agricultural land to impervious surfaces, which may simultaneously reduce cropland erosion area and increase surface runoff volumes downstream [17] . Coupling WEPP with a land-use change model such as CLUE-S would improve the realism of longterm projections. The three-GCM ensemble, while capturing a reasonable range of precipitation futures, does not span the full CMIP5 distribution; inclusion of additional models would widen the uncertainty bounds [18] .
Conclusion
This research projected soil erosion across four catchments in the central Korean Peninsula through the end of the 21st century using the WEPP model driven by bias-corrected outputs from three general circulation models under RCP 4.5 and RCP 8.
Acknowledgement
Acknowledgements Funding SourcesThis research was supported by departmental funds from the School of Geography and Environment, Cartagena, Colombia.
Figures and tables from the paper
| Land Use | Area (%) | 2020s | 2040s | 2060s | 2080s | Change (%) |
|---|---|---|---|---|---|---|
| Cropland | 31 | 6.8 | 10.1 | 16.3 | 23.8 | +250 |
| Forest | 42 | 2.1 | 2.8 | 3.9 | 5.7 | +171 |
| Grassland | 16 | 1.9 | 2.9 | 4.1 | 5.4 | +184 |
| Urban fringe | 11 | 1.6 | 2.6 | 3.8 | 5.2 | +225 |
Table text extracted from the original PDF; superscript letters are shown inline. The original table image is below.
View original table image
References
21 in the original paper- Bae DH, Jung IW, Chang H. Long-term trend of precipitation and runoff in Korean river basins. Hydrological Processes. 2008;22(14):2644-2656.
- Choi G, Collins D, Ren G, Trewin B, Baldi M, Fukuda Y. Changes in means and extreme events of temperature and precipitation in the Asia-Pacific Network region. International Journal of Climatology. 2009;29(13):1906-1925.
- Im ES, Ahn JB, Remedio AR, Kwon WT. Sensitivity of the regional climate of East Asia to convective parameterizations. Climate Research. 2008;36(2):137152.
- Nearing MA, Pruski FF, O'Neal MR. Expected climate change impacts on soil erosion rates: a review. Journal of Soil and Water Conservation. 2004;59(1):43-50.
- Flanagan DC, Nearing MA. USDA-Water Erosion Prediction Project: hillslope profile and watershed model documentation. NSERL Report No. 10. USDAARS. 1995.
- Shen ZY, Gong YW, Li YH, Hong Q, Xu L, Liu RM. A comparison of WEPP and SWAT for modeling soil erosion of the Zhangjiachong watershed in the Three Gorges Reservoir Area. Agricultural Water Management. 2009;96(10):1435-1442.
- Park JH, Duan L, Kim B, Mitchell MJ, Shibata H. Potential effects of climate change and variability on watershed biogeochemical processes and water quality in Northeast Asia. Environment International. 2010;36(2):212-225.
- Myneni RB, Hoffman S, Knyazikhin Y, Privette JL, Glassy J, Tian Y. Global products of vegetation leaf area and fraction absorbed PAR from year one of MODIS data. Remote Sensing of Environment. 2002;83(1-2):214-231.
- Nicks AD, Lane LJ, Gander GA. Weather generator. In: USDA-Water Erosion Prediction Project: Hillslope Profile and Watershed Model Documentation. NSERL Report No. 10. 1995:2.1-2.22.
- KMA. Korean Climate Change Assessment Report 2020: Climate Projections. Korea Meteorological Administration. Seoul. 2020.
- Lal R. Soil carbon sequestration impacts on global climate change and food security. Science. 2004;304(5677):1623-1627.
- NIER. National Water Quality Monitoring Report 2019. National Institute of Environmental Research, Incheon. 2020.
- Moriasi DN, Arnold JG, Van Liew MW, Bingner RL, Harmel RD, Veith TL. Model evaluation guidelines for systematic quantification of accuracy in watershed simulations. Transactions of the ASABE. 2007;50(3):885-900.
- Nearing MA. Potential changes in rainfall erosivity in the United States with climate change during the 21st century. Journal of Soil and Water Conservation. 2001;56(3):229-232.
- KRDA. Guidelines for Soil Conservation on Sloping Farmland. Korean Rural Development Administration. Suwon. 2018.
- Jeon JH, Choi D, Park Y, Lim KJ. SWAT calibration and uncertainty analysis for watershed-scale water quality modeling. Paddy and Water Environment. 2018;16(3):499-510.
- Kim S, Lee H, Yoon S. Urbanization effects on rainfallrunoff processes in the Jungnang River basin, Korea. KSCE Journal of Civil Engineering. 2016;20(1):385392.
- Taylor KE, Stouffer RJ, Meehl GA. An overview of CMIP5 and the experiment design. Bulletin of the American Meteorological Society. 2012;93(4):485-498.
- Zhang XC. A comparison of explicit and implicit spatial downscaling of GCM output for soil erosion and crop production assessments. Climatic Change. 2007;84(3-4):337-363.
- Laflen JM, Elliot WJ, Flanagan DC, Meyer CR, Nearing MA. WEPP-predicting water erosion using a process-based model. Journal of Soil and Water Conservation. 1997;52(2):96-102.
- Won CH, Choi YH, Shin MH, Lim KJ, Choi JD. Effects of rice paddy microtopography on runoff and soil loss. Paddy and Water Environment. 2012;10(2):111-120.