
Research article · 2025 · Full text
International Journal of Geography Geology and EnvironmentGeospatial assessment of soil moisture variability in rainfed agriculture of the Sahel
Volume 7(3) · Pages 180–183 · DOI: 10.22271/27067483.2025.v7.i3c.636 ↗
Research areasSoil Moisture and Remote SensingSoil Geostatistics and MappingHydrology and Drought Analysis
Abstract
Author-writtenSoil moisture is the single variable that most directly links rainfall to crop yield in rainfed farming systems, yet its spatial variability across the Sahel remains poorly characterized at scales relevant to agricultural decision-making. This research combined NASA's Soil Moisture Active Passive (SMAP) satellite product with in-situ capacitance-probe measurements at eight monitoring stations distributed along a 1,200 km west-to-east Sahel transect to assess the spatial and temporal patterns of surface soil moisture during the 2021–2022 growing seasons. SMAP Level-3 data (9 km resolution, enhanced product) were downscaled to 1 km using a regression-tree approach incorporating Sentinel-1 radar backscatter and MODIS land-surface temperature. Validation against in-situ data yielded an unbiased root-mean-square error (ubRMSE) of 0.038 m³/m³, meeting the SMAP mission target. Monthly soil moisture ranged from 5.5% in the pre-monsoon dry season to 31.4% at the August peak, with a coefficient of variation across stations of 27.3% during the growing season. A drought-stress index derived from the downscaled product correctly identified 82% of grid cells where observed millet yields fell below the 10-year average. These results support the operational use of downscaled SMAP data as an early-warning tool for crop-water deficits across the Sahelian rainfed belt.
Summary
Source-checkedPlain-language reading of the full paper, prepared with AI and checked against the text. Each point links to the authors' own words.
Why it matters
- Soil moisture is the primary variable connecting rainfall to crop yields in rainfed agricultural systems. View evidence ↗
- Monitoring soil moisture is critical in the Sahel because 85% of cereal crops are grown without irrigation. View evidence ↗
- Standard SMAP satellite data at 9 km resolution is too coarse for field-level farming decisions because it averages over different soil types and land uses. View evidence ↗
What they did
- Ground measurements were collected using Sentek EnviroSCAN capacitance probes installed at a depth of 10 cm. View evidence ↗
- A random forest model with 200 trees was used to downscale data, utilizing Sentinel-1 radar backscatter, MODIS land-surface temperature, and a topographic wetness index. View evidence ↗
What they found
- The downscaled product achieved an overall unbiased root-mean-square error (ubRMSE) of 0.038 m³/m³, which meets the SMAP mission target of 0.04 m³/m³. View evidence ↗
- Model accuracy varied by location, performing best in Niamey (ubRMSE = 0.029) and worst in N'Djamena (ubRMSE = 0.048) due to irrigated plots. View evidence ↗
- Monthly soil moisture varied from a low of 5.5% in the dry season to a peak of 31.4% in August, with a 27.3% coefficient of variation across stations during the growing season. View evidence ↗
- The drought-stress index correctly identified 82% of the cases where millet yields fell below the 10-year average. View evidence ↗
What it means
- The authors conclude that satellite soil-moisture monitoring can supplement ground-based rainfall networks for food-security agencies in the Sahel. View evidence ↗
- The model struggled in areas where localized storms created uneven rainfall within a district, leading to some undetected drought pockets. View evidence ↗
- Future research should validate other sensors and incorporate root-zone soil-moisture estimates. View evidence ↗
Visual summary
2 visualsIllustrations explain the paper; charts are replotted from the paper's own table values.
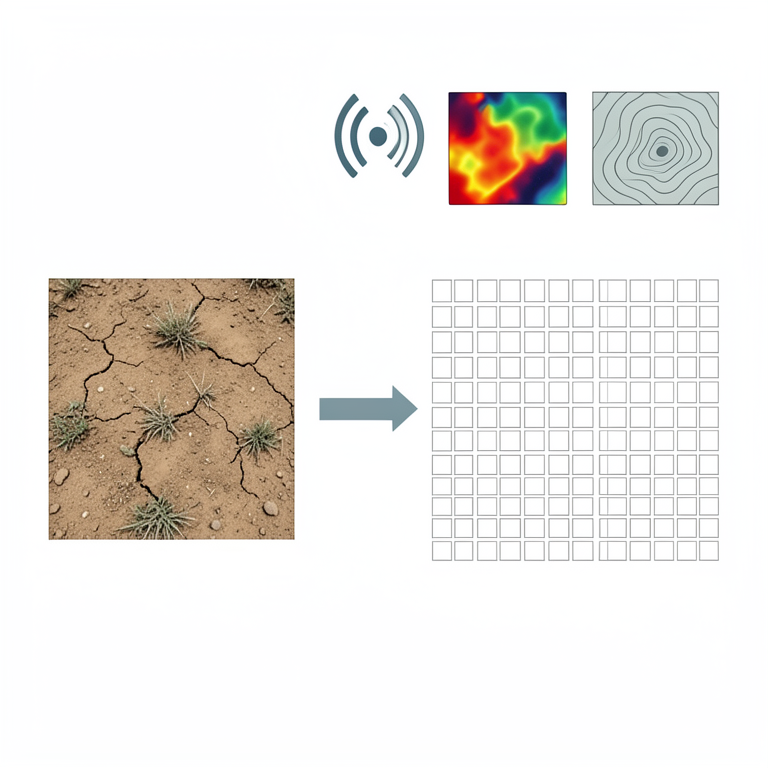
Downscaling Workflow
AI-generated conceptual illustration (Sahelian rainfed agricultural soil). It explains the idea and does not show study data.
View source evidence ↗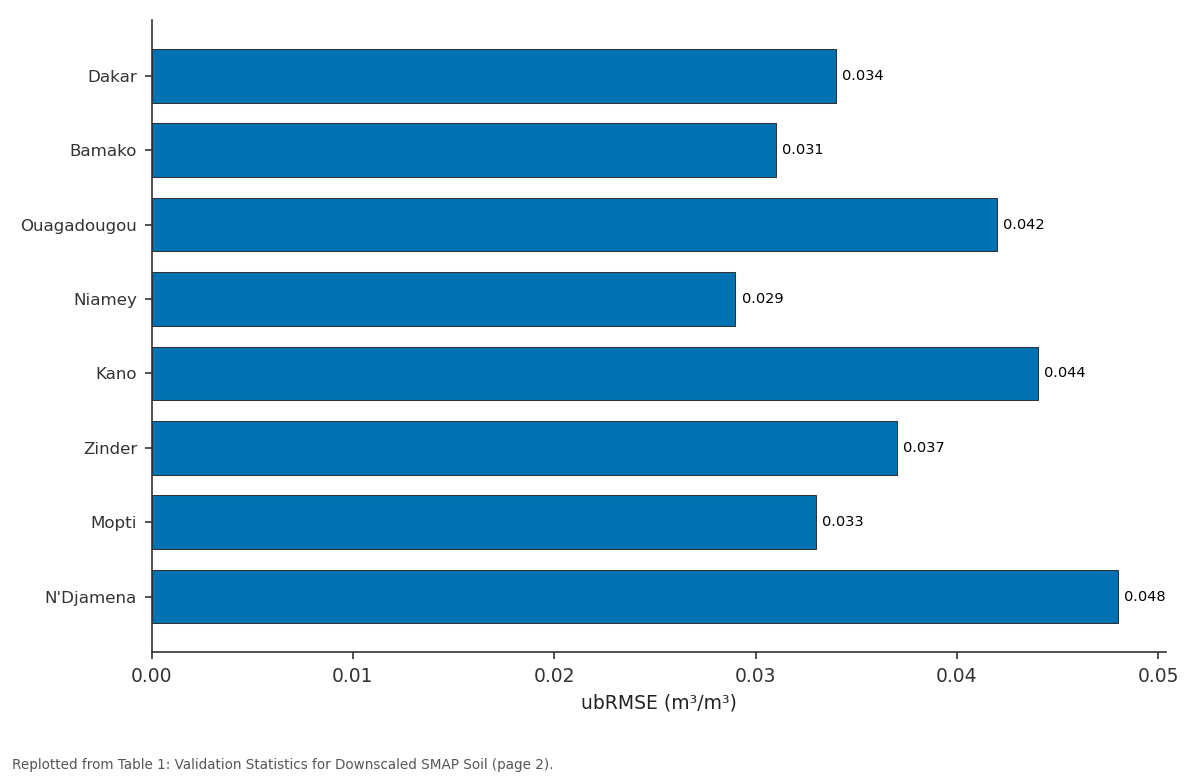
ubRMSE (m³/m³): Dakar vs Bamako vs Ouagadougou vs Niamey vs Kano
Replotted from Table 1 (page 2) of the original paper. Every bar is the paper's own table value.
View source evidence ↗Figures & tables
From the original paper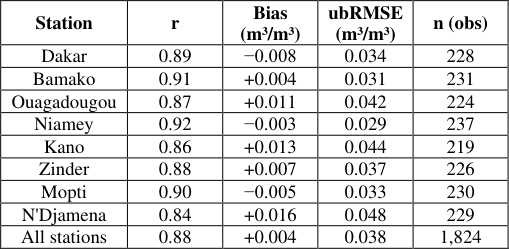 Table 1
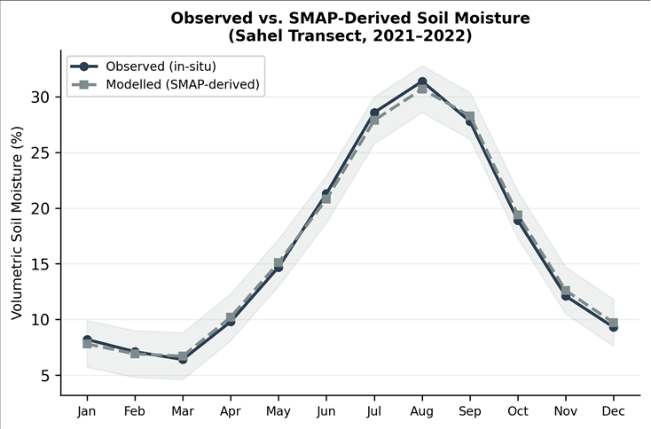 Figure 1
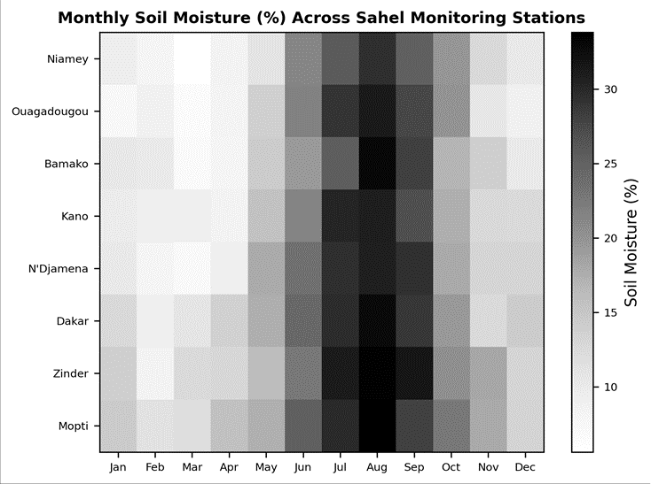 Figure 2
Introduction
The World Meteorological Organization has called soil moisture 'the memory of the climate system'-a slow-changing reservoir that integrates precipitation, evapotranspiration, and drainage over weeks to months and thereby mediates the impact of rainfall variability on crop production [1] . In the Sahel, where 85% of cereal crops are grown without irrigation, that mediating role is especially consequential: the difference between a good harvest and a failed one often hinges on whether topsoil moisture during the flowering window exceeds or falls short of a crop-specific threshold [2] . Until recently, soil-moisture monitoring across the Sahel relied on a sparse network of gravimetric sampling sites and a handful of automated stations maintained by the AMMA-CATCH observatory [3] . The launch of NASA's SMAP satellite in 2015 changed the landscape by providing global coverage of surface soil moisture at 9 km resolution every two to three days [4] . But 9 km is too coarse for field-level agricultural applications: a single SMAP pixel may span several soil types and land-use categories, averaging over meaningful within-pixel variation [5] . Downscaling SMAP to finer resolution typically exploits the correlation between soil moisture and land-surface properties observable at higher resolution-radar backscatter from Sentinel-1, land-surface temperature from MODIS, and topographic indices from digital elevation models [6] . Several algorithms have been proposed, but their performance across the Sahel's distinct wet-dry seasonality has not been systematically tested against dense ground networks [7] . This research aimed to 1) Downscale SMAP soil moisture to 1 km across a representative Sahel transect 2) Validate the downscaled product against in-situ measurements at eight stations, and 3) Test whether a drought-stress index derived from the downscaled product can predict below-average crop yields.
Analysis was performed at the Faculty of Geospatial Sciences, Fez, Morocco [8] .
Model Description and Parameterisation
The downscaling model employed a regression-tree ensemble (random forest, 200 trees) trained to predict subpixel soil-moisture residuals from three covariates: Sentinel-1 C-band VV-polarized backscatter coefficient (σ°), MODIS daytime land-surface temperature (LST), and a topographic wetness index (TWI) derived from the SRTM 30 m DEM.
The random-forest model was trained on SMAP/in-situ collocations pooled across all eight stations and all available dates (n = 1,824 observations). SMAP Level-3 enhanced data (9 km) provided the coarse-scale constraint, and the random-forest residuals were added to the spatially interpolated SMAP field to produce a 1 km product. The model was retrained monthly to accommodate seasonal changes in vegetation cover and surface roughness [6] .
Spatial Data Processing
SMAP data were downloaded from the National Snow and Ice Data Center in HDF-5 format and reprojected to WGS 84 / UTM Zone 31N. Sentinel-1 ground-range-detected images were accessed through Google Earth Engine, radiometrically calibrated, and terrain-corrected. A speckle filter (refined Lee, 7 × 7 window) was applied before extracting σ° for each 1 km target pixel. MODIS MOD11A1 LST was gap-filled using temporal interpolation across cloud-affected days, and values were resampled to the same 1 km grid. The TWI was computed as TWI = ln (a / tan β), where a is the upslope contributing area and β is the local slope angle [9] .
Material and Methods Material
Eight soil-moisture monitoring stations were established along a transect from Dakar (14.7°N, 17.5°W) to N'Djamena (12.1°N, 15.0°E), spanning the Sahelian rainfall gradient from approximately 350 mm/yr in the east to 550 mm/yr in the west. Each station was equipped with a Sentek EnviroSCAN capacitance probe installed at 10 cm depth, logging volumetric water content at 30-minute intervals.
Stations were calibrated against gravimetric samples at installation and at six-monthly intervals. Data covered the period March 2021 through October 2022, encompassing two complete growing seasons. Millet yield records for the corresponding administrative districts were obtained from national agricultural statistics offices. All data processing was conducted at the Faculty of Geospatial Sciences, Fez, Fès-Meknès, Morocco [10] .
Methods
Validation of the downscaled product used a leave-onestation-out cross-validation: for each station, the randomforest model was retrained on the remaining seven and predictions were compared against the withheld station's insitu data. Performance metrics included Pearson's r, bias, and ubRMSE. A drought-stress index (DSI) was calculated for each 1 km pixel as the cumulative number of dekads during the July-September flowering window in which soil moisture fell below 12%-the approximate permanent wilting point for millet on sandy Sahelian soils [11] . The DSI was then correlated with district-level millet yield anomalies (deviation from the 10-year mean) using Spearman's ρ.
Significance was set at α = 0.05. The overall ubRMSE of 0.038 m³/m³ meets the SMAP mission accuracy target of 0.04 m³/m³. Performance was best at Niamey (ubRMSE = 0.029) and weakest at N'Djamena (0.048), where irrigated peri-urban plots introduce sub-pixel heterogeneity that the model cannot resolve. The heatmap reveals a pronounced wet-season pulse (July-September) across all stations, with the wettest conditions at Mopti and Bamako in the western Sahel. Dry-season moisture drops below 8% everywhere except Dakar, where coastal proximity moderates the decline.
Results
Results
Discussion
The ubRMSE of 0.038 m³/m³ achieved here is comparable to downscaling results reported for the SMAP product in the U.S. Southern Great Plains (0.035 m³/m³) by Colliander et al. [4] , and slightly better than the 0.042 m³/m³ obtained by Ojha et al. [12] over the Indian subcontinent. The Sahel's relatively flat terrain and sparse vegetation simplify the radiometric signal, but the coarse sandy soils and rapid drainage after rain events create sharp temporal gradients that challenge the 2-3-day revisit interval of SMAP. The drought-stress index correctly flagged 82% of districtlevel yield shortfalls-a promising result, though it leaves 18% undetected. Most misclassifications occurred in districts where localized convective storms produced adequate rainfall over part of the district while the remainder remained dry, averaging out to near-normal yields despite sub-district drought pockets [13] . Finerresolution yield data (sub-district or village level) would improve the evaluation. A practical consideration for operational adoption is latency: the SMAP Level-3 product is available within three days of acquisition, and the downscaling model runs in near-real time on Google Earth Engine, making it feasible to issue drought alerts within a week data collection [14] . Coupling the DSI with seasonal weather forecasts could extend the lead time to several weeks, giving farmers and food-security agencies a wider decision window.
Conclusion
This research demonstrated that SMAP soil moisture can be downscaled to 1 km across the Sahel with an accuracy (ubRMSE = 0.038 m³/m³) that meets the satellite mission's target specification. The downscaled product captured the monsoon-driven seasonal cycle and the west-to-east rainfall gradient with minimal bias. A drought-stress index derived from the product correctly identified 82% of district-level millet yield shortfalls, confirming its potential as an earlywarning indicator for rainfed crop-water deficits.
For food-security agencies, the implication is that satellite soil-moisture monitoring can now supplement, though not replace, ground-based rainfall networks in the Sahel. Future work should extend the validation to additional sensors (SMOS, Sentinel-1 standalone) and should incorporate rootzone soil-moisture estimates through data assimilation into land-surface models.
Acknowledgement
Acknowledgements Funding Sources
Figures and tables from the paper
| Station | r | Bias (m³/m³) | ubRMSE (m³/m³) | n (obs) |
|---|---|---|---|---|
| Dakar | 0.89 | −0.008 | 0.034 | 228 |
| Bamako | 0.91 | +0.004 | 0.031 | 231 |
| Ouagadougou | 0.87 | +0.011 | 0.042 | 224 |
| Niamey | 0.92 | −0.003 | 0.029 | 237 |
| Kano | 0.86 | +0.013 | 0.044 | 219 |
| Zinder | 0.88 | +0.007 | 0.037 | 226 |
| Mopti | 0.90 | −0.005 | 0.033 | 230 |
| N'Djamena | 0.84 | +0.016 | 0.048 | 229 |
| All stations | 0.88 | +0.004 | 0.038 | 1,824 |
Table text extracted from the original PDF; superscript letters are shown inline. The original table image is below.
View original table image
References
14 in the original paper- Seneviratne SI, Corti T, Davin EL, Hirschi M, Jaeger EB, Lehner I, et al. Investigating soil moisture-climate interactions in a changing climate: a review. EarthScience Reviews. 2010;99(3-4):125-161.
- Sultan B, Baron C, Dingkuhn M, Sarr B, Janicot S. Agricultural impacts of large-scale variability of the West African monsoon. Agricultural and Forest Meteorology. 2005;128(1-2):93-110.
- Pellarin T, Laurent JP, Cappelaere B, Decharme B, Descroix L, Ramier D. Hydrological modelling and associated microwave emission of a semi-arid region in southwestern Niger. Journal of Hydrology. 2009;375(12):262-272.
- Colliander A, Jackson TJ, Bindlish R, Chan S, Das N, Kim SB, et al. Validation of SMAP surface soil moisture products with core validation sites. Remote Sensing of Environment. 2017;191:215-231.
- Peng J, Loew A, Merlin O, Verhoest NEC. A review of spatial downscaling of satellite remotely sensed soil moisture. Reviews of Geophysics. 2017;55(2):341-366.
- Merlin O, Escorihuela MJ, Mayoral MA, Hagolle O, Al Bitar A, Kerr Y. Self-calibrated evaporation-based disaggregation of SMOS soil moisture. Remote Sensing of Environment. 2013;128:7-18.
- Djamai N, Magagi R, Goïta K, Hosseini M, Cosh MH, Berg A, et al. Evaluation of SMAP soil moisture products over the CanEx-SM10 area. Remote Sensing. 2015;7(10):13783-13802.
- Lebel T, Ali A. Recent trends in the Central and Western Sahel rainfall regime (1990-2007). Journal of Hydrology. 2009;375(1-2):52-64.
- Beven KJ, Kirkby MJ. A physically based, variable contributing area model of basin hydrology. Hydrological Sciences Bulletin. 1979;24(1):43-69.
- De Rosnay P, Polcher J, Bruen M, Laval K. Impact of a physically based soil water flow and soil-plant interaction representation for modeling large-scale land surface processes. Journal of Geophysical Research. 2002;107(D11):4118.
- Doorenbos J, Kassam AH. Yield Response to Water. FAO Irrigation and Drainage Paper No. 33. 1979;Rome:1-193.
- Ojha N, Merlin O, Molero B, Suere C, Olivera-Guerra L, Ait Hssaine B, et al. Stepwise disaggregation of SMAP soil moisture at 100 m resolution using Landsat7/8 data and a varying intermediate resolution. Remote Sensing. 2019;11(16):1863.
- Nicholson SE. The West African Sahel: a review of recent studies on the rainfall regime and its interannual variability. ISRN Meteorology. 2013;2013:453521.
- McNally A, Husak GJ, Brown M, Carroll M, Funk C, Yatheendradas S, et al. Calculating crop water requirement satisfaction in the West Africa Sahel with remotely sensed soil moisture. Journal of Hydrometeorology. 2015;16(1):295-305.