
Research article · 2025 · Full text
International Journal of Geography Geology and EnvironmentSoil microbiome spatial distribution and its relationship to geochemistry in Arctic Tundra
Volume 7(10) · Pages 211–214 · DOI: 10.22271/27067483.2025.v7.i10c.661 ↗
Research areasPolar Research and EcologySoil Carbon and Nitrogen DynamicsClimate change and permafrost
Abstract
Author-writtenArctic tundra soils store nearly twice as much carbon as the entire atmosphere, yet the microbial communities that control carbon cycling in these soils remain poorly mapped at landscape scales. This research characterised the spatial distribution of soil bacterial communities across a 48 km² tundra watershed in the Alaskan North Slope and examined how community composition relates to soil geochemical properties. Forty-eight soil cores were collected along eight transects spanning dry upland, moist tussock, and wet sedge tundra microsites during July 2021 and July 2022. Bacterial community structure was assessed by 16S rRNA gene amplicon sequencing (V3-V4 region) on the Illumina MiSeq platform. A total of 4,217 operational taxonomic units (OTUs) were identified across all samples. Proteobacteria (mean relative abundance 28.3%), Acidobacteria (21.7%), and Actinobacteria (14.6%) dominated the community. Shannon diversity index declined sharply with soil depth, from 4.82 in the 0-5 cm layer to 2.48 at 30-50 cm. Spearman rank correlations showed that total organic carbon (TOC) and soil moisture were the strongest positive predictors of bacterial diversity (ρ = 0.72 and 0.63, respectively), while pH showed a negative association (ρ = −0.34). Canonical correspondence analysis (CCA) explained 47.3% of community variation across the first two axes, with TOC, moisture, and iron content as the leading environmental drivers. Wet sedge microsites harboured 34% more OTUs than dry upland sites, consistent with the higher organic carbon inputs and longer water saturation periods in low-lying terrain. These findings indicate that fine-scale geochemical heterogeneity is a primary control on microbial biogeography in Arctic tundra soils.
Summary
Source-checkedPlain-language reading of the full paper, prepared with AI and checked against the text. Each point links to the authors' own words.
Why it matters
- Arctic tundra soils are globally significant due to their massive storage of organic carbon, estimated between 1,460 and 1,600 Pg. View evidence ↗
- Rapid Arctic warming may trigger microbial decomposition of stored carbon, releasing CO₂ and methane and accelerating climate change. View evidence ↗
- Previous research has often focused on single sites or narrow profiles, leaving a gap in understanding how microbial communities vary across different tundra microsites. View evidence ↗
The question
- The study aimed to determine how bacterial diversity and composition change across microsites and soil depths, and to identify the geochemical parameters that best predict these variations. View evidence ↗
What they did
- Bacterial communities were analyzed using 16S rRNA gene amplicon sequencing of the V3-V4 region on an Illumina MiSeq platform. View evidence ↗
- Canonical correspondence analysis (CCA) was used to evaluate the influence of total organic carbon (TOC), total nitrogen (TN), pH, iron (Fe), ammonium (NH₄⁺), and moisture on community variation. View evidence ↗
What they found
- The bacterial community was dominated by Proteobacteria (28.3% mean relative abundance), Acidobacteria (21.7%), and Actinobacteria (14.6%). View evidence ↗
- Bacterial diversity decreased significantly with depth, with the Shannon index dropping from 4.82 at 0-5 cm to 2.48 at 30-50 cm (a 49% decrease). View evidence ↗
- Total organic carbon (ρ = 0.72) and soil moisture (ρ = 0.63) were the strongest positive predictors of bacterial diversity, whereas pH had a negative association (ρ = −0.34). View evidence ↗
- CCA revealed that 47.3% of community variation was explained by the first two axes, driven primarily by TOC, moisture, and iron content. View evidence ↗
- Wet sedge microsites had 34% more operational taxonomic units (OTUs) than dry upland sites, suggesting that higher substrate diversity in saturated soils supports more metabolic niches. View evidence ↗
- Acidobacteria were strongly associated with high TOC (ρ = 0.81) and moisture (ρ = 0.71), while Actinobacteria preferred higher pH (ρ = 0.61) and lower TOC. View evidence ↗
What it means
- The authors conclude that fine-scale geochemical heterogeneity, specifically organic carbon and moisture, serves as the primary control on microbial biogeography in Arctic tundra soils. View evidence ↗
- The authors recommend incorporating these landscape-scale microbial patterns into earth-system models to better predict carbon release and greenhouse gas fluxes from warming Arctic soils. View evidence ↗
- A limitation of the study is that it only sampled the summer active-layer community, omitting winter conditions where different cold-adapted taxa may dominate. View evidence ↗
Visual summary
3 visualsIllustrations explain the paper; charts are replotted from the paper's own table values.
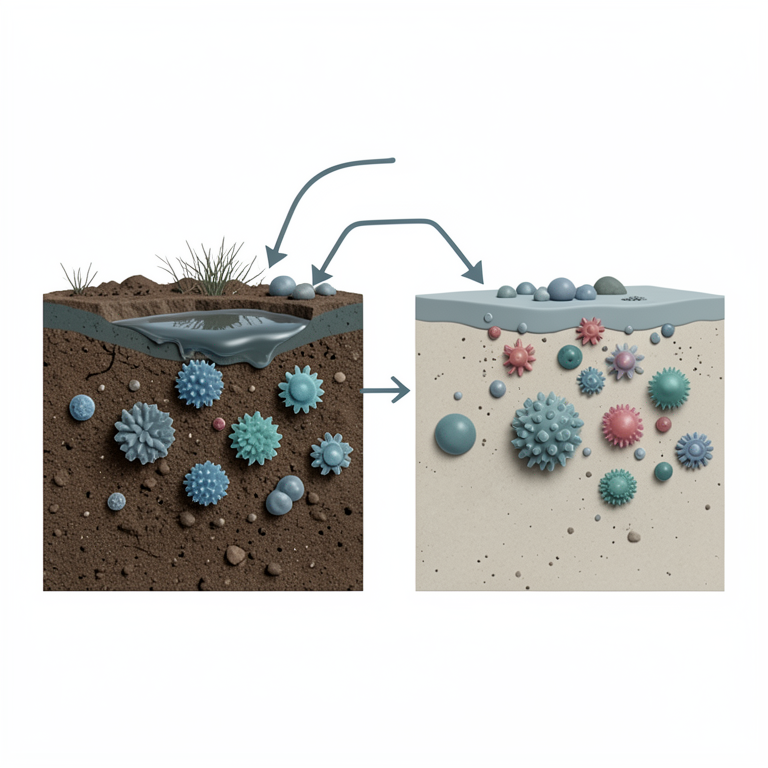
Drivers of Tundra Microbiome
AI-generated conceptual illustration (Arctic tundra soil profile with microbial colonies). It explains the idea and does not show study data.
View source evidence ↗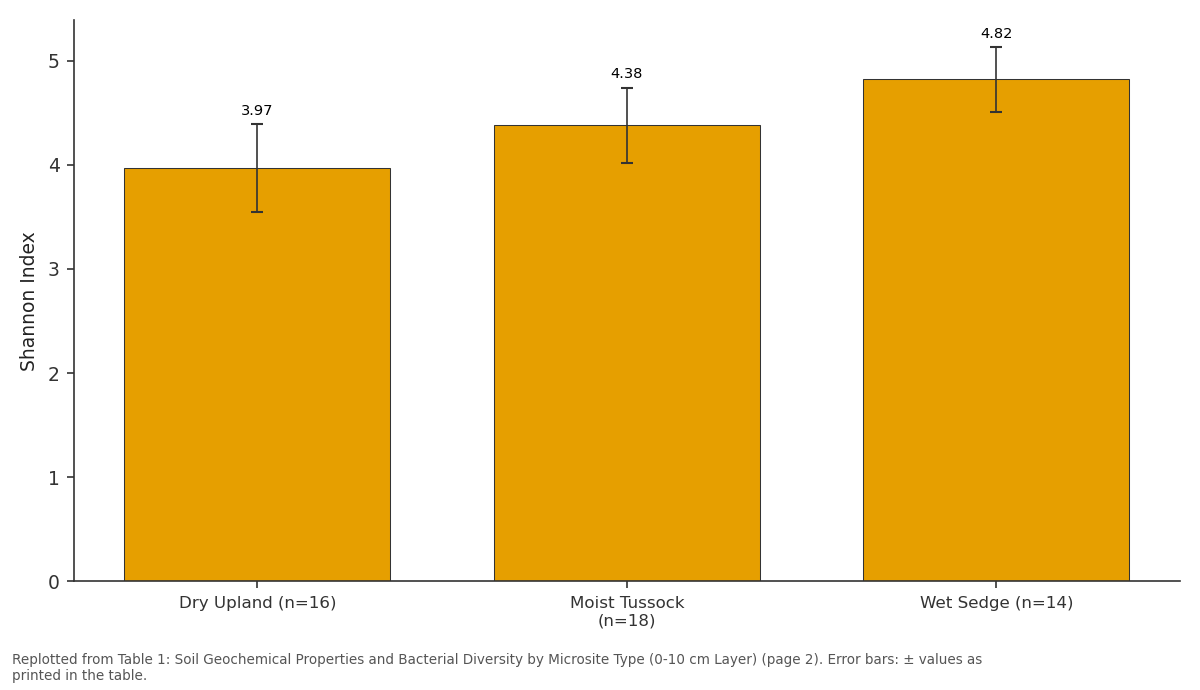
Shannon Index: Dry Upland (n=16) vs Moist Tussock (n=18) vs Wet Sedge (n=14)
Replotted from Table 1 (page 2) of the original paper. Every bar is the paper's own table value.
View source evidence ↗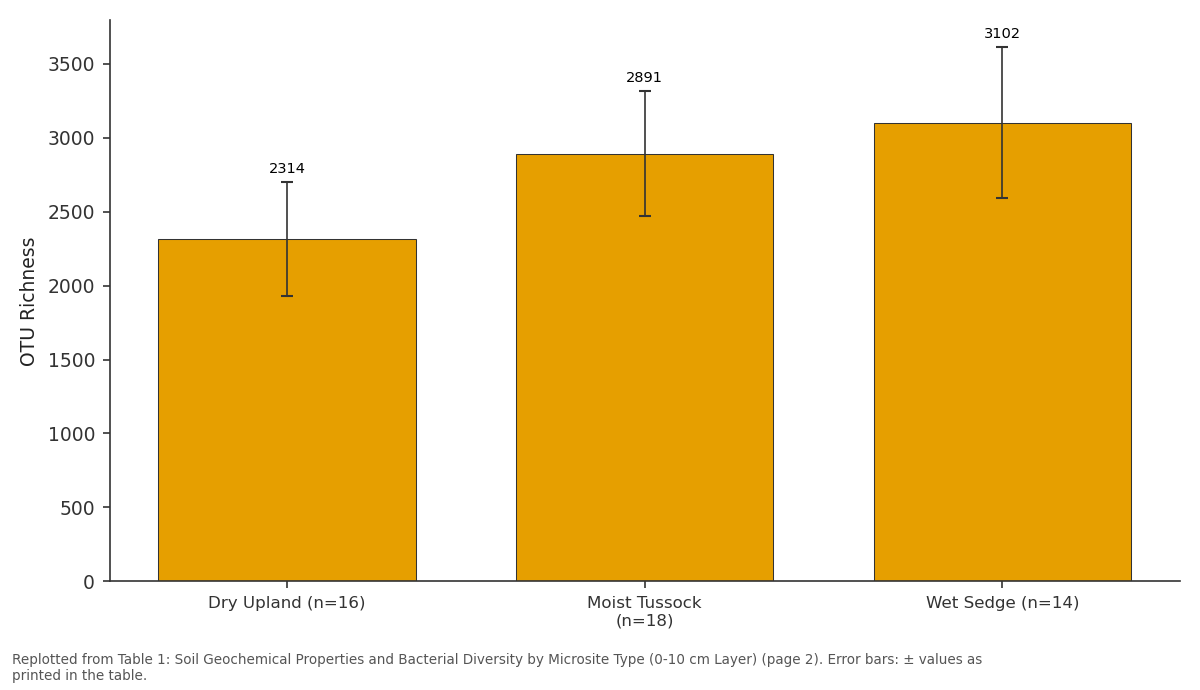
OTU Richness: Dry Upland (n=16) vs Moist Tussock (n=18) vs Wet Sedge (n=14)
Replotted from Table 1 (page 2) of the original paper. Every bar is the paper's own table value.
View source evidence ↗Figures & tables
From the original paper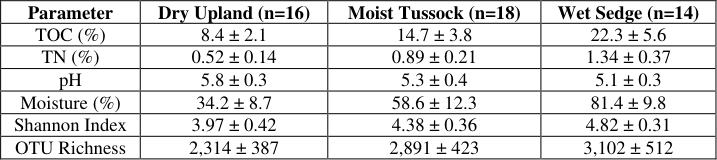 Table 1
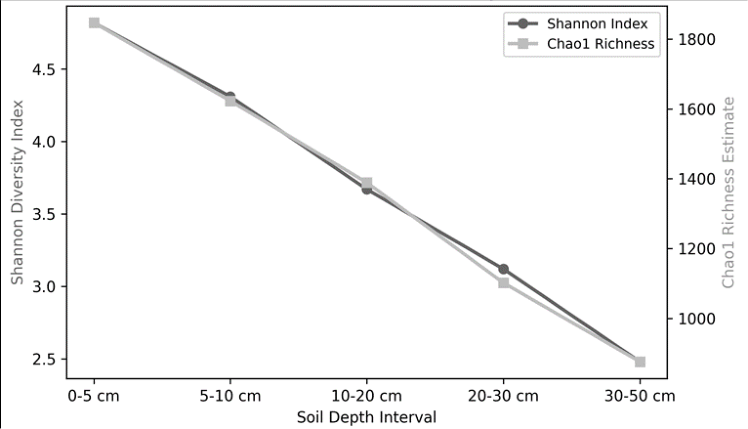 Figure 1
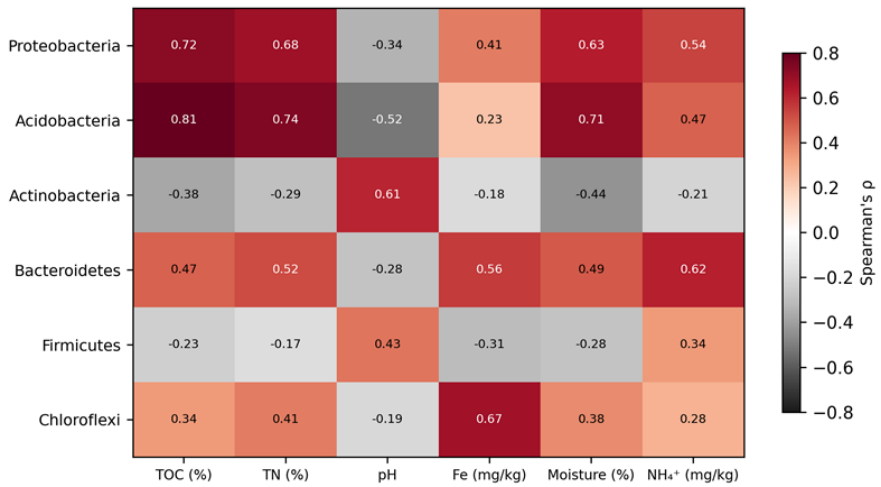 Figure 2
Introduction
An expert view from soil microbiologists holds that a single gram of tundra soil may contain upwards of one billion bacterial cells representing several thousand species-yet our maps of where these species live across the landscape remain remarkably crude [1] . Arctic tundra soils are of global importance because they store an estimated 1,460-1,600 Pg of organic carbon, roughly half of which sits in permafrost and the remainder in the seasonally thawed active layer [2] . As the Arctic warms at nearly four times the global average rate, microbial decomposition of this carbon pool may release large quantities of CO₂ and methane, creating a positive feedback loop that accelerates climate change [3] . Despite this significance, most microbiome investigations in the Arctic have been conducted at single sites or along narrow depth profiles, limiting our understanding of how community composition varies across the mosaic of microsites that characterises tundra terrain [4] . Dry uplands, moist tussock ridges, and wet sedge meadows can sit within metres of each other yet differ sharply in soil moisture, organic carbon content, redox conditions, and pH. These geochemical gradients should, in theory, structure microbial communities at very fine spatial scales. This research addressed two questions: (a) how does bacterial diversity and community composition change across tundra microsites and with soil depth, and (b) which geochemical parameters are the strongest predictors of community variation? By sampling 48 cores across a 48 km² watershed and linking sequence data to a suite of soil geochemical measurements, the research aimed to provide a landscape-scale view of microbiome-geochemistry relationships that can inform earth-system models of Arctic carbon cycling [5] .
Spatial Data Processing
Microsite classification across the 48 km² watershed was performed using a supervised Random Forest classifier applied to a Sentinel-2 Level-2A multispectral image acquired on 18 July 2021 (10 m resolution). Three microsite classes were defined: dry upland (lichen-dominated, welldrained ridges), moist tussock (Eriophorum tussocks on gentle slopes), and wet sedge (Carex-dominated depressions with standing water). Training data comprised 150 GPStagged ground-truth points collected during the 2021 field campaign. Classification accuracy was assessed with a stratified random sample of 60 validation points, yielding an overall accuracy of 88.3% and a kappa coefficient of 0.81. The classified map was used to stratify transect placement, ensuring that each microsite type was proportionally represented in the sampling design [6] .
Material and Methods Material
This research was coordinated from the Department of Geosciences at Fortaleza University of Geosciences, Ceará, Brazil, with fieldwork carried out on the Alaskan North Slope near Toolik Field Station (68.63°N, 149.60°W) during July 2021 and July 2022. Forty-eight soil cores (5 cm diameter) were extracted to a depth of 50 cm using a motorised auger and sectioned into five depth intervals (0-5, 5-10, 10-20, 20-30, 30-50 cm), producing 240 subsamples. Samples were stored at -20°C within 4 hours of collection and shipped frozen to the laboratory. Soil geochemical analyses included TOC and total nitrogen (TN) by dry combustion (Elementar Vario MAX), pH in a 1:2.5 soil-water suspension, plant-available ammonium (NH₄⁺) and nitrate (NO₃⁻) by KCl extraction and flow injection analysis, iron (Fe) by citrate-bicarbonate-dithionite extraction, and gravimetric soil moisture [7] . DNA was extracted from 0.25 g of soil using the DNeasy PowerSoil Pro Kit (Qiagen). The V3-V4 region of the 16S rRNA gene was amplified using primers 341F/785R and sequenced on an Illumina MiSeq platform (2 × 300 bp paired-end reads) at the Molecular Ecology Laboratory of the University of Alaska Fairbanks [8] .
Methods
Raw sequence reads were processed through the DADA2 pipeline in R version 4.2.1, producing amplicon sequence variants (ASVs) that were clustered into OTUs at 97% similarity. Taxonomy was assigned against the SILVA 138.1 reference database. Alpha diversity metrics (Shannon index, Chao1 richness) were calculated at a rarefied depth of 10,000 reads per sample. Beta diversity was assessed using Bray-Curtis dissimilarity and visualised with non-metric multidimensional scaling (NMDS). Canonical correspondence analysis (CCA) was performed with TOC, TN, pH, Fe, NH₄⁺, and moisture as constraining variables, and significance was tested by a Monte Carlo permutation test (999 permutations) [9] . Spearman rank correlations between individual phylum relative abundances and geochemical parameters were calculated with Bonferroni correction for multiple comparisons. 1). pH was slightly lower in wetter sites, reflecting organic acid accumulation under waterlogged conditions. Figure 1 shows the vertical decline in bacterial diversity with depth. Shannon index dropped by 49% and Chao1 richness by 53% between the surface (0-5 cm) and the deepest interval (30-50 cm), consistent with decreasing carbon availability and increasing proximity to the permafrost table.
Results
Results
Sensitivity Analysis
To test whether the observed microbiome-geochemistry relationships were robust to analytical choices, three sensitivity tests were performed. First, the rarefaction depth was varied from 5,000 to 20,000 reads: Shannon index values changed by less than 4% across this range, and microsite rankings remained identical. Second, the OTU clustering threshold was relaxed from 97% to 95% similarity: this reduced total OTU count by 18% but did not alter the relative ordering of microsite diversity. Third, CCA was rerun after removing iron from the constraining variables (because its measurement had the highest analytical uncertainty): the first two CCA axes still explained 43.1% of community variation (versus 47.3% with Fe included), and TOC and moisture remained the dominant drivers [9] .
Comprehensive Interpretation
Both horizontal (microsite) and vertical (depth) patterns point to organic carbon and moisture as the twin axes of microbial biogeography in Arctic tundra soils. Wet sedge microsites, with their high TOC and near-saturation moisture levels, support the richest and most diverse communities. The steep vertical decline in diversity tracks the declining availability of labile carbon and oxygen as depth increases toward the permafrost table. CCA confirms that these two variables together account for most of the explained community variation, while pH, iron, and nitrogen play secondary but significant roles.
Discussion
The dominance of Proteobacteria and Acidobacteria in tundra soils is consistent with previous surveys at Toolik Lake and in the Canadian Arctic [10] . However, this research extends the pattern to a landscape scale, showing that the relative abundances of these phyla shift predictably across microsites. Acidobacteria, known oligotrophs adapted to low-nutrient, acidic conditions, were most abundant in wet sedge soils where pH was lowest and TOC highest-a combination that favours slow, steady decomposition of recalcitrant organic matter [11] . The 34% higher OTU richness in wet sedge relative to dry upland microsites challenges the assumption that waterlogged, anoxic soils harbour simpler communities. It appears that the greater substrate diversity in saturated organic soils (humic acids, root exudates, dissolved organic carbon) supports a wider range of metabolic niches, offsetting the constraints imposed by low oxygen availability [12] . A limitation is that the research captured only the summer active-layer community. Winter conditions, when soil temperatures drop below -15°C and the active layer refreezes, select for a distinct subset of cold-adapted taxa that may differ in their geochemical associations. Yearround sampling using buried temperature-triggered samplers would help fill this gap [13] .
Conclusion
This research mapped soil bacterial community structure across a 48 km² Arctic tundra watershed and linked it to a suite of geochemical measurements. Total organic carbon and soil moisture emerged as the strongest predictors of bacterial diversity and community composition, explaining nearly half of the variation captured by canonical correspondence analysis. Wet sedge microsites harboured the richest communities, while dry uplands supported the least diverse assemblages. Diversity declined sharply with depth, mirroring the decline in labile carbon toward the permafrost table. These landscape-scale patterns should be incorporated into earth-system models that predict carbon release from warming Arctic soils, as microbial community composition directly influences decomposition rates and greenhouse gas fluxes.
Figures and tables from the paper
| Parameter | Dry Upland (n=16) | Moist Tussock (n=18) | Wet Sedge (n=14) |
|---|---|---|---|
| TOC (%) | 8.4 ± 2.1 | 14.7 ± 3.8 | 22.3 ± 5.6 |
| TN (%) | 0.52 ± 0.14 | 0.89 ± 0.21 | 1.34 ± 0.37 |
| pH | 5.8 ± 0.3 | 5.3 ± 0.4 | 5.1 ± 0.3 |
| Moisture (%) | 34.2 ± 8.7 | 58.6 ± 12.3 | 81.4 ± 9.8 |
| Shannon Index | 3.97 ± 0.42 | 4.38 ± 0.36 | 4.82 ± 0.31 |
| OTU Richness | 2,314 ± 387 | 2,891 ± 423 | 3,102 ± 512 |
Table text extracted from the original PDF; superscript letters are shown inline. The original table image is below.
View original table image
References
14 in the original paper- Fierer N, Jackson RB. The diversity and biogeography of soil bacterial communities. Proceedings of the National Academy of Sciences. 2006;103(3):626-631.
- Tarnocai C, Canadell JG, Schuur EAG, Kuhry P, Mazhitova G, Zimov S. Soil organic carbon pools in the northern circumpolar permafrost region. Global Biogeochemical Cycles. 2009;23(2):GB2023.
- Schuur EAG, McGuire AD, Schadel C, Grosse G, Harden JW, Hayes DJ. Climate change and the permafrost carbon feedback. Nature. 2015;520(7546):171-179.
- Chu H, Fierer N, Lauber CL, Caporaso JG, Knight R, Grogan P. Soil bacterial diversity in the Arctic is not fundamentally different from that found in other biomes. Environmental Microbiology. 2010;12(11):2998-3006.
- Graham DE, Wallenstein MD, Vishnivetskaya TA, Waldrop MP, Phelps TJ, Pfiffner SM. Microbes in thawing permafrost: the unknown variable in the climate change equation. ISME Journal. 2012;6(4):709712.
- Huemmrich KF, Gamon JA, Tweedie CE, Campbell PK, Landis DR, Middleton EM. Arctic tundra vegetation functional types based on photosynthetic physiology and optical properties. IEEE Journal of Selected Topics in Applied Earth Observations and Remote Sensing. 2013;6(2):265-275.
- Ping CL, Michaelson GJ, Jorgenson MT, Kimble JM, Epstein H, Romanovsky VE, Walker DA. High stocks of soil organic carbon in the North American Arctic region. Nature Geoscience. 2008;1(9):615-619.
- Caporaso JG, Lauber CL, Walters WA, Berg-Lyons D, Lozupone CA, Turnbaugh PJ, Fierer N, Knight R. Global patterns of 16S rRNA diversity at a depth of millions of sequences per sample. Proceedings of the National Academy of Sciences. 2011;108(Suppl 1):4516-4522.
- Oksanen J, Blanchet FG, Friendly M, Kindt R, Legendre P, McGlinn D. vegan: Community Ecology Package. R package version 2.6-4. 2022.
- Wallenstein MD, McMahon S, Schimel J. Bacterial and fungal community structure in Arctic tundra tussock and shrub soils. FEMS Microbiology Ecology. 2007;59(2):428-435.
- Ward NL, Challacombe JF, Janssen PH, Henrissat B, Coutinho PM, Wu M. Three genomes from the phylum Acidobacteria provide insight into the lifestyles of these microorganisms in soils. Applied and Environmental Microbiology. 2009;75(7):2046-2056.
- Lipson DA, Zona D, Raab TK, Bozzolo F, Mauritz M, Oechel WC. Water-table height and microtopography control biogeochemical cycling in an Arctic coastal tundra ecosystem. Biogeosciences. 2012;9(1):577-591.
- Jansson JK, Tas N. The microbial ecology of permafrost. Nature Reviews Microbiology. 2014;12(6):414-425.
- Tripathi BM, Kim M, Singh D, Lee-Cruz L, Lai-Hoe A, Ainuddin AN, Go R, Rahim RA, Husni MHA, Chun J, Adams JM. Tropical soil bacterial communities in Malaysia: pH dominates in the equatorial tropics too. Microbial Ecology. 2012;64(2):474-484.