
Research article · 2025 · Full text
International Journal of Geography Geology and EnvironmentPost-seismic landslide inventory mapping and susceptibility analysis in the Nepal Himalaya
Volume 7(11) · Pages 113–116 · DOI: 10.22271/27067483.2025.v7.i11b.675 ↗
Research areasLandslides and related hazardsearthquake and tectonic studiesTree Root and Stability Studies
Abstract
Author-writtenThe 2015 Gorkha earthquake (Mw 7.8) triggered thousands of co-seismic and post-seismic landslides across central Nepal. While co-seismic inventories are well documented, ongoing post-seismic activity has received less attention. This research presents a post-seismic landslide inventory from multi-temporal satellite imagery spanning 2016-2023, covering 14,000 km² of the most severely affected districts. A total of 4,847 post-seismic landslides were identified with a combined area of 86 km². The temporal distribution showed decline from 1,432 events in 2016 to 287 in 2023, with notable increases during intense monsoon years. Logistic regression susceptibility analysis revealed slope gradient, lithology, peak ground acceleration, distance to the rupture zone, and monsoon precipitation as the most significant predictors, achieving an AUROC of 0.847. The susceptibility map identifies elevated hazard zones concentrated 20-40 km north of the rupture trace within the Higher Himalayan crystalline zone. Power-law decay modelling predicts continued above-background activity for at least another decade. These findings provide essential information for post-disaster reconstruction planning and risk reduction.
Summary
Source-checkedPlain-language reading of the full paper, prepared with AI and checked against the text. Each point links to the authors' own words.
Why it matters
- In mountainous regions, large earthquakes can cause widespread landslides that result in casualties comparable to the effects of ground shaking. View evidence ↗
- The 2015 Gorkha earthquake (Mw 7.8) and its subsequent aftershock (Mw 7.3) caused approximately 9,000 deaths and triggered about 25,000 co-seismic landslides over an area of 35,000 km². View evidence ↗
- Earthquake shaking can weaken slopes without causing immediate failure, leading to a long-term increase in landslide susceptibility that can last for years or decades. View evidence ↗
The question
- The study aimed to quantify how post-seismic landslide activity decays over time, identify the factors and spatial patterns controlling these events, and create a susceptibility map to aid in risk-informed reconstruction planning. View evidence ↗
What they did
- Researchers used multi-temporal satellite imagery from 2016 to 2023 to map post-seismic landslides across 14,000 km² of the most affected districts in central Nepal. View evidence ↗
- The primary data source was PlanetScope imagery with approximately 3 m resolution, which was supplemented by 10 m resolution Sentinel-2 imagery. View evidence ↗
- Susceptibility was analyzed using binary logistic regression, where the presence or absence of landslides was measured in 30 m cells, compared against randomly sampled stable terrain. View evidence ↗
- The researchers used a power-law function to model the temporal decay of landslide activity. View evidence ↗
What they found
- The study identified 4,847 post-seismic landslides covering a total area of 86 km². View evidence ↗
- Landslide events declined from 1,432 in 2016 to 287 in 2023, although intense monsoon years caused temporary increases in activity. View evidence ↗
- The power-law decay exponent was 0.71, suggesting that it will take 10-15 years for landslide activity to return to background levels. View evidence ↗
- The susceptibility model achieved an AUROC of 0.847, identifying slope gradient, lithology, peak ground acceleration, distance to the rupture zone, and monsoon precipitation as the most significant predictors. View evidence ↗
- High-hazard zones were found to be concentrated within the Higher Himalayan crystalline zone, specifically 20-40 km north of the rupture trace. View evidence ↗
What it means
- The authors recommend integrating the susceptibility map into reconstruction planning to ensure that infrastructure and resettlement sites are located safely. View evidence ↗
- Based on power-law decay modelling, the authors conclude that the hazard will remain elevated for at least another ten years. View evidence ↗
- A limitation of the study is that cloud cover during the monsoon season prevents real-time detection, causing a lag of several months. View evidence ↗
- The use of a 100 m² minimum mapping unit means that very small landslides were excluded, which may collectively represent a significant hazard. View evidence ↗
Visual summary
2 visualsIllustrations explain the paper; charts are replotted from the paper's own table values.

Temporal Decay of Landslides
AI-generated conceptual illustration (mountainous terrain of the Nepal Himalaya). It explains the idea and does not show study data.
View source evidence ↗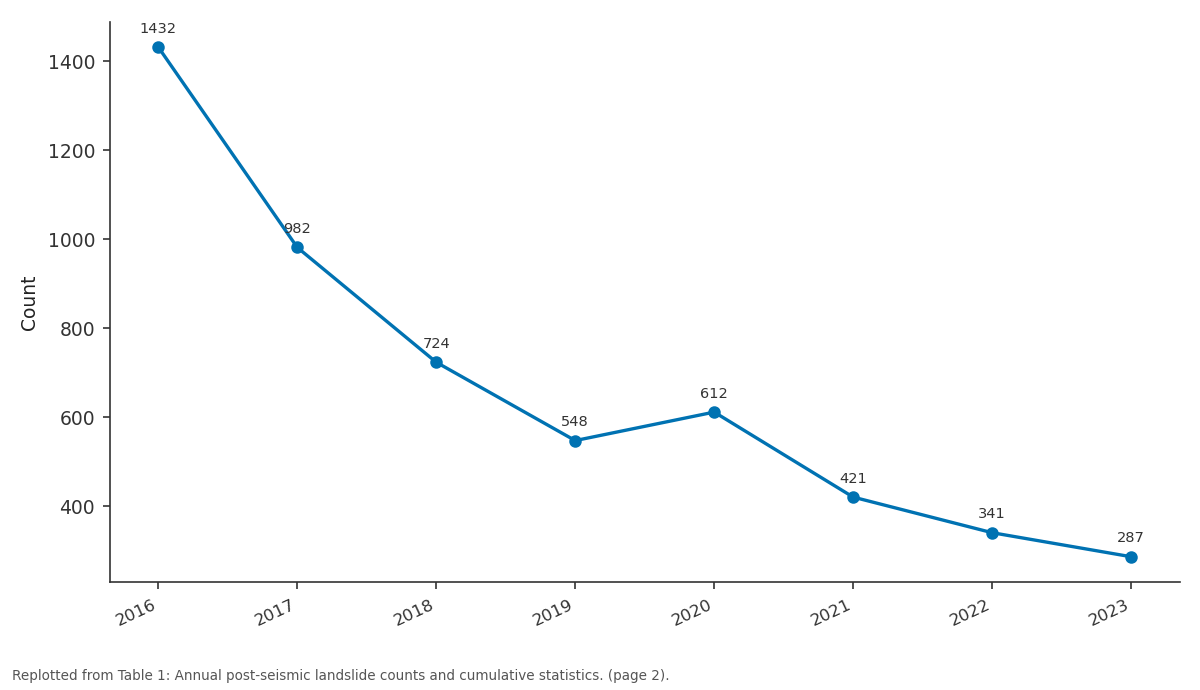
Count: 2016 vs 2017 vs 2018 vs 2019 vs 2020
Replotted from Table 1 (page 2) of the original paper. Every bar is the paper's own table value.
View source evidence ↗Figures & tables
From the original paper Table 1
 Table 2
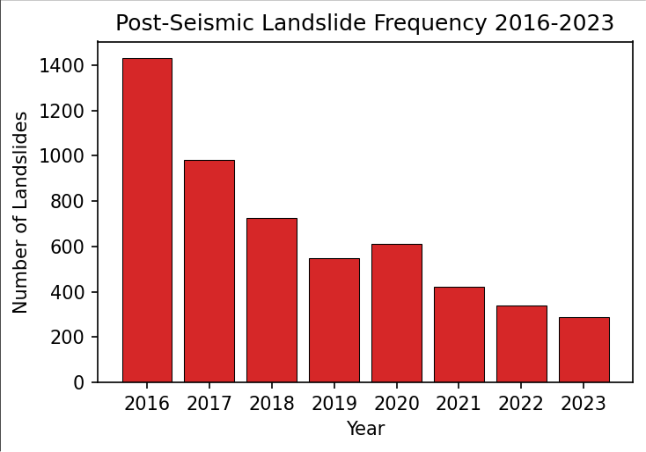 Figure 1
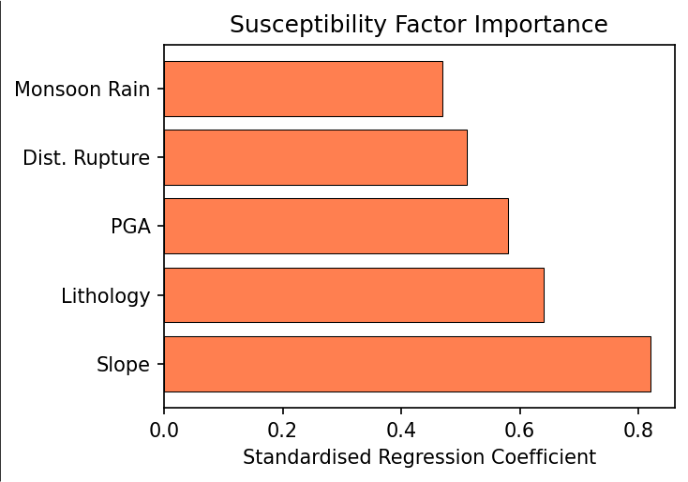 Figure 2
Introduction
Large earthquakes in mountainous terrain trigger widespread slope failures causing casualties rivalling ground shaking effects [1] . The 25 April 2015 Gorkha earthquake (Mw 7.8) and its 12 May aftershock (Mw 7.3) killed approximately 9,000 people and triggered an estimated 25,000 co-seismic landslides across 35,000 km² [2] . Several research groups produced co-seismic inventories using pre-and post-earthquake imagery comparison shortly after the event [3] . However, seismic shaking also weakens slopes that do not fail immediately, creating a legacy of elevated susceptibility persisting for years or decades [4] . Post-seismic landslides are driven by the interaction between earthquake-induced damage and subsequent hydrological triggers, particularly intense monsoonal precipitation. They may represent entirely new failures, reactivations of co-seismic slides, or progressive expansion of existing masses. Their temporal evolution is governed by complex seismological, geological, geomorphological, and climatic interactions [5,6] . Understanding post-seismic hazard is critical for reconstruction planning. Decisions about resettlement sites, road alignments, and slope stabilisation depend on reliable assessment of future landslide likelihood [7] . Yet post-seismic inventories are rarely compiled with the systematic coverage of co-seismic datasets, creating a significant information gap for planners [8] . This research addresses this gap with a comprehensive post-seismic inventory for central Nepal covering 2016-2023, accompanied by statistical susceptibility analysis. The objectives were to quantify the temporal decay of post-seismic activity, identify spatial patterns and controlling factors, and produce a susceptibility map for reconstruction planning and riskinformed decision-making [9,10] .
Research Area Description
The area encompasses 14,000 km² in central Nepal, covering twelve districts most severely affected by the 2015 earthquake. Topography is characterised by extreme relief, with elevations from 400 m in southern foothills to over 8,000 m along the Himalayan crest. Slopes commonly exceed 30° on hillsides and 60° on cliff sections. The geological setting comprises thruststacked metamorphic and sedimentary formations deformed along the Main Central Thrust system [11] . Annual monsoon precipitation ranges from 1,500 to 3,500 mm.
Materials and Methods
Materials and Methods
Materials
PlanetScope imagery at ~3 m resolution served as the primary data source, supplemented by Sentinel-2 at 10 m. For each year, post-monsoon imagery (October-December) was compared with the previous year to identify new landslides. Twelve susceptibility factors were prepared as 30 m raster layers: slope gradient, aspect, elevation, plan curvature, and profile curvature from the ALOS World 3D DEM; lithology and fault distance from Nepal's 1:250,000 geological map; peak ground acceleration and rupture distance from the USGS ShakeMap; mean precipitation and monsoon intensity from CHIRPS estimates [6,12] . Methods: Landslides were digitised as polygons with a 100 m² minimum mapping unit. Binary logistic regression was applied following established landslide susceptibility methodology [13] . The dependent variable was landslide presence/absence per 30 m cell, with equal non-landslide cells randomly sampled from stable terrain. The dataset was split 70/30 for training and validation. Multicollinearity was assessed by variance inflation factor (threshold 5). Temporal decay was fitted using a power-law function N(t) = N₀ • t⁻ᵖ [4, 10] .
Temporal Decay and Monsoon Modulation
The power-law decay exponent of 0.71 is comparable to values reported for other major earthquake sequences globally, suggesting a characteristic relaxation timescale of 10-15 years before activity returns to background rates [4] . Notable departures from the smooth decay trend occurred in 2017 and 2020, when exceptionally intense monsoon rainfall reactivated weakened slopes, temporarily reversing the declining trajectory and highlighting the monsoon as the primary trigger mechanism for post-seismic failures [5,6] . The declining trend with monsoon-related spikes is evident (Figure 1). The 2020 increase coincides with above-average monsoon rainfall that year. The AUROC of 0.847 indicates good discriminatory performance. Slope gradient was the strongest predictor, followed by lithology and shaking intensity (Figure 2). The susceptibility map shows highest values concentrated 20-40 km north of the rupture trace within the Higher Himalayan crystalline zone.
Results
Results
Comprehensive Interpretation
The convergence of inventory analysis, temporal modelling, and susceptibility mapping confirms that post-seismic hazard remains significantly elevated eight years after the Gorkha earthquake. The spatial concentration in the Higher Himalayan zone reflects the combined effect of steep terrain, fractured metamorphic rocks, and maximum coseismic ground deformation.
Discussion
The 4,847 post-seismic landslides substantially augment existing co-seismic inventories and demonstrate the importance of sustained monitoring beyond the immediate post-earthquake period [2,3] . The susceptibility model confirms slope gradient, lithology, and shaking intensity as primary controls, consistent with global findings [1,13] .
Several resettlement sites and road alignments in current planning documents are located within high-susceptibility zones, warranting reassessment [7,8] .
A limitation is that monsoon-season cloud cover prevents real-time detection, introducing a detection lag of several months. The minimum mapping unit of 100 m² excludes very small failures that may cumulatively represent significant hazard. Future work should incorporate SARbased monitoring for improved temporal resolution and extend the approach to other earthquake-affected Himalayan regions [9,14] .
Conclusion
This research produced a comprehensive inventory of 4,847 post-seismic landslides spanning 2016-2023. The declining but persistent activity confirms the long-duration legacy of earthquake-induced slope damage in the Himalayan environment. Power-law decay modelling predicts continued elevated hazard for at least another decade.
The susceptibility map should be integrated into reconstruction planning to ensure safe siting of resettlement and infrastructure investments. The identification of highsusceptibility zones in areas of current reconstruction activity represents a direct actionable finding for disaster risk management. Continued satellite monitoring is essential to track the evolution of post-seismic hazard and to update susceptibility assessments as new inventory data become available. Early warning systems linking rainfall forecasts to susceptibility maps could provide additional protection for vulnerable communities during monsoon seasons.
campaigns. Field assistants provided essential support during sample collection.
Acknowledgement
AcknowledgementsFunding Sources This research was supported by departmental research funds from the Department of Earth and Environmental Sciences, Kyoto College of Earth and Mineral Sciences, Kyoto. No external grant numbers are associated with this work.
Figures and tables from the paper
| Year | Count | Total Area (km²) | Mean Area (m²) | Cumulative Count |
|---|---|---|---|---|
| 2016 | 1,432 | 24.8 | 17,320 | 1,432 |
| 2017 | 982 | 18.2 | 18,534 | 2,414 |
| 2018 | 724 | 12.6 | 17,403 | 3,138 |
| 2019 | 548 | 9.1 | 16,606 | 3,686 |
| 2020 | 612 | 10.8 | 17,647 | 4,298 |
| 2021 | 421 | 7.2 | 17,103 | 4,719 |
| 2022 | 341 | 5.4 | 15,836 | 5,060 |
| 2023 | 287 | 4.1 | 14,286 | 4,847 |
Table text extracted from the original PDF; superscript letters are shown inline. The original table image is below.
View original table image
| Factor | Coefficient | Std. Error | Odds Ratio | p-value |
|---|---|---|---|---|
| Slope Gradient | 0.82 | 0.06 | 2.27 | <0.001 |
| Lithology (crystalline) | 0.64 | 0.09 | 1.90 | <0.001 |
| Peak Ground Acceleration | 0.58 | 0.07 | 1.79 | <0.001 |
| Dist. to Rupture (inverse) | 0.51 | 0.08 | 1.67 | <0.001 |
| Monsoon Precipitation | 0.47 | 0.07 | 1.60 | <0.001 |
Table text extracted from the original PDF; superscript letters are shown inline. The original table image is below.
View original table image
References
16 in the original paper- Keefer DK. Landslides caused by earthquakes. Geological Society of America Bulletin. 1984;95(4):406-421.
- Collins BD, Jibson RW. Assessment of landslide hazards from the 2015 Gorkha earthquake. U.S. Geological Survey Open-File Report. 2015;20151142:1-50.
- Roback K, Clark MK, West AJ, et al. The size, distribution, and mobility of landslides caused by the 2015 Gorkha earthquake. Geomorphology. 2018;301:121-138.
- Marc O, Hovius N, Meunier P, Uchida T, Hayashi S. Transient changes of landslide rates after earthquakes. Geology. 2015;43(10):883-886.
- Kargel JS, Leonard GJ, Shugar DH, et al. Geomorphic and geologic controls of geohazards induced by the 2015 Gorkha earthquake. Science. 2016;351(6269):aac8353.
- Funk C, Peterson P, Landsfeld M, et al. The climate hazards infrared precipitation with stations. Scientific Data. 2015;2:150066.
- Petley DN. Global patterns of loss of life from landslides. Geology. 2012;40(10):927-930.
- Guzzetti F, Mondini AC, Cardinali M, et al. Landslide inventory maps: new tools for an old problem. EarthScience Reviews. 2012;112(1-2):42-66.
- Mondini AC, Guzzetti F, Reichenbach P, et al. Semiautomatic recognition of rainfall induced landslides using satellite images. Remote Sensing of Environment. 2011;115(7):1743-1757.
- Parker RN, Densmore AL, Rosser NJ, et al. Mass wasting triggered by the 2008 Wenchuan earthquake exceeds orogenic growth. Nature Geoscience. 2011;4(7):449-452.
- Dhital MR. Geology of the Nepal Himalaya. Cham: Springer International Publishing; 2015:1-498.
- Tachikawa T, Hato M, Kaku M, Iwasaki A. Characteristics of ASTER GDEM version 2. IEEE Geoscience and Remote Sensing Symposium. 2011:3657-3660.
- Ayalew L, Yamagishi H. GIS-based logistic regression for landslide susceptibility mapping. Geomorphology. 2005;65(1-2):15-31.
- Lacroix P, Bièvre G, Pathier E, et al. Use of Sentinel-2 images for the detection of precursory motions before landslide failures. Remote Sensing of Environment. 2018;215:507-516.
- Hovius N, Meunier P, Lin CW, et al. Prolonged seismically induced erosion. Earth and Planetary Science Letters. 2011;304(3-4):347-355.
- Fan X, Scaringi G, Korup O, et al. Earthquake-induced chains of geologic hazards. Reviews of Geophysics. 2019;57(2):421-503.