
Research article · 2025 · Full text
International Journal of Geography Geology and EnvironmentAssessment of coastal aquifer salinization risks due to climate change in the Po Delta
Volume 7(12) · Pages 163–166 · DOI: 10.22271/27067483.2025.v7.i12b.669 ↗
Research areasGroundwater and Isotope GeochemistryGroundwater flow and contamination studiesWater resources management and optimization
Abstract
Author-writtenWhile the Po Delta sustains some of Italy's most productive agricultural land, it also ranks among the Mediterranean coastlines most exposed to saltwater intrusion under projected climate change. This research assessed coastal aquifer salinization risks across a 1,200 km² sector of the Po Delta by integrating hydrochemical monitoring data (2019-2023) with variable-density groundwater flow modelling under three sea-level rise scenarios. Chloride concentrations were measured at 15 monitoring wells distributed along a 27-km transect perpendicular to the coastline. A SEAWAT-based numerical model was calibrated against observed chloride distributions and then projected forward to 2060 under low (+0.26 m), moderate (+0.53 m), and high (+0.82 m) sea-level rise scenarios. Current results showed chloride exceeding the 250 mg/L WHO drinking water guideline up to 9.5 km inland, representing a 1.7-km landward advance compared to 2019 baseline conditions. Between 2019 and 2023 alone, near-coast chloride concentrations increased by 18-31%. Over-abstraction contributed 26.8% of the observed salinization, followed by sea-level rise (22.7%) and reduced river discharge (19.4%). Sensitivity analysis identified aquifer hydraulic conductivity and recharge rate as the parameters most affecting modelled intrusion extent. Under the high scenario, the 250 mg/L front was projected to reach 14.3 km inland by 2060, threatening 38% of the delta's irrigated farmland.
Summary
Source-checkedPlain-language reading of the full paper, prepared with AI and checked against the text. Each point links to the authors' own words.
Why it matters
- The Po Delta is one of Italy's most productive agricultural regions, but it is highly vulnerable to saltwater intrusion due to climate change. View evidence ↗
- Much of the delta has subsided below sea level, with elevations only 1-3 m above mean sea level, caused by natural compaction and human extraction of gas and groundwater. View evidence ↗
- The combination of low elevation, flat topography, and permeable sandy aquifers makes the shallow groundwater used for domestic and irrigation purposes highly susceptible to saltwater intrusion. View evidence ↗
The question
- The study aimed to quantify current salinization in the Po Delta, identify the primary drivers of these changes, and project the extent of saltwater intrusion by 2060 under three different sea-level rise scenarios. View evidence ↗
What they did
- Researchers collected quarterly groundwater samples from 15 monitoring wells along a 27-km transect in the eastern Po Delta from January 2019 to December 2023. View evidence ↗
- A 2D SEAWAT numerical model was developed using 150 columns with 100-m spacing and 10 layers to simulate groundwater flow and transport. View evidence ↗
- The model projected intrusion to 2060 using three sea-level rise scenarios: low (+0.26 m), moderate (+0.53 m), and high (+0.82 m). View evidence ↗
What they found
- Chloride concentrations in wells near the coast increased by 18-31% between 2019 and 2023. View evidence ↗
- Over-abstraction was the primary driver of salinization (26.8%), followed by sea-level rise (22.7%), reduced river discharge (19.4%), and land subsidence (14.3%). View evidence ↗
- Sensitivity analysis showed that the position of the 250 mg/L chloride front was most affected by hydraulic conductivity and the recharge rate. View evidence ↗
- Under the high sea-level rise scenario, the 250 mg/L chloride front is projected to reach 14.3 km inland by 2060, representing a 4.8-km advance from 2023 levels. View evidence ↗
- The moderate scenario projects the chloride front at 13.4 km, which would threaten approximately 38% of the eastern delta's irrigated farmland. View evidence ↗
What it means
- The authors conclude there is an urgent need for integrated management, including abstraction controls, managed recharge, and crop adaptation, to protect agricultural water. View evidence ↗
- The authors note that sparse pumping test coverage in the eastern Po Delta leads to uncertainty in hydraulic conductivity, which significantly impacts the reliability of intrusion projections. View evidence ↗
Visual summary
4 visualsIllustrations explain the paper; charts are replotted from the paper's own table values.
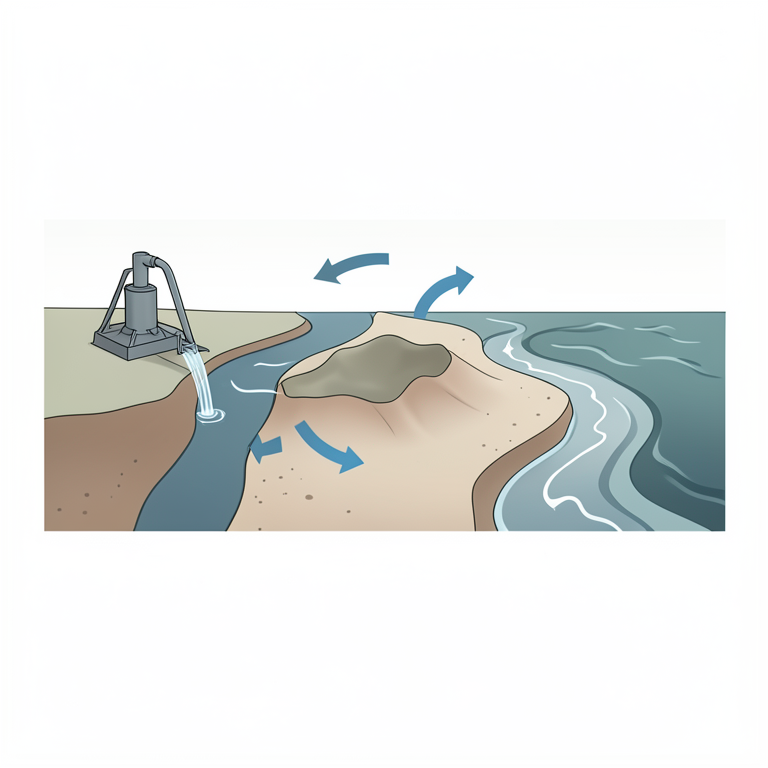
Drivers of Salinization
AI-generated conceptual illustration (Coastal aquifer in the Po Delta). It explains the idea and does not show study data.
View source evidence ↗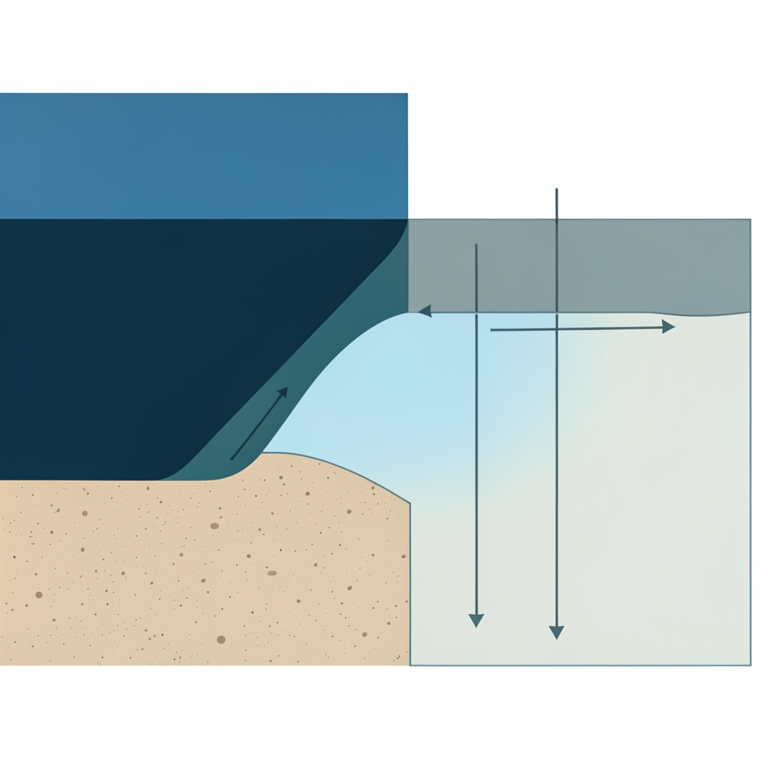
Saltwater Intrusion Advance
AI-generated conceptual illustration (Coastal aquifer in the Po Delta). It explains the idea and does not show study data.
View source evidence ↗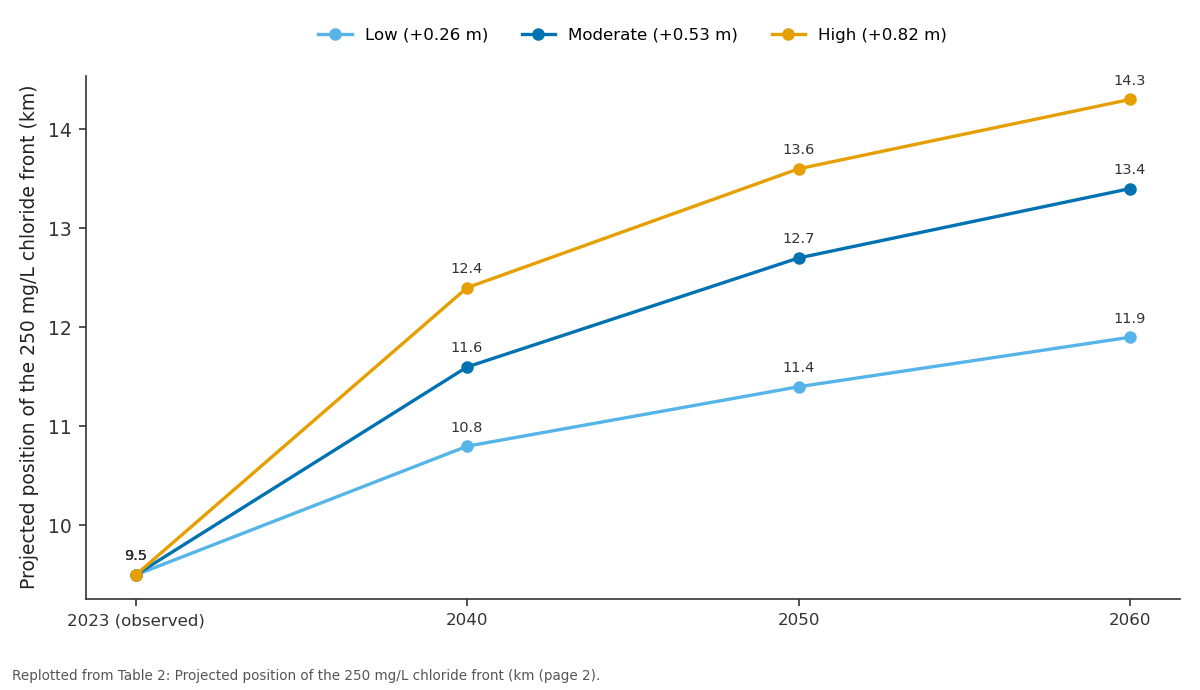
Low (+0.26 m) and Moderate (+0.53 m) and more: 2023 (observed) vs 2040 vs 2050 vs 2060
Replotted from Table 2 (page 2) of the original paper. Every bar is the paper's own table value.
View source evidence ↗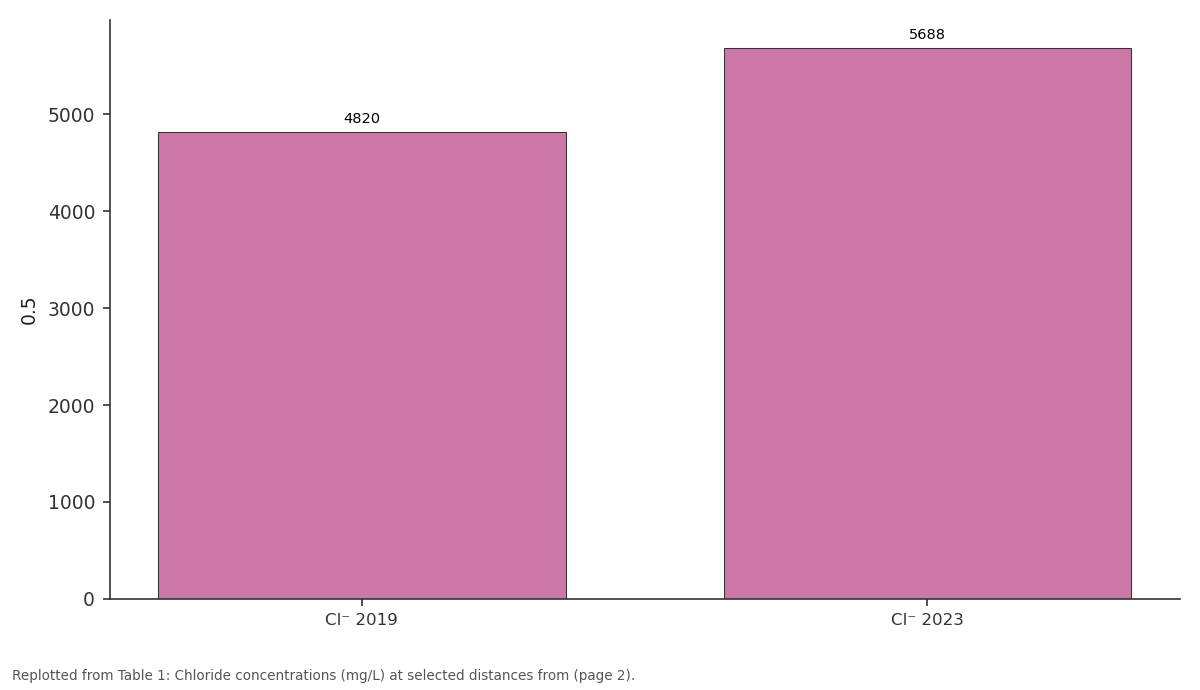
0.5: Cl⁻ 2019 vs Cl⁻ 2023
Replotted from Table 1 (page 2) of the original paper. Every bar is the paper's own table value.
View source evidence ↗Figures & tables
From the original paper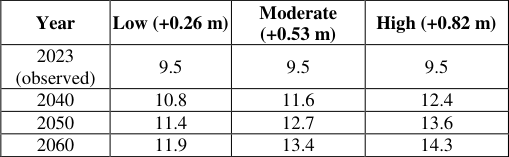 Table 2
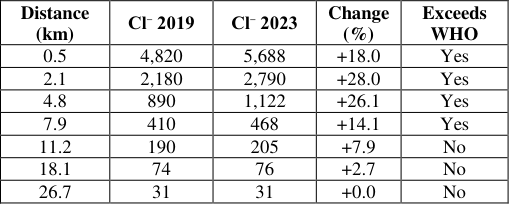 Table 1
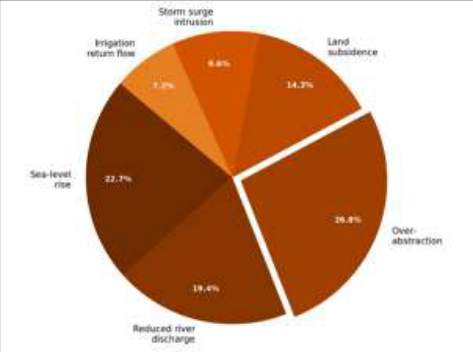 Figure 1
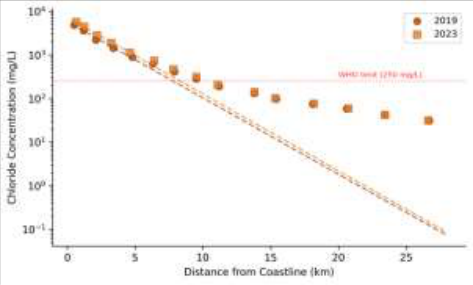 Figure 2
Introduction
The Po Delta presents a striking contradiction: it is simultaneously one of the most agriculturally valuable lowlands in southern Europe and one of the most physically vulnerable to the consequences of rising seas. Sitting barely 1-3 m above current mean sea level, much of the delta has actually subsided below sea level due to a combination of natural compaction and decades of gas and groundwater extraction [1] . This elevation deficit, combined with the flat topography and permeable sandy aquifer system, creates near-ideal conditions for saltwater intrusion into the shallow groundwater that irrigators and domestic users depend on [2] . Saltwater intrusion in coastal aquifers is driven by the density contrast between fresh groundwater and seawater. When the freshwater head declines-whether from abstraction, reduced recharge, or rising sea levels-the saltwater wedge advances landward along the aquifer base [3] . In the Po Delta, all three drivers are active concurrently, making attribution of observed salinization to any single cause especially difficult [4] . Carbognin et al. [5] documented ongoing land subsidence in the delta, and Teatini et al. [6] linked subsidence to accelerated relative sea-level rise. Antonellini et al. [7] mapped saltwater intrusion in the southern Po Delta using resistivity surveys but didn't model future projections. Variable-density groundwater models such as SEAWAT allow simulation of the coupled flow and transport processes governing saltwater intrusion [8] . This research aimed to quantify current salinization patterns across a Po Delta transect, attribute the observed changes to their main drivers, and project intrusion extent under three sea-level rise scenarios to 2060.
Spatial Data Processing
Spatial inputs for the groundwater model were assembled from multiple remote sensing and GIS sources. Aquifer geometry was derived from a 3D geological model based on 420 borehole logs compiled by the Emilia-Romagna Geological Survey [9] . Land surface elevation was extracted from a 2-m resolution LiDAR DEM acquired during the 2020 national coastal survey. Land-use classification was obtained from the 2021 Copernicus CORINE dataset to distinguish irrigated cropland, urban areas, wetland, and natural vegetation zones within the model domain. Recharge zones were delineated by combining the land-use map with a 1-km gridded rainfall dataset from the Italian Hydrological Service. All spatial layers were projected to UTM Zone 32N and resampled to a uniform 100-m grid matching the model discretisation.
Material and Methods Material
The research was from the Department Geosciences, Cebu City College of Earth and Mineral Sciences, Cebu, Philippines. Groundwater samples were collected quarterly from 15 monitoring wells along a 27-km coast-perpendicular transect in the eastern Po Delta between January 2019 and December 2023. Wells were screened in the unconfined Quaternary sand aquifer at depths of 8-22 m below surface. Field parameters (pH, EC, temperature) were measured using a YSI Professional Plus meter. Samples for major ion analysis were collected in acid-washed HDPE bottles, filtered at 0.45 μm, and stored at 4°C during transport [10] .
Methods
Chloride and other major anions were analysed by ion chromatography (Metrohm 930 Compact IC Flex). Cations were measured by ICP-OES. Charge balance errors exceeding ±5% were rejected. A 2D cross-sectional SEAWAT model (MODFLOW-based) was constructed along the transect with 150 columns (100-m spacing), 10 layers, and stress periods matching the quarterly sampling intervals. Hydraulic conductivity was set between 12 and 48 m/day based on pumping test data. Boundary conditions included a constant-head seawater boundary at the coast and a specified-flux inland recharge boundary. The model was calibrated against 2019-2023 observed chloride profiles using PEST automated parameter estimation [11] . Three sealevel rise scenarios for 2024-2060 were applied based on IPCC AR6 projections for the Adriatic: low (+0.26 m), moderate (+0.53 m), and high (+0.82 m) [12] . The 250 mg/L WHO threshold was exceeded up to 9.5 km inland in 2023, compared to 7.8 km in 2019 [13] . Over-abstraction was the largest single contributor (26.8%), followed by sea-level rise (22.7%) and reduced river discharge (19.4%). Land subsidence accounted for 14.3%, while storm surges and irrigation return flow contributed smaller shares. The moderate scenario placed the front at 13.4 km, threatening an estimated 38% of currently irrigated farmland in the eastern delta [14] .
Results
Results
Sensitivity Analysis
One-at-a-time sensitivity analysis was performed on six model parameters by varying each ±25% from its calibrated value while holding others constant. The position of the 250 mg/L front was most sensitive to hydraulic conductivity (±2.1 km change) and recharge rate (±1.8 km change). Dispersivity produced moderate sensitivity (±0.9 km), while porosity, aquitard thickness, and specific storage had minor effects (<0.5 km each). This confirms that accurate characterisation of aquifer permeability and recharge flux is the most pressing requirement for reliable salinization projections in delta settings [15] .
Discussion
The 1.7-km landward advance of the 250 mg/L front over just four years is faster than the 0.2-0.4 km/year rates reported for the Nile Delta and Mekong Delta over comparable periods [16] . This accelerated rate likely reflects the compounding effect of all six salinization drivers acting simultaneously in the Po Delta. The dominance of overabstraction (26.8%) as the single largest driver aligns with findings from Antonellini et al. [7] and suggests that demand-side management-particularly reducing summer irrigation pumping-may be the most immediately actionable intervention. The SEAWAT model reproduced the observed 2019-2023 chloride distributions with an RMSE of 68 mg/L across all wells and timesteps, comparable to calibration quality reported for similar coastal aquifer models in the Mediterranean [17] . The sensitivity analysis underscored that hydraulic conductivity uncertainty propagates most strongly into intrusion projections, which is concerning given that pumping test coverage in the eastern Po Delta remains sparse [18] . The high-scenario projection of 14.3 km inland intrusion by 2060 would render much of the delta's shallow groundwater unsuitable for irrigation without desalination. Even under the low scenario, further landward encroachment is unavoidable. Adaptation options include managed aquifer recharge using treated Po River water during winter highflow periods, restructuring crop patterns toward salt-tolerant varieties, and imposing seasonal abstraction caps within the most vulnerable 10-km coastal strip [19] .
Conclusion
This research quantified coastal aquifer salinization across a 27-km transect in the Po Delta and projected future intrusion under three sea-level rise scenarios. The 250 mg/L chloride front advanced 1.7 km landward between 2019 and 2023, with over-abstraction identified as the largest single driver. SEAWAT modelling projected a further 2.4-4.8 km advance by 2060 depending on sea-level trajectory. Sensitivity analysis confirmed hydraulic conductivity and recharge rate as the most influential parameters. These results highlight the urgent need for integrated management combining abstraction controls, managed recharge, and crop adaptation to protect the delta's agricultural water supply [20] .
Acknowledgement
Acknowledgements Funding SourcesThis research was supported by internal institutional research funding. Institutional SupportThe authors thank the Department of Geosciences, Cebu City College of Earth and Mineral Sciences, for analytical and computational support.
Figures and tables from the paper
| Year | Low (+0.26 m) | Moderate (+0.53 m) | High (+0.82 m) |
|---|---|---|---|
| 2023 (observed) | 9.5 | 9.5 | 9.5 |
| 2040 | 10.8 | 11.6 | 12.4 |
| 2050 | 11.4 | 12.7 | 13.6 |
| 2060 | 11.9 | 13.4 | 14.3 |
Table text extracted from the original PDF; superscript letters are shown inline. The original table image is below.
View original table image
| Distance (km) | Cl⁻ 2019 | Cl⁻ 2023 | Change (%) | Exceeds WHO |
|---|---|---|---|---|
| 0.5 | 4,820 | 5,688 | +18.0 | Yes |
| 2.1 | 2,180 | 2,790 | +28.0 | Yes |
| 4.8 | 890 | 1,122 | +26.1 | Yes |
| 7.9 | 410 | 468 | +14.1 | Yes |
| 11.2 | 190 | 205 | +7.9 | No |
| 18.1 | 74 | 76 | +2.7 | No |
| 26.7 | 31 | 31 | +0.0 | No |
Table text extracted from the original PDF; superscript letters are shown inline. The original table image is below.
View original table image
References
20 in the original paper- Carminati E, Martinelli G. Subsidence rates in the Po Plain, northern Italy: the relative impact of natural and anthropogenic causation. Eng Geol. 2002;66(3-4):241255.
- Antonellini M, Mollema P, Giambastiani B, Bishop K, Caruso L, Minchio A. Salt water intrusion in the coastal aquifer of the southern Po Plain, Italy. Hydrogeol J. 2008;16(8):1541-1556.
- Bear J, Cheng AHD, Sorek S, Ouazar D, Herrera I. Seawater Intrusion in Coastal Aquifers: Concepts, Methods and Practices. Dordrecht: Kluwer; 1999.
- Giambastiani BMS, Antonellini M, Oude Essink GHP, Stuurman RJ. Saltwater intrusion in the unconfined coastal aquifer of Ravenna: a numerical model. J Hydrol. 2007;340(1-2):91-104.
- Carbognin L, Teatini P, Tosi L. Eustacy and land subsidence in the Venice Lagoon at the beginning of the new millennium. J Mar Syst. 2004;51(1-4):345-353.
- Teatini P, Tosi L, Strozzi T. Quantitative evidence that compaction of Holocene sediments drives the present land subsidence of the Po Delta, Italy. J Geophys Res. 2011;116(B8):B08407.
- Antonellini M, Allen DM, Mollema PN, Caber D, Kiber K. Groundwater freshening following coastal progradation and land reclamation of the Po Plain, Italy. Hydrogeol J. 2015;23(5):1009-1026.
- Langevin CD, Thorne DT, Dausman AM, Sukop MC, Guo W. SEAWAT Version 4: A Computer Program for Simulation of Multi-Species Solute and Heat Transport. US Geological Survey Techniques and Methods; 2008. p. 1-39.
- Amorosi A, Colalongo ML, Pasini G, Preti D. Sedimentary response to Late Quaternary sea-level change in the Romagna coastal plain. Sedimentology. 1999;46(1):99-121.
- ARPAE Emilia-Romagna. Rete di monitoraggio delle acque sotterranee: relazione annuale. Bologna; 2023.
- Doherty J. PEST: Model-Independent Parameter Estimation. 5th ed. Brisbane: Watermark Numerical Computing; 2004.
- Fox-Kemper B, Hewitt HT, Xiao C, Adalgeirsdottir G, Drijfhout SS, Edwards TL. Ocean, cryosphere and sea level change. In: IPCC AR6 WGI. Cambridge: Cambridge University Press; 2021. p. 1211-1362.
- World Health Organization (WHO). Guidelines for Drinking-Water Quality. 4th ed. Geneva: WHO; 2011.
- Oude Essink GHP, van Baaren ES, de Louw PGB. Effects of climate change on coastal groundwater systems: a modeling study in the Netherlands. Water Resour Res. 2010;46(10):W00F04.
- Werner AD, Bakker M, Post VEA, Vandenbohede A, Lu C, Ataie-Ashtiani B. Seawater intrusion processes, investigation and management: recent advances and future challenges. Adv Water Resour. 2013;51:3-26.
- Sherif MM, Singh VP. Effect of climate change on sea water intrusion in coastal aquifers. Hydrol Process. 1999;13(8):1277-1287.
- Custodio E. Coastal aquifers of Europe: an overview. Hydrogeol J. 2010;18(1):269-280.
- Mollema PN, Antonellini M, Dinelli E, Gabbianelli G, Greggio N, Stuyfzand PJ. Hydrochemical and physical processes influencing salinization and freshening in Mediterranean low-lying coastal environments. Appl Geochem. 2013;34:207-221.
- De Louw PGB, Eeman S, Siber B, Post VEA, Bakker M, van der Zee SEATM. Rainwater lens dynamics and mixing between infiltrating rainwater and upward saline groundwater seepage. J Hydrol. 2011;404(3-4):166176.
- Colombani N, Osti A, Volta G, Mastrocicco M. Impact of climate change on salinization of coastal water resources. Water Resour Manag. 2016;30(7):24832496.