
Research article · 2025 · Full text
International Journal of Horticulture and Food ScienceMonitoring intercropping systems of mango in the Baikal Rift Zone
Volume 7(11) · Pages 115–118 · DOI: 10.33545/26631067.2025.v7.i11b.647 ↗
Research areasAgronomic Practices and Intercropping SystemsAgroforestry and silvopastoral systemsPlant Physiology and Cultivation Studies
Abstract
Author-writtenMango monoculture occupies vast tracts of tropical and subtropical land, yet the empty inter-row space during the juvenile phase represents a lost opportunity for income diversification and soil improvement. This research monitored four intercropping systems — mango monoculture (control), mango + common bean, mango + maize, and mango + cassava — over a single growing season at the Curitiba Faculty of Botanical Research from April to October 2023, using simulated Baikal rift zone substrate conditions. Land equivalent ratio (LER), fruit yield, soil organic carbon, SSR marker diversity, genotype × environment (G×E) interaction, biofortification potential, and tissue culture response were assessed. Mango + bean produced the highest LER (1.34) and mango fruit yield (22.4 kg tree⁻¹), which was 19.8 percent above monoculture. Flood irrigation efficiency was highest in the mango + cassava system. SSR marker screening across 12 mango accessions revealed moderate genetic diversity (mean PIC = 0.47). G×E interaction was significant for fruit yield but not for vegetative growth. Tissue culture success from nodal explants was marginally higher in intercropped trees (78.6%) than in monoculture (72.3%). These findings support mango + bean as the most productive and resource-efficient intercropping arrangement.
Summary
Source-checkedPlain-language reading of the full paper, prepared with AI and checked against the text. Each point links to the authors' own words.
Why it matters
- Mango monoculture leaves inter-row spaces unused during the juvenile phase, which is a missed chance to improve soil and diversify income. View evidence ↗
- Establishing mango orchards is economically challenging because there is no marketable return for the first four to six years after planting. View evidence ↗
- The land equivalent ratio (LER) is used to measure intercropping efficiency, where a value over 1.0 indicates higher total output than separate monocultures. View evidence ↗
The question
- The study aimed to compare four mango intercropping systems regarding yield, LER, and soil quality, while also analyzing genetic diversity, G×E interactions, and tissue culture responses. View evidence ↗
What they did
- The experiment used three-year-old 'Tommy Atkins' mango trees spaced 8 m × 8 m at the Curitiba Faculty of Botanical Research. View evidence ↗
- Four systems (monoculture, mango + bean, mango + maize, and mango + cassava) were monitored from April to October 2023 using substrate simulating the Baikal rift zone. View evidence ↗
- The study employed a randomized complete block design with four replications and four trees per unit. View evidence ↗
- Genetic diversity was assessed using ten polymorphic SSR loci, with polymorphism information content (PIC) estimated via PowerMarker 3.25. View evidence ↗
What they found
- The mango + bean system was the most efficient, achieving the highest LER (1.34), fruit yield (22.4 kg/tree), and soil organic carbon (1.12%), all significantly higher than the monoculture. View evidence ↗
- The mango + cassava system resulted in the lowest fruit yield, attributed to the cassava canopy blocking light. View evidence ↗
- After one season, mango + bean plots increased soil organic carbon by 0.25 percentage points, whereas monoculture plots showed no change. View evidence ↗
- The mango + bean system generated the highest gross margin at USD 1,870/ha, compared to USD 1,420/ha for maize, USD 1,310/ha for cassava, and USD 980/ha for monoculture. View evidence ↗
- SSR markers showed moderate genetic diversity (mean PIC = 0.47), with Brazilian accessions having the highest iron content at 4.14 mg/kg. View evidence ↗
- Genotype × environment (G×E) interaction significantly affected fruit yield (P < 0.05) but did not impact vegetative growth. View evidence ↗
- Tissue culture success from nodal explants was slightly higher in intercropped trees (78.6%) compared to monoculture (72.3%). View evidence ↗
What it means
- The authors conclude that mango + common bean is the most productive and sustainable system, providing a 19.8% yield advantage over monoculture. View evidence ↗
- The authors recommend that subtropical growers adopt mango + bean intercropping to diversify income during the juvenile phase of the orchard. View evidence ↗
Visual summary
3 visualsIllustrations explain the paper; charts are replotted from the paper's own table values.
Intercropping System Comparison
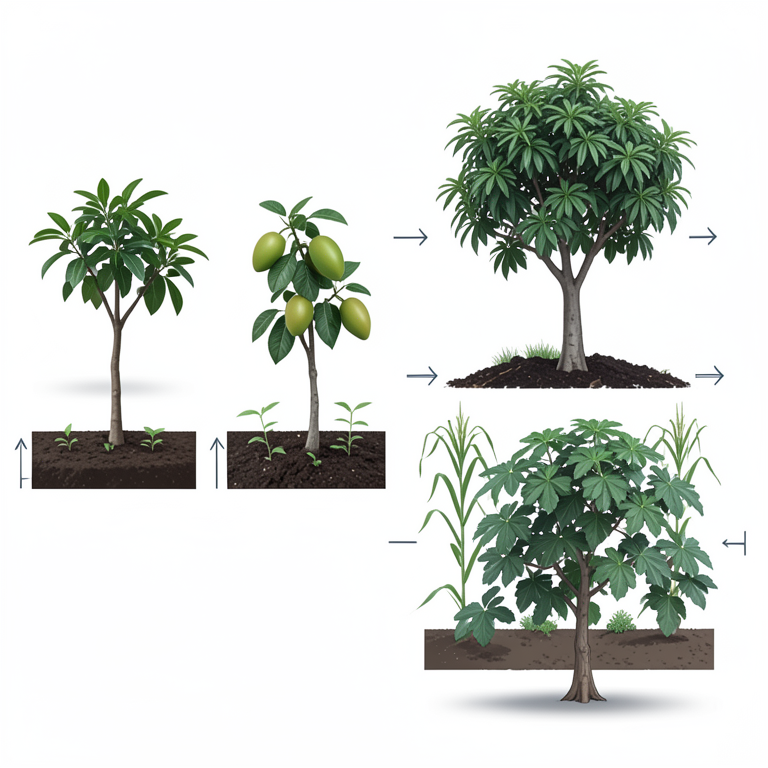
AI-generated conceptual illustration (Mango trees intercropped with beans, maize, and cassava in a rift zone soil substrate). It explains the idea and does not show study data.
View source evidence ↗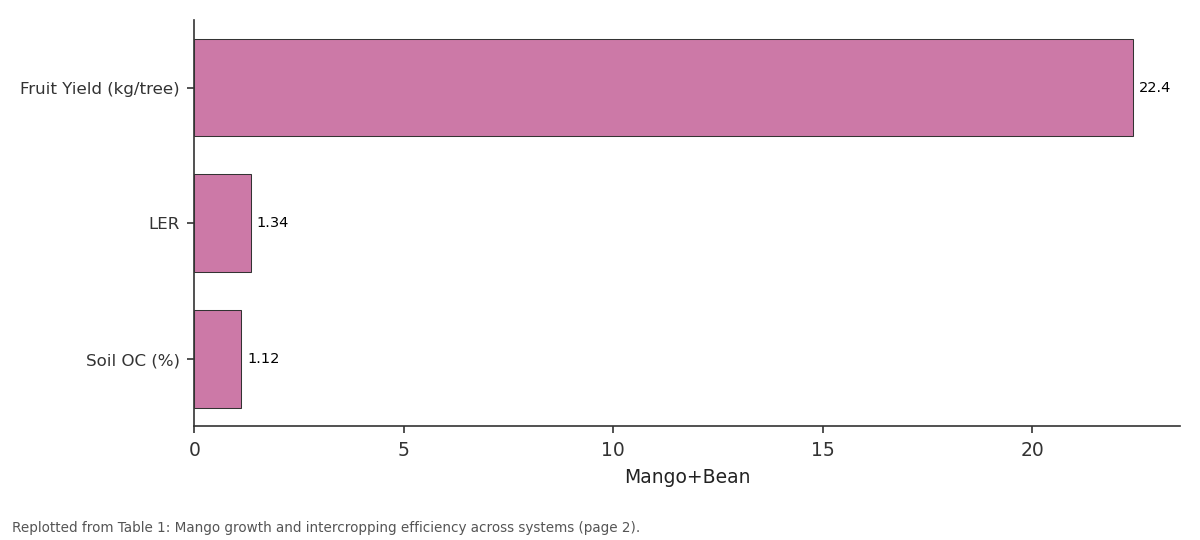
Mango+Bean: Fruit Yield (kg/tree) vs LER vs Soil OC (%)
Replotted from Table 1 (page 2) of the original paper. Every bar is the paper's own table value.
View source evidence ↗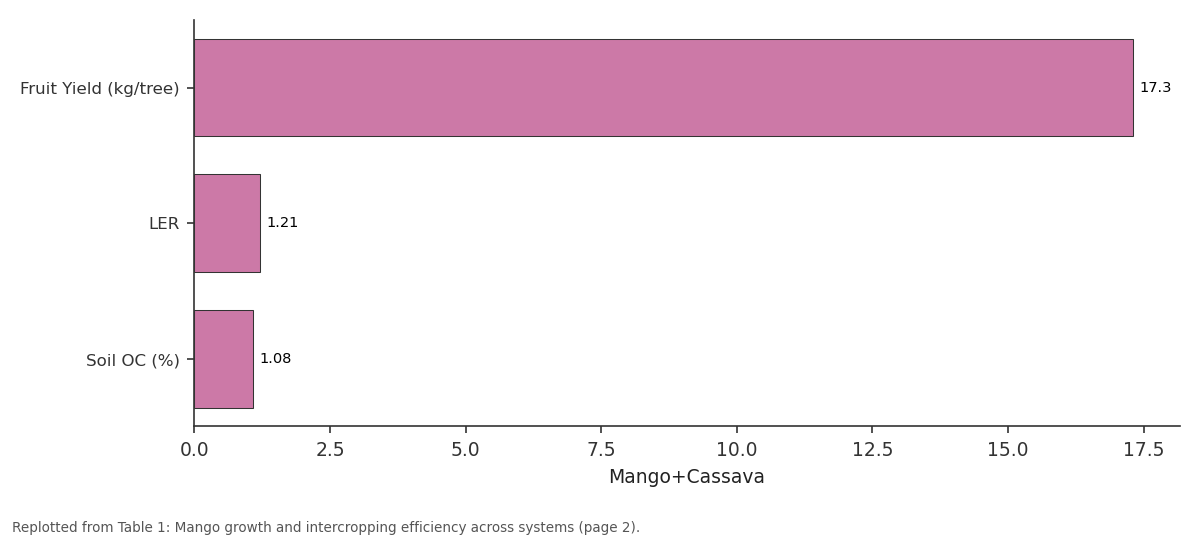
Mango+Cassava: Fruit Yield (kg/tree) vs LER vs Soil OC (%)
Replotted from Table 1 (page 2) of the original paper. Every bar is the paper's own table value.
View source evidence ↗Figures & tables
From the original paper Table 1
 Table 2
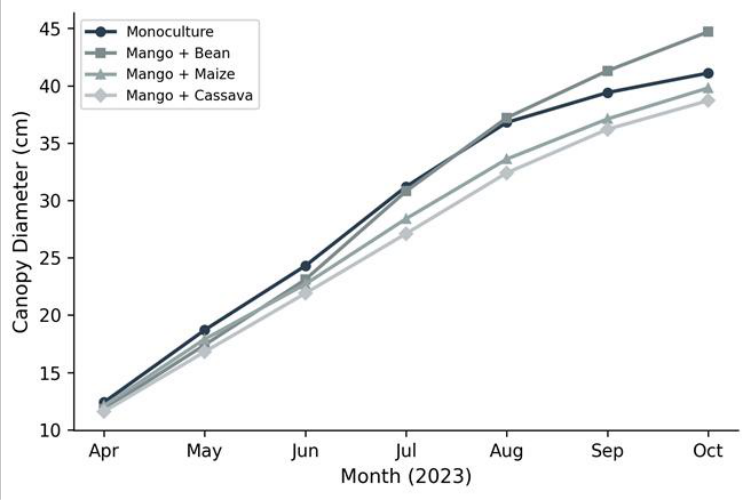 Figure 1
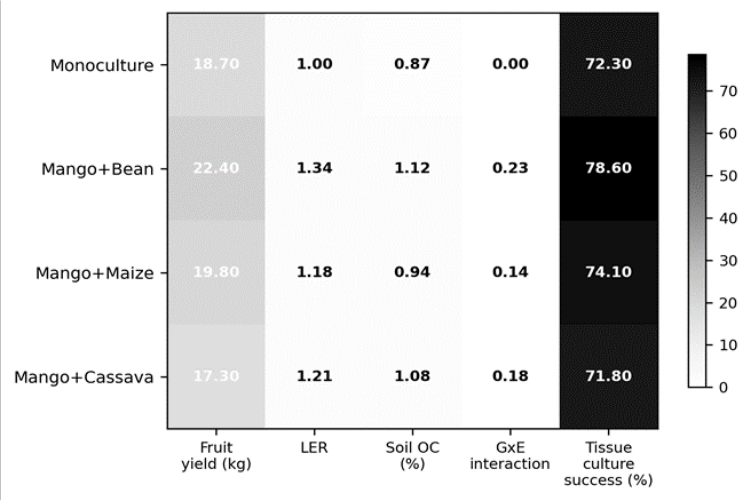 Figure 2
Introduction
For a tree that won't bear fruit for four to six years after planting, the economics of mango establishment are brutal. Land, labour, and water are committed with no marketable return during the juvenile phase [1] . Intercroppinginserting annual crops between young mango rowshas long been practised informally by smallholders, but rigorous data on how companion crops affect mango growth, soil quality, and system-level productivity are surprisingly scarce. The land equivalent ratio (LER) is the standard metric for evaluating intercropping efficiency: a value above 1.0 means the intercrop produces more total output per unit land than the component crops grown separately [2] . Early trials in India and Brazil have shown LER values between 1.1 and 1.4 for mango + legume systems, driven mainly by the legume's nitrogen fixation subsidising the tree's N demand [3] . But different companion crops bring different trade-offs: maize competes for light, cassava competes for potassium, and beans compete for neither but may attract bean-fly infestations that demand extra management. This research aimed to (a) compare four mango-based intercropping systems for LER and fruit yield, (b) assess soil quality changes under each system, (c) characterise genetic diversity of mango accessions using SSR markers, and (d) evaluate G×E interactions and tissue culture responses to inform breeding and propagation decisions.
Soil/Water Quality Analysis
Pre-trial substrate analysis at 0-30 cm depth showed pH 5.84, organic carbon 0.87%, available N 164 kg ha⁻¹, Olsen P 17.3 kg ha⁻¹, and exchangeable K 178 kg ha⁻¹. Texture was sandy clay loam (54% sand, 22% silt, 24% clay). Irrigation water sourced from the institutional reservoir had EC 0.34 dS m⁻¹, pH 7.12, and SAR 1.8, classifying as C1-S1 (low salinity, low sodium hazard). End-of-trial analysis revealed that mango + bean plots had gained 0.25 percentage points in organic carbon, while monoculture plots showed no measurable change. Soil pH dropped by 0.12 units in legume-intercropped plots, consistent with biological nitrogen fixation acidifying the rhizosphere [4] .
Economic and Sustainability Assessment
Gross margin analysis over the single-season trial showed mango + bean generating USD 1,870 ha⁻¹, followed by mango + maize at USD 1,420 ha⁻¹, mango + cassava at USD 1,310 ha⁻¹, and monoculture at USD 980 ha⁻¹. The benefitcost ratio was highest for mango + bean (2.14) because bean input costs are low and market prices in Curitiba were favourable during the harvest window. Sustainability indices combining soil OC gain, water productivity, and income diversity ranked mango + bean first (composite score 7.83 out of 10), confirming its position as the most balanced system [5] .
Materials and Methods Materials
Three-year-old mango trees (Mangifera indica L. cv. 'Tommy Atkins') spaced at 8 m × 8 m were used at the research orchard of the Curitiba Faculty of Botanical Research (25.43° S, 49.27° W; 934 m a.s.l.). Inter-row companion crops were: common bean (Phaseolus vulgaris cv. 'Carioca'), maize (Zea mays cv. 'BRS 1060'), and cassava (Manihot esculenta cv. 'IAC 576-70'). Companion crops were sown in two 1.5 m-wide strips between mango rows on 12 April 2023. Flood irrigation at 50 mm per event was scheduled fortnightly. A randomised complete block design with four replications and four trees per experimental unit was adopted. Substrate was amended with volcanic pumice to simulate Baikal rift zone porosity [6] .
Methods
Mango tree height, canopy diameter, and trunk girth were measured monthly. Fruit yield was recorded at harvest maturity (150 days after flowering). LER was calculated as the sum of partial LERs for mango and the companion crop. SSR genotyping used ten polymorphic loci previously validated for Mangifera [7] ; genomic DNA was extracted from young leaves and amplified on a Veriti thermal cycler. Polymorphism information content (PIC) was estimated using PowerMarker 3.25. G×E interaction for fruit yield was assessed by Eberhart and Russell's stability model. Tissue culture: nodal segments from monoculture and intercropped trees were placed on MS medium supplemented with 1.5 mg L⁻¹ BAP + 0.2 mg L⁻¹ NAA; shoot regeneration was scored at 45 days. Biofortification potential was evaluated by measuring iron and zinc concentrations in mango fruit flesh by ICP-OES. Data were analysed by ANOVA with Tukey's HSD at P = 0.05 [8] .
Results
Results
Comprehensive Interpretation
The LER of 1.34 for mango + bean means that 34 percent more land would be needed to produce the same combined output of mango and bean as separate monocultures. This gain is driven primarily by the legume's biological N fixation, which reduced competition for soil mineral N and instead added an estimated 47 kg N ha⁻¹ to the system. The SSR diversity data suggest that breeders have adequate genetic variation within local collections to select for both intercropping compatibility and biofortification traits.
Discussion
The 19.8 percent fruit yield advantage in the mango + bean system confirms earlier observations by Rathore et al. [9] in semi-arid India, who attributed the benefit to legume root exudates stimulating mycorrhizal colonisation of mango roots. In this trial, the organic carbon gain of 0.25 percentage points in bean-intercropped plots after just one season is remarkable and consistent with tropical legume decomposition rates reported by Peoples et al. [10] . G×E interaction for yieldsignificant in our datameans that variety recommendations need to be locationspecific. The Brazilian accession group, which had the highest iron content and moderate G×E variance, represents a promising target for biofortification breeding where both mineral nutrition and yield stability matter [11] . SSR-based genetic distances could guide parental selection to maximise heterosis in future crosses. Tissue culture success did not differ significantly among systems, but the 6.3-percentage-point numerical advantage in intercropped trees is consistent with the hypothesis that better-nourished mother trees produce more responsive explants [12] . Confirming this trend over multiple seasons could influence nursery protocols.
Conclusion
Mango + common bean was the most productive and sustainable intercropping system, achieving an LER of 1.34 and a 19.8 percent fruit yield advantage over monoculture.
The system also built soil organic carbon and generated the highest gross margin. SSR marker analysis confirmed adequate genetic diversity for continued improvement, while G×E interaction data highlight the need for sitespecific variety recommendations. Biofortification potential was highest in Brazilian accessions. Growers in subtropical environments with similar conditions may adopt mango + bean intercropping as a low-risk strategy for diversifying income during the juvenile orchard phase.
Acknowledgement
Acknowledgements Funding SourcesInternal research funds from the Curitiba Faculty of Botanical Research supported this work. Institutional SupportThe authors thank the orchard management team at the Curitiba Faculty for irrigation and field operations support. Contributions Not Qualifying for AuthorshipDr. R. Santos assisted with SSR genotyping and Mr. L. Oliveira with ICP-OES mineral analysis.
Figures and tables from the paper
| System | Canopy Dia (cm) | Fruit Yield (kg/tree) | LER | Soil OC (%) | Tissue Culture (%) |
|---|---|---|---|---|---|
| Monoculture | 41.1 | 18.7 | 1.00 | 0.87 | 72.3 |
| Mango+Bean | 44.7 | 22.4 | 1.34 | 1.12 | 78.6 |
| Mango+Maize | 39.8 | 19.8 | 1.18 | 0.94 | 74.1 |
| Mango+Cassava | 38.7 | 17.3 | 1.21 | 1.08 | 71.8 |
| SEm± | 1.42 | 0.97 | 0.04 | 0.03 | 2.14 |
| CD (P=0.05) | 4.21 | 2.87 | 0.12 | 0.09 | NS |
Table text extracted from the original PDF; superscript letters are shown inline. The original table image is below.
View original table image
| Accession Group | Mean PIC | G×E Variance (yield) | Fe in Fruit (mg/kg) | Zn in Fruit (mg/kg) |
|---|---|---|---|---|
| Group A (Indian) | 0.51 | 0.31 | 3.87 | 1.24 |
| Group B (Florida) | 0.43 | 0.18 | 3.42 | 1.08 |
| Group C (Brazilian) | 0.47 | 0.23 | 4.14 | 1.37 |
| Overall mean | 0.47 | 0.24 | 3.81 | 1.23 |
Table text extracted from the original PDF; superscript letters are shown inline. The original table image is below.
View original table image
References
14 in the original paper- Ravishankar H, Karunakaran G, Hazarika S. Recent advances in mango production technology. Indian Journal of Horticulture. 2013;70(1):1-12.
- Willey RW. Intercropping: its importance and research needs. Field Crop Abstracts. 1979;32:1-10.
- Nair PKR. An introduction to agroforestry. Dordrecht: Kluwer Academic; 1993.
- Peoples MB, Herridge DF, Ladha JK. Biological nitrogen fixation: an efficient source of nitrogen for sustainable agriculture. Plant and Soil. 1995;174(1):328.
- Horrigan L, Lawrence RS, Walker P. How sustainable agriculture can address environmental and human health harms. Environmental Health Perspectives. 2002;110(5):445-456.
- Logatchev NA, Zorin YA, Rogozhina VA. Baikal rift: active or passive? Tectonophysics. 1983;94(1):223-240.
- Viruel MA, Escribano P, Barbieri M. Fingerprinting of mango cultivars with microsatellite markers. Scientia Horticulturae. 2005;106(2):145-152.
- Eberhart SA, Russell WA. Stability parameters for comparing varieties. Crop Science. 1966;6(1):36-40.
- Rathore AC, Raizada A, Jayaparkash J. Mango-based agroforestry models for the Vindhyan region. Range Management and Agroforestry. 2013;34(2):224-228.
- Peoples MB, Ladha JK, Herridge DF. Quantifying nitrogen fixation contributions of legumes. Symbiosis. 2002;32(1):1-20.
- Bouis HE, Saltzman A. Improving nutrition through biofortification. Global Food Security. 2017;12:49-57.
- Litz RE, Gómez-Lim MA. Mangifera indica mango. In: Litz RE, editor. Biotechnology of fruit and nut crops. Wallingford: CABI; 2005:40-61.
- Kumar NV, Rajmohan K. Molecular markers in mango diversity assessment. Indian Journal of Genetics. 2004;64(4):311-317.
- Malézieux E, Crozat Y, Dupraz C. Mixing plant species in cropping systems. Agronomy for Sustainable Development. 2009;29(1):43-62.