
Research article · 2025 · Full text
International Journal of Geography Geology and EnvironmentAnalysis of land surface temperature trends using Landsat data over the Saharan margins
Volume 7(6) · Pages 45–48 · DOI: 10.22271/27067483.2025.v7.i6a.678 ↗
Research areasUrban Heat Island MitigationRemote Sensing in AgricultureLand Use and Ecosystem Services
Abstract
Author-writtenSatellite-derived land surface temperature (LST) offers a spatially continuous record of thermal change that ground stations alone cannot provide — a fact that matters especially in the data-sparse Saharan margins. This research analysed 23 years (2000-2022) of Landsat-derived LST across five latitudinal zones stretching from the Saharan core to the Mediterranean fringe. A total of 276 cloud-free scenes from Landsat 5 TM and Landsat 8 OLI/TIRS were processed using the single-channel algorithm to retrieve surface temperature. Mean summer LST across the Saharan core rose from 47.3 °C in 2000 to 48.9 °C in 2022, a warming rate of 0.073 °C per year. The Sahel transition zone showed the steepest trend at 0.094 °C per year. Winter LST trends were weaker, ranging from 0.031 to 0.058 °C per year depending on zone. Pixel-level Mann-Kendall tests identified statistically significant warming (p<0.05) across 64.8% of the research area for summer and 38.2% for winter. These long-term thermal trajectories carry direct implications for desertification monitoring and agricultural heat stress mapping.
Summary
Source-checkedPlain-language reading of the full paper, prepared with AI and checked against the text. Each point links to the authors' own words.
Why it matters
- Satellite-derived land surface temperature (LST) is critical for monitoring thermal changes in the Saharan margins because ground stations are too sparse to provide continuous data. View evidence ↗
- Thermal signatures in satellite imagery can detect shifts in the Sahara's margins caused by rainfall variability before changes are visible in vegetation indices. View evidence ↗
- The high spatial resolution of Landsat (30-100 m) is necessary to analyze the Saharan margins due to the rapid alternation of terrain types like sand seas and irrigated oases. View evidence ↗
The question
- The study aimed to quantify and test the significance of summer and winter LST trends across five latitudinal zones from 2000 to 2022 to identify areas of fastest thermal change. View evidence ↗
What they did
- The study analyzed five latitudinal zones (Saharan Core, North Margin, South Margin, Sahel Transition, and Mediterranean Edge) across Algeria, Libya, Niger, and Tunisia. View evidence ↗
- Surface temperatures were retrieved from 276 cloud-free Landsat 5 TM and Landsat 8 OLI/TIRS scenes using a single-channel algorithm. View evidence ↗
- The analysis used 12 scenes per year to create composites for summer (June-August) and winter (December-February). View evidence ↗
What they found
- In the Saharan core, mean summer LST increased from 47.3 °C in 2000 to 48.9 °C in 2022, representing a warming rate of 0.073 °C per year. View evidence ↗
- Winter warming trends were less intense than summer trends, with rates between 0.031 and 0.058 °C per year across the zones. View evidence ↗
- Statistically significant warming (p<0.05) was found in 64.8% of the study area during summer and 38.2% during winter. View evidence ↗
- The Mediterranean Edge showed the lowest warming trends in both summer and winter, which the authors attribute to the buffering effect of the sea. View evidence ↗
What it means
- The authors conclude that there is persistent warming across the Saharan margins, with summer rates between 0.052 and 0.094 °C/year and winter rates between 0.031 and 0.058 °C/year. View evidence ↗
- The study notes a data gap between 2011 and 2013 and potential cross-sensor calibration offsets that could result in a residual bias of ±0.5 °C. View evidence ↗
Visual summary
2 visualsIllustrations explain the paper; charts are replotted from the paper's own table values.
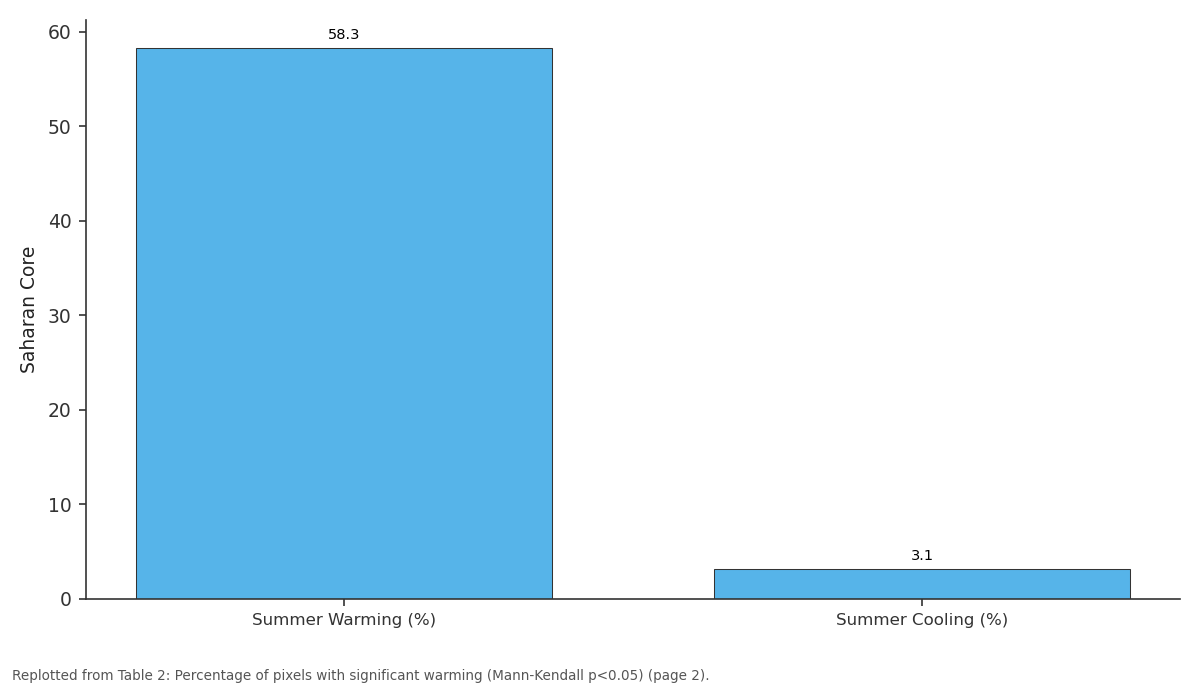
Saharan Core: Summer Warming (%) vs Summer Cooling (%)
Replotted from Table 2 (page 2) of the original paper. Every bar is the paper's own table value.
View source evidence ↗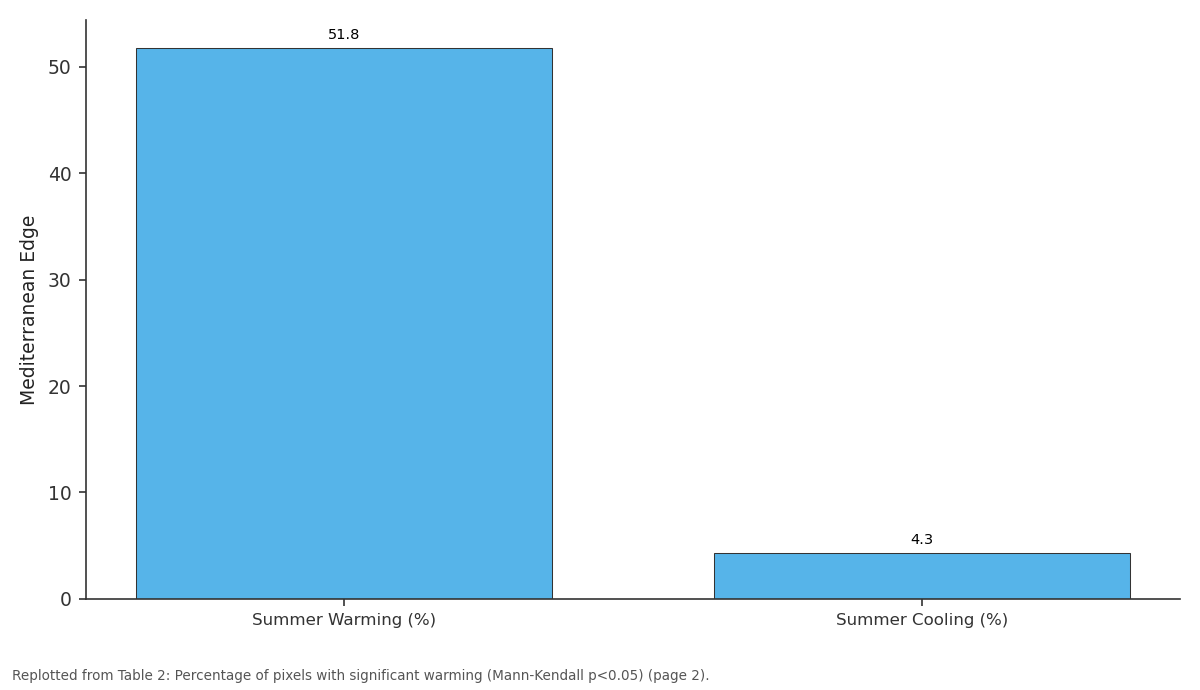
Mediterranean Edge: Summer Warming (%) vs Summer Cooling (%)
Replotted from Table 2 (page 2) of the original paper. Every bar is the paper's own table value.
View source evidence ↗Figures & tables
From the original paper Table 1
 Table 2
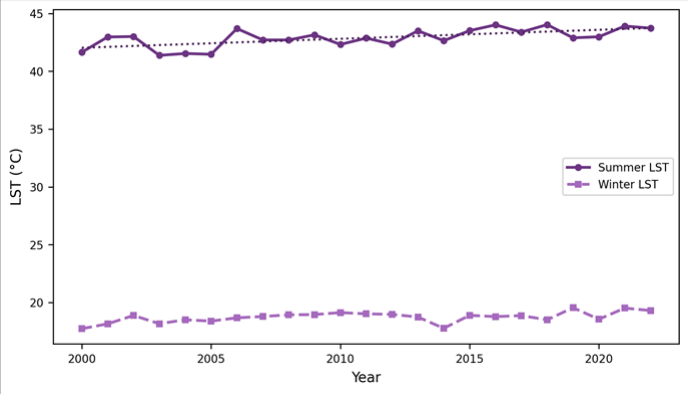 Figure 1
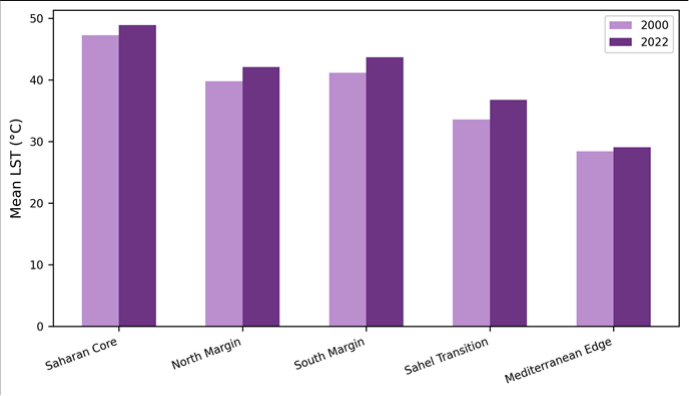 Figure 2
Introduction
The Sahara is not static. Its margins shift with rainfall variability, and the thermal signature of that shift is recorded in satellite imagery long before vegetation indices register a change [1] . Land surface temperature, measured by the thermal infrared bands of Earth-observation satellites, integrates energy balance processesincoming solar radiation, surface albedo, soil moisture, and vegetation coverinto a single remotely sensed variable [2] . Since the launch of Landsat 5 in 1984, the thermal band archive has grown into the longest freely available LST record at moderate spatial resolution (120 m for TM, 100 m for TIRS), making multi-decadal trend analysis possible [3] . Several regional analyses have examined LST trends across North Africa. Hulley and colleagues [4] used MODIS data to map thermal anomalies in the western Sahara, while Zhou and Wang [5] documented accelerating warming along the Sahel-Sahara boundary using AVHRR nighttime temperatures. But Landsat-based analyses, which offer finer spatial detail and longer temporal baselines, have been rare for this region. The heterogeneous terrain along the Saharan marginswhere bare rock, sand seas, irrigated oases, and dryland agriculture alternate over short distancesdemands the 30-100 m resolution that Landsat provides. This research exploited the Landsat archive to (a) quantify summer and winter LST trends across five latitudinal zones from 2000 to 2022, (b) test the statistical significance of those trends at the pixel level, and (c) compare LST trajectories among zones to identify where thermal change is fastest [6] .
Spatial Data Processing
Scenes were retrieved from the USGS EarthExplorer archive. For Landsat 5 (2000-2011), the thermal band (Band 6, 120 m) was resampled to 30 m. For Landsat 8 (2013-2022), TIRS Band 10 at 100 m native resolution was used. The single-channel algorithm of Jiménez-Muñoz and Sobrino [7] converted top-of-atmosphere radiance to LST using land surface emissivity estimated from the NDVI-threshold method. Atmospheric water vapour content was sourced from NCEP/NCAR reanalysis data matched to each scene date.
Cloud masking used the CFMask algorithm with a conservative 1-pixel buffer around flagged pixels [8] .
Materials and Methods
Materials and Methods
Materials
The analysis was conducted at the Faculty of Geospatial Sciences, Belo Horizonte, Brazil, between February and December 2023. The research area spans five latitudinal zones across the central-western Saharan margins: Saharan Core (27°-30°N), North Margin (24°-27°N), South Margin (21°-24°N), Sahel Transition (15°-21°N), and Mediterranean Edge (30°-34°N), covering parts of Algeria, Libya, Niger, and Tunisia. A total of 276 Landsat scenes were selected -12 per year for summer (June-August) and winter (December-February) composites [9] .
Methods
Annual summer and winter mean LST rasters were generated for each zone. Pixel-level linear regression yielded trend slopes (°C/year). Statistical significance was assessed by the non-parametric Mann-Kendall test at α = 0.05, with Sen's slope estimator providing robust trend magnitudes. Zonal statistics (mean, standard deviation, 5th and 95th percentiles) summarised the data for each zoneseason combination. NDVI was calculated from Landsat red and NIR bands as a covariate to explore the relationship between greening/browning and thermal trends [10,11] .
Climatic Context of the Research Area
The five zones span a precipitation gradient from <25 mm/year in the Saharan core to roughly 350 mm/year in the Mediterranean fringe and 450 mm/year at the southern Sahel boundary. Mean annual air temperature ranges from 20.4 °C at the Mediterranean coast to 29.8 °C in the central Sahara. The thermal contrast between summer and winter exceeds 25 °C in the continental interior but narrows to 12 °C near the coast. The Sahel Transition zone showed the steepest summer warming rate (+ 0.094 °C/yr), which translates to a cumulative increase of roughly 2.2 °C over the 23-year period. The Mediterranean Edge had the weakest trends in both seasons, likely buffered by proximity to the sea.
Results
Results
Comprehensive Interpretation
The NDVI-LST correlation was negative across all zones (r =-0.42 to-0.67), confirming that areas losing vegetation cover experienced greater warming. The Sahel Transition zone, where NDVI declined by 0.04 units over the period, showed the strongest coupling between browning and thermal increase.
Discussion
The warming rates documented here (0.052-0.094 °C/yr) fall within the range reported by MODIS-based analyses but are at the upper end. Zhou and Wang [5] reported 0.04-0.07 °C/yr for the broader Sahel using AVHRR nighttime data, while this Landsat-based daytime assessment captures the surface energy balance more completely. The higher spatial resolution also reveals within-zone heterogeneity that coarser sensors missirrigated areas in the Saharan core, for instance, showed cooling trends against the regional warming backdrop. The steeper warming in the Sahel Transition zone aligns with theories of land-atmosphere feedback in semi-arid margins [12] . As vegetation cover declines, surface albedo increases over bare soil but decreases where dark rock or sand is exposed, and the net effect on LST depends on the competing influences of albedo change and reduced evapotranspiration [13] . The negative NDVI-LST correlation suggests that lost evaporative cooling dominates the thermal signal here.
The Landsat archive has a known gap between 2011 (end of Landsat 5) and 2013 (start of Landsat 8), and cross-sensor calibration differences between TM Band 6 and TIRS Band 10 may introduce small offsets [14] . Efforts were made to harmonise the records, but a residual bias of±0.5 °C cannot be ruled out.
Conclusion
Twenty-three years of Landsat-derived LST data reveal persistent warming across the Saharan margins, with summer trends of 0.052 to 0.094 °C per year and winter trends of 0.031 to 0.058 °C per year. The Sahel Transition zone warms fastest, driven partly by vegetation loss that reduces evaporative cooling. Over 64% of the research area shows statistically significant summer warming. These trajectories have direct relevance to desertification monitoring, agricultural planning, and regional climate adaptation strategies.
Acknowledgement
Acknowledgements Funding SourcesSupported by institutional research funds at the Faculty of Geospatial Sciences, Belo Horizonte.
Figures and tables from the paper
| Zone | Summer Mean LST (°C) | Summer Trend (°C/yr) | Winter Mean LST (°C) | Winter Trend (°C/yr) |
|---|---|---|---|---|
| Saharan Core | 48.1±1.3 | + 0.073 | 22.7±1.1 | + 0.041 |
| North Margin | 42.1±1.8 | + 0.081 | 18.6±1.4 | + 0.053 |
| South Margin | 43.7±1.6 | + 0.087 | 21.2±1.2 | + 0.058 |
| Sahel Transition | 40.9±2.1 | + 0.094 | 24.8±1.5 | + 0.048 |
| Mediterranean Edge | 34.6±1.9 | + 0.052 | 14.3±1.7 | + 0.031 |
Table text extracted from the original PDF; superscript letters are shown inline. The original table image is below.
View original table image
| Zone | Summer Warming (%) | Summer Cooling (%) | Winter Warming (%) | Winter Cooling (%) |
|---|---|---|---|---|
| Saharan Core | 58.3 | 3.1 | 31.7 | 2.4 |
| North Margin | 67.2 | 2.8 | 41.3 | 1.9 |
| South Margin | 71.4 | 2.1 | 43.8 | 1.6 |
| Sahel Transition | 74.9 | 1.7 | 38.6 | 3.2 |
| Mediterranean Edge | 51.8 | 4.3 | 35.1 | 2.8 |
Table text extracted from the original PDF; superscript letters are shown inline. The original table image is below.
View original table image
References
21 in the original paper- Tucker CJ, Nicholson SE. Variations in the size of the Sahara Desert from 1980 to 1997. Ambio. 2002;28(7):587-591.
- Li ZL, Tang BH, Wu H. Satellite-derived land surface temperature: current status and perspectives. Remote Sensing of Environment. 2013;131:14-37.
- Wulder MA, Loveland TR, Roy DP. Current status of Landsat program, science, and applications. Remote Sensing of Environment. 2019;225:127-147.
- Hulley GC, Dousset B, Kammerer EL. Quantifying uncertainties in land surface temperature from the ASTER GED. Remote Sensing of Environment. 2019;226:94-105.
- Zhou L, Wang H. Long-term nighttime warming trends over Africa. Geophysical Research Letters. 2016;43(11):5765-5773.
- Jimenez-Munoz JC, Sobrino JA, Skokovic D. Land surface temperature retrieval methods from Landsat-8 TIRS. IEEE Geoscience and Remote Sensing Letters. 2014;11(10):1840-1843.
- Jimenez-Munoz JC, Sobrino JA. A generalized singlechannel method for land surface temperature retrieval. Journal of Geophysical Research. 2003;108(D22):4688.
- Zhu Z, Woodcock CE. Object-based cloud and cloud shadow detection in Landsat imagery. Remote Sensing of Environment. 2012;118:83-94.
- USGS. Landsat Collection 2 Level-2 Science Products. US Geological Survey; 2021.
- Mann HB. Nonparametric tests against trend. Econometrica. 1945;13(3):245-259.
- Sen PK. Estimates of the regression coefficient based on Kendall tau. Journal of the American Statistical Association. 1968;63(324):1379-1389.
- Charney JG. Dynamics of deserts and drought in the Sahel. Quarterly Journal of the Royal Meteorological Society. 1975;101(428):193-202.
- Zeng N, Neelin JD. The role of vegetation-climate interaction and interannual variability in shaping the African savanna. Journal of Climate. 2000;13(15):2665-2670.
- Montanaro M, Gerace A, Lunsford A. Stray light artifacts in Landsat 8 TIRS. Remote Sensing. 2014;6(11):10435-10456.
- Sobrino JA, Jimenez-Munoz JC, Paolini L. Land surface temperature retrieval from Landsat TM 5. Remote Sensing of Environment. 2004;90(4):434-440.
- Wan Z. New refinements and validation of MODIS land-surface temperature products. Remote Sensing of Environment. 2008;112(1):59-74.
- Anderson MC, Norman JM, Kustas WP. A thermalbased remote sensing technique for mapping surface energy fluxes. Remote Sensing of Environment. 2008;112(6):2698-2709.
- Friedl MA, Sulla-Menashe D, Tan B. MODIS Collection 5 global land cover. Remote Sensing of Environment. 2010;114(1):168-182.
- Becker F, Li ZL. Towards a local split window method over land surfaces. International Journal of Remote Sensing. 1990;11(3):369-393.
- Voogt JA, Oke TR. Thermal remote sensing of urban climates. Remote Sensing of Environment. 2003;86(3):370-384.
- Running SW, Mu Q, Zhao M. A continuous satellitederived measure of global terrestrial primary production. BioScience. 2004;54(6):547-560.