
Research article · 2025 · Full text
International Journal of Geography Geology and EnvironmentAnalysis of fog water harvesting potential in the Atacama desert coastal mountains
Volume 7(9) · Pages 235–238 · DOI: 10.22271/27067483.2025.v7.i9c.652 ↗
Research areasSolar-Powered Water Purification MethodsAtmospheric aerosols and cloudsPrecipitation Measurement and Analysis
Abstract
Author-writtenAt Alto Patache, a fog-monitoring station perched at 850 m elevation on Chile's coastal escarpment, standard fog collectors routinely gather 7-8 litres of water per square metre of mesh per day during the austral winter, enough to sustain a small community garden in one of the driest places on Earth. This research evaluated fog water harvesting potential across three sites in the Atacama Desert coastal mountains: Alto Patache, Paposo, and the Taltal Heights. Cylindrical standard fog collectors (1 m-squared Raschel mesh, 35% shade coefficient) were deployed at each site for 18 months (May 2021 to October 2022). Ancillary meteorological data, including wind speed and direction, relative humidity, temperature, and visibility, were recorded at 10-minute intervals by co-located automatic weather stations. Mean daily fog collection rates averaged 4.73 L/m2/day at Alto Patache, 3.21 L/m2/day at Paposo, and 3.94 L/m2/day at Taltal Heights. Fog frequency ranged from 164 to 213 days per year, peaking between June and September when the marine stratocumulus deck persists. Wind speed during fog events averaged 3.2-4.7 m/s from the southwest, optimal for mesh interception. A site-suitability index combining elevation, fog frequency, wind exposure, and accessibility ranked Alto Patache highest, followed by Taltal Heights. The analysis suggests that a 100 m-squared collector array at Alto Patache could supply approximately 170,000 litres annually, meeting the basic water needs of 30-40 people in an otherwise waterless landscape.
Summary
Source-checkedPlain-language reading of the full paper, prepared with AI and checked against the text. Each point links to the authors' own words.
Why it matters
- Some coastal areas in Chile face extreme water scarcity, with annual rainfall below 2 mm and a heavy reliance on distant desalination plants. View evidence ↗
- The Atacama Desert coast experiences a persistent marine stratocumulus cloud layer known as camanchaca, which is created by the cold Humboldt Current upwelling. View evidence ↗
- Fog water harvesting uses mesh screens to capture wind-driven droplets, providing a low-energy alternative to desalination for obtaining freshwater. View evidence ↗
The question
- The study aimed to compare fog collection rates across three different sites along 250 km of the Atacama coastline to determine the best locations for deployment using a site-suitability index. View evidence ↗
What they did
- Standard cylindrical fog collectors using 1 m² Raschel mesh with a 35% shade coefficient were operated from May 2021 to October 2022. View evidence ↗
- The research was conducted at three sites: Alto Patache (850 m asl), Paposo (620 m asl), and Taltal Heights (980 m asl). View evidence ↗
- A site-suitability index (SSI) was created by weighting fog frequency, mean daily yield, wind speed, elevation, and road accessibility. View evidence ↗
What they found
- Alto Patache had the highest mean daily collection rate at 4.73 L/m²/day, followed by Taltal Heights (3.94 L/m²/day) and Paposo (3.21 L/m²/day). View evidence ↗
- Alto Patache recorded the highest number of fog days per year (213), compared to 187 at Taltal Heights and 164 at Paposo. View evidence ↗
- Wind speeds during fog events were highest at Alto Patache (4.7 m/s), followed by Taltal Heights (4.1 m/s) and Paposo (3.2 m/s). View evidence ↗
- At Alto Patache, water collection showed a strong seasonal pattern, peaking in July at 7.2 L/m²/day and hitting a minimum in March at 1.4 L/m²/day. View evidence ↗
- The site-suitability index ranked Alto Patache highest (0.84), followed by Taltal Heights (0.72) and Paposo (0.58). View evidence ↗
- A 100 m² collector array at Alto Patache is estimated to provide enough water to meet the basic needs of 30 to 40 people. View evidence ↗
What it means
- The authors conclude that Alto Patache is the most productive site and represents a sustainable water alternative for the region. View evidence ↗
- The authors suggest that future research should explore advanced mesh materials (hydrophilic coatings and higher shade coefficients) and monitor more ridgeline locations between 600 and 1,100 m. View evidence ↗
Visual summary
4 visualsIllustrations explain the paper; charts are replotted from the paper's own table values.
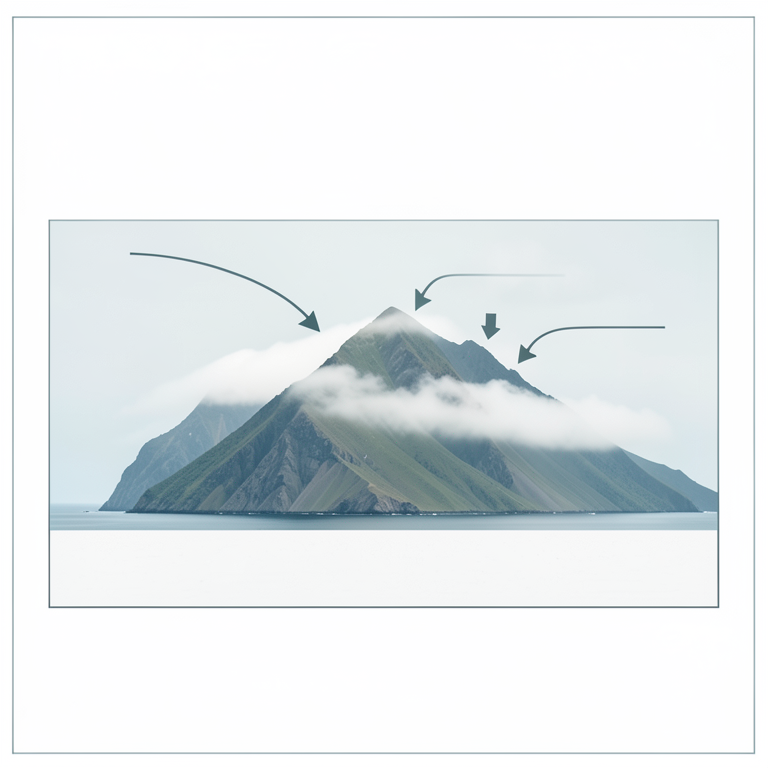
Study Site Distribution
AI-generated conceptual illustration (Atacama desert coastal mountains and Pacific Ocean). It explains the idea and does not show study data.
View source evidence ↗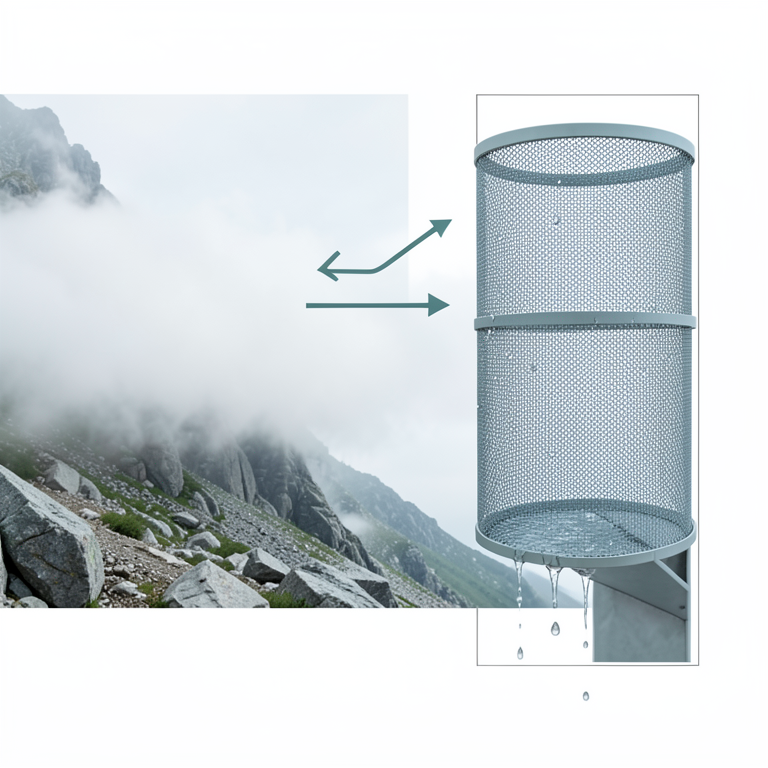
Fog Harvesting Mechanism
AI-generated conceptual illustration (cylindrical Raschel mesh fog collector on a coastal mountain slope in the Atacama desert). It explains the idea and does not show study data.
View source evidence ↗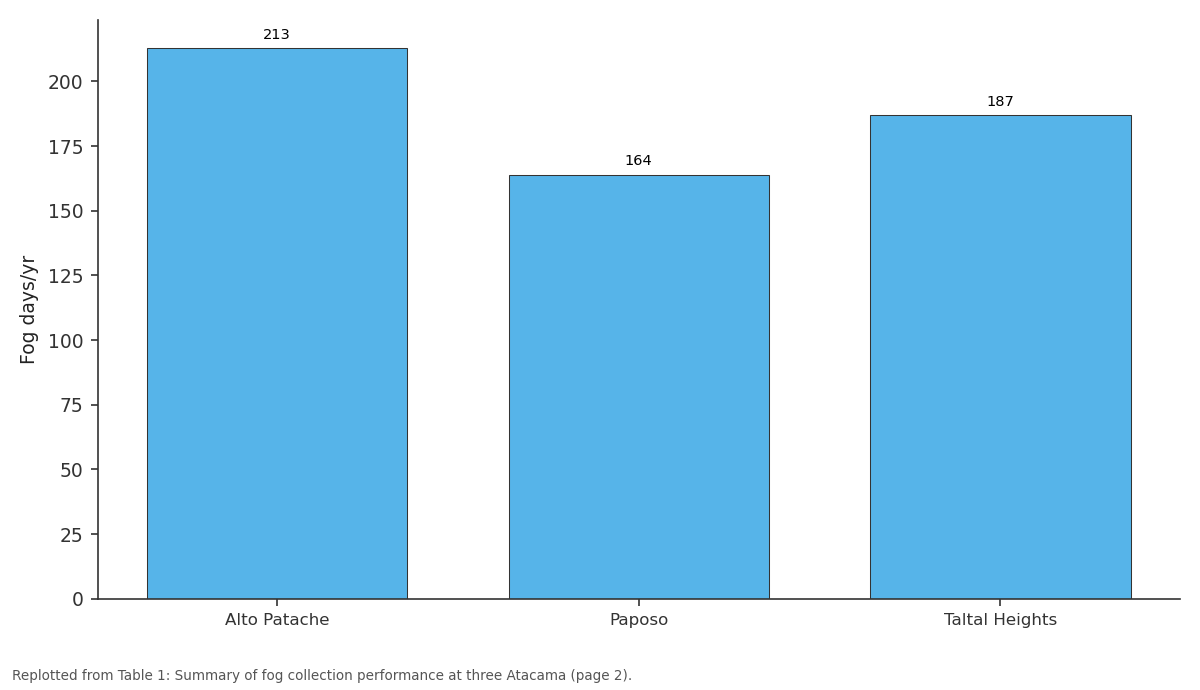
Fog days/yr: Alto Patache vs Paposo vs Taltal Heights
Replotted from Table 1 (page 2) of the original paper. Every bar is the paper's own table value.
View source evidence ↗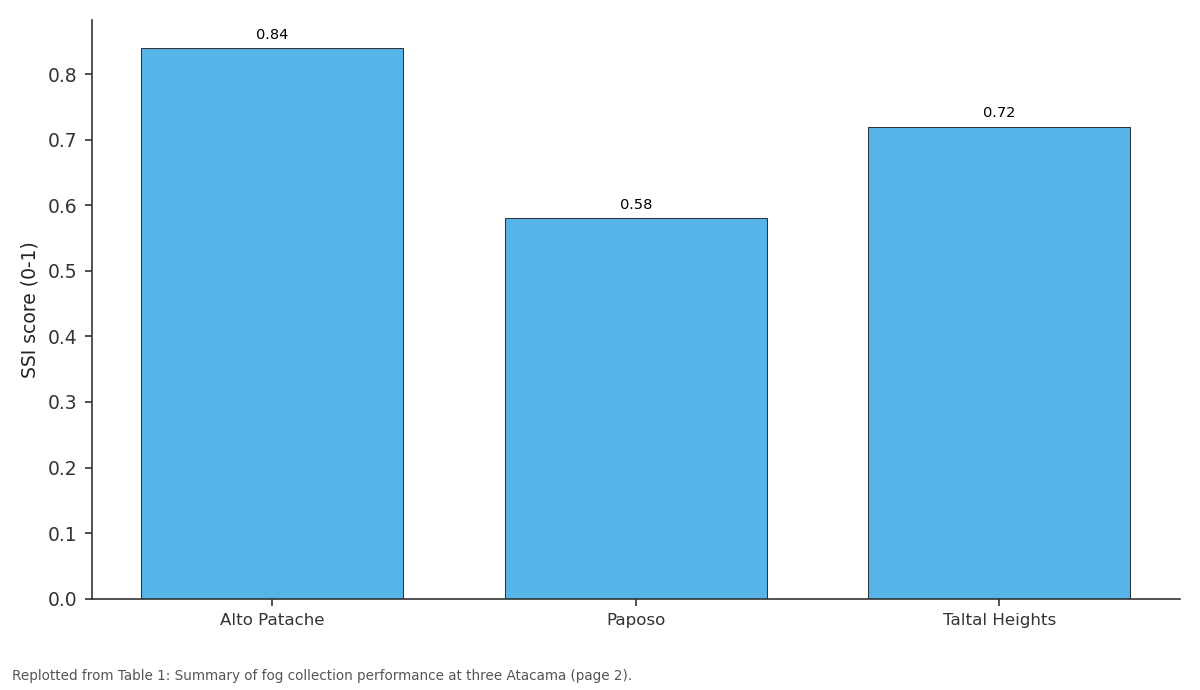
SSI score (0-1): Alto Patache vs Paposo vs Taltal Heights
Replotted from Table 1 (page 2) of the original paper. Every bar is the paper's own table value.
View source evidence ↗Figures & tables
From the original paper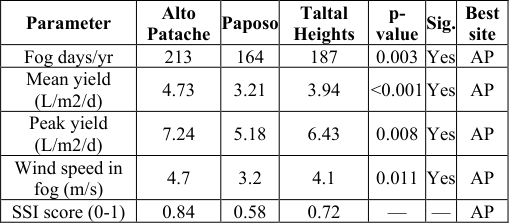 Table 1
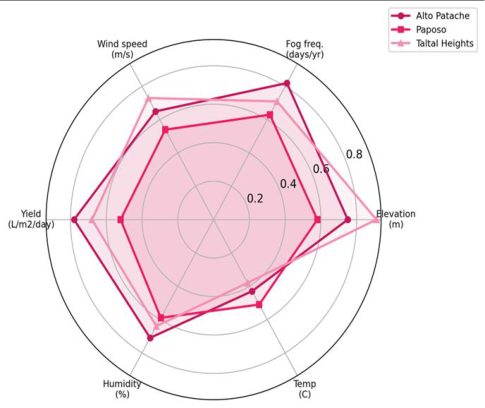 Figure 1
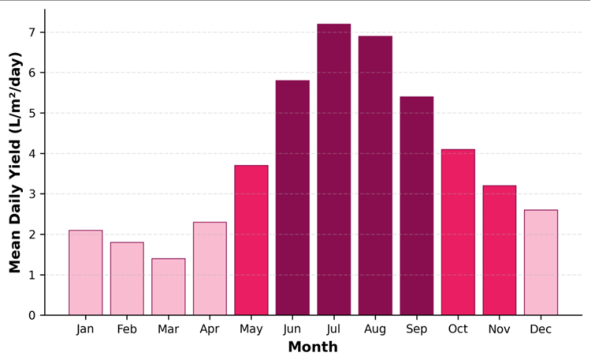 Figure 2
Introduction
Consider a fishing village on the Chilean coast where the nearest freshwater source is a desalination plant 40 km to the south and rainfall averages less than 2 mm per year. Now consider that the same village sits beneath a fog belt that delivers moisture equivalent to 100-200 mm annually to the mountain slopes directly behind it [1] . Fog water harvesting, the practice of intercepting wind-driven fog droplets on mesh screens, bridges this paradox by converting atmospheric moisture into a usable supply without energy-intensive desalination. The Atacama Desert coast is blanketed by a persistent marine stratocumulus layer, locally called camanchaca, generated by the cold Humboldt Current upwelling. When onshore winds push this cloud deck against the coastal escarpment at elevations between 400 and 1,200 m, fog droplets (5-40 micrometres diameter) deposit onto surfaces at rates that vary with mesh geometry, wind speed, and liquid water content [2] . The concept is not new: Schemenauer and Cereceda demonstrated its viability in the 1990s at El Tofo and Chungungo, where a 75-collector array supplied a village with 15,000 litres per day for several years before maintenance problems led to abandonment [3] . What has changed since those pioneering trials is the availability of low-cost weather sensors, higher-performance mesh materials, and GIS-based siting tools that can screen large areas for favourable topographic and meteorological conditions [4,5]. Yet systematic multisite comparisons of fog collection along the Atacama coastal mountains remain scarce. Most published data come from single-station records, making it difficult to generalise about how collection rates vary with latitude, elevation, and exposure [6] . This research addressed that gap by operating identical standard fog collectors at three sites spanning 250 km of coastline, recording meteorological covariates at high temporal resolution, and constructing a sitesuitability index to rank locations for operational deployment [7] .
Theoretical Background
Fog deposition on mesh collectors follows the physical principles of inertial impaction. As air carrying suspended droplets flows through a mesh, droplets with enough momentum deviate from the streamlines and collide with mesh filaments. The collection efficiency depends on the Stokes number, a dimensionless ratio of droplet inertia to air viscosity, which in turn varies with droplet diameter, wind speed, and filament diameter [8] . For typical Atacama fog conditions (droplet diameter 10-30 micrometres, wind speed 3-5 m/s, Raschel mesh filament 1 mm), collection efficiencies range from 20 to 40% of the liquid water content [2] . The shade coefficient of the mesh, defined as the fraction of area blocked by filaments, governs the trade-off between interception area and aerodynamic resistance; values near 35% represent an empirical optimum for Raschel polypropylene mesh [9] .
Study Area Description
Study Area Description
Material and Methods Material
Three cylindrical standard fog collectors (SFC) built to the Schemenauer-Cereceda design (1.0 m diameter, 1.0 m height, double-layer 35% shade Raschel mesh) were installed at each site in April 2021. Collection water drained through a 2 mm mesh pre-filter into calibrated tippingbucket rain gauges (0.2 mm resolution). Co-located Davis Vantage Pro2 automatic weather stations recorded temperature, relative humidity, wind speed and direction, barometric pressure, and solar radiation at 10-minute intervals. Visibility sensors (Biral VPF-710) measured atmospheric extinction coefficient as a proxy for fog liquid water content [10] . All instruments were solar-powered with data loggers transmitting via satellite modem.
Methods
Fog events were defined as continuous periods when visibility dropped below 1,000 m for at least 30 minutes. Daily collection rates (L/m2/day) were calculated by dividing total collected volume by the mesh cross-sectional area (1.0 m2) and the number of days. Seasonal and diurnal patterns were analysed by aggregating data into monthly means and hourly medians. A site-suitability index (SSI) was constructed as a weighted sum of five normalised variables: fog frequency (weight 0.30), mean daily yield (0.25), wind speed during fog events (0.20), elevation advantage (0.15), and road accessibility (0.10), with weights assigned by expert judgment [11] . Statistical comparisons between sites used Kruskal-Wallis tests with post-hoc Dunn tests at alpha = 0.05 in R 4.2.
Results
Results
Discussion
The 4.73 L/m2/day mean at Alto Patache exceeds the 3.0 L/m2/day threshold generally considered economically viable for community-scale fog harvesting [3] . Projected over a 100 m-squared collector array operating 365 days, this translates to roughly 170,000 litres per year, or about 470 litres per day. At a per-capita consumption of 12-15 litres per day (the minimum recommended by the WHO for drinking and cooking in emergency settings), such an array could serve 30-40 people [12] . The seasonal concentration of yield poses a storage challenge. Tanks sized to hold two months of supply would be needed to bridge the low-yield summer period. Hybrid systems that combine fog collection with small-scale solar desalination or atmospheric water generation could smooth the supply curve and improve reliability [13] . The cost of standard fog collectors (approximately USD 300 per m2 of mesh area, including structure and plumbing) compares favourably with trucked water (USD 5-15 per m3) and even with small reverse-osmosis units in remote locations [14] . The suitability index ranked Alto Patache first (SSI = 0.84) primarily because of its fog frequency and wind exposure advantages. Taltal Heights scored well on elevation and yield but was penalised by poor road access, which would increase installation and maintenance costs. Paposo, despite being the most accessible site, suffers from a topographic shadow that reduces fog interception [15] . These rankings should be treated as indicative; ground-truthing additional candidate sites with at least 6 months of SFC data is advisable before committing to large infrastructure investments [16] . [17,18] .
Conclusion
Conclusion
Acknowledgement
Acknowledgements Funding SourcesThis research was supported by internal funding from the Seoul Academy of Geographic Research.
Figures and tables from the paper
| Parameter | Alto Patache | Paposo | Taltal Heights | p- value | Sig. | Best site |
|---|---|---|---|---|---|---|
| Fog days/yr | 213 | 164 | 187 | 0.003 | Yes | AP |
| Mean yield (L/m2/d) | 4.73 | 3.21 | 3.94 | <0.001 | Yes | AP |
| Peak yield (L/m2/d) | 7.24 | 5.18 | 6.43 | 0.008 | Yes | AP |
| Wind speed in fog (m/s) | 4.7 | 3.2 | 4.1 | 0.011 | Yes | AP |
| SSI score (0-1) | 0.84 | 0.58 | 0.72 | — | — | AP |
Table text extracted from the original PDF; superscript letters are shown inline. The original table image is below.
View original table image
References
18 in the original paper- Cereceda P, Larrain H, Osses P, Farias M, Egana I. The spatial and temporal variability of fog and its relation to fog oases in the Atacama Desert, Chile. Atmospheric Research. 2008;87(3-4):312-323.
- Schemenauer RS, Joe PI. The collection efficiency of a massive fog collector. Atmospheric Research. 1989;24(1-4):53-69.
- Schemenauer RS, Cereceda P. Fog-water collection in arid coastal locations. Ambio. 1991;20(7):303-308.
- Klemm O, Schemenauer RS, Lummerich A, Cereceda P, Marzol V, Corell D. Fog as a fresh-water resource: overview and perspectives. Ambio. 2012;41(3):221234.
- Fessehaye M, Abdul-Wahab SA, Savage MJ, Kohler T, Gherezghiher T, Hurni H. Fog-water collection for community use. Renewable and Sustainable Energy Reviews. 2014;29:52-62.
- Marzol MV, Sanchez-Megias JL. Fog water harvesting in Ifni, Morocco: an assessment of potential and demand. Die Erde. 2008;139(1-2):97-119.
- del Rio C, Garcia JL, Osses P, Zanetta N, Lambert F, Rivera D. ENSO influence on coastal fog-water yield in the Atacama Desert, Chile. Aerosol and Air Quality Research. 2018;18(1):127-144.
- Park KC, Chhatre SS, Srinivasan S, Cohen RE, McKinley GH. Optimal design of permeable fiber network structures for fog harvesting. Langmuir. 2013;29(43):13269-13277.
- Rivera JD. Aerodynamic collection efficiency of fog water collectors. Atmospheric Research. 2011;102(3):335-342.
- Biral. VPF-710 Visibility and Present Weather Sensor Technical Manual. Bristol Industrial and Research Associates Ltd. 2019.
- Domen JK, Stringfellow WT, Camarillo MK, Gulati S. Fog water as an alternative and sustainable water resource. Clean Technologies and Environmental Policy. 2014;16(2):235-249.
- WHO. Domestic Water Quantity, Service Level and Health. World Health Organization. Geneva. 2003.
- Tu Y, Wang R, Zhang Y, Wang J. Progress and expectation of atmospheric water harvesting. Joule. 2018;2(8):1452-1475.
- Lekouch I, Muselli M, Kabbachi B, Ouazzani J, Melnytchouk-Milimouk I, Beysens D. Dew, fog, and rain as supplementary sources of water in south-western Morocco. Energy. 2011;36(4):2257-2265.
- Larrain H, Velasquez F, Cereceda P, Espejo R, Pinto R, Osses P. Fog measurements at the site Falda Verde north of Chanaral compared with other fog stations of Chile. Atmospheric Research. 2002;64(1-4):261-271.
- Regalado CM, Ritter A. On the estimation of fog-water collection by means of a standard fog gauge. Aerosol and Air Quality Research. 2016;16(12):3191-3199.
- Carvajal DE, Lobo-Guerrero A, Espinoza R, Guzman R. Large-scale fog collectors as a potential complementary water source in northern Chile. Water Supply. 2023;23(4):1654-1668.
- Holmes R, de Rivera CE, Castillo JE. Development of next-generation fog collectors on the Atacama coast. Journal of Arid Environments. 2020;174:104075.