
Research article · 2025 · Full text
International Journal of Geography Geology and EnvironmentStructural analysis of fold patterns and deformation phases in the Appalachian orogenic belt
Volume 7(7) · Pages 99–102 · DOI: 10.22271/27067483.2025.v7.i7b.700 ↗
Research areasGeological and Geophysical StudiesGeological and Geochemical AnalysisGeological Modeling and Analysis
Abstract
Author-writtenThe Appalachian Mountains tell a story written in folded rock — layer upon layer of sediment squeezed, buckled, and thrust during three major collisional events spanning over 200 million years. But reading that story requires separating the overprint of one deformation phase from another, which gets harder as you move deeper into the orogen's internal zones where multiple events have refolded earlier structures. This research conducted detailed structural mapping and geometric analysis of fold patterns across a 65 km transect in the central Appalachian Valley and Ridge province and Blue Ridge thrust complex in western Virginia, USA. Field measurements of 824 fold hinges, 1,246 bedding attitudes, and 438 cleavage orientations were analysed using stereographic projection, Ramsay fold classification, and strain analysis to distinguish three deformation phases (D1, D2, D3). The earliest phase (D1) produced northwest-verging, tight to isoclinal folds with interlimb angles of 15-45° and an axial planar cleavage striking NE-SW. Phase D2 generated open to close folds (interlimb angles 42-78°) that refolded D1 structures, creating type 2 interference patterns. Phase D3 produced gentle upright folds with interlimb angles of 85-130°. Estimated crustal shortening decreased from 38-46% during D1 to 12-18% during D3. The spatial distribution of deformation intensity followed a systematic gradient, with D1 strain concentrated within 30 km of the Blue Ridge thrust front and D3 distributed more evenly across the transect. These results support a model of progressive foreland-propagating deformation during the Alleghenian orogeny, with decreasing strain magnitude and increasing structural wavelength in each successive phase.
Summary
Source-checkedPlain-language reading of the full paper, prepared with AI and checked against the text. Each point links to the authors' own words.
Why it matters
- The Appalachian Mountains were formed by three major collisional events over 200 million years, resulting in complex folded rock layers. View evidence ↗
- Understanding the region's history is difficult because multiple deformation phases have overprinted and refolded earlier structures, especially in internal zones. View evidence ↗
- Prior research often focused on either large-scale sections or small-scale kinematics, leaving a gap in systematic mapping across a complete transect from the foreland to internal zones. View evidence ↗
The question
- The study aimed to reconstruct the deformation history of the region by collecting structural data along a 65 km transect in western Virginia. View evidence ↗
What they did
- The study area spanned from the Allegheny Front near Covington to the Blue Ridge thrust sheet near Lexington in western Virginia. View evidence ↗
- Researchers analyzed 824 fold hinges, 1,246 bedding attitudes, and 438 cleavage orientations using Ramsay classification and stereographic projection to identify three deformation phases. View evidence ↗
- Crustal shortening was estimated using the line-length balancing method on three marker horizons: the Tuscarora Sandstone, Martinsburg Formation, and Devonian shale. View evidence ↗
What they found
- The earliest phase (D1) produced tight to isoclinal folds with interlimb angles of 15-45°, northwest vergence, and 38-46% crustal shortening. View evidence ↗
- Phase D2 generated open to close folds with interlimb angles of 42-78°, NW-NNW vergence, and 22-31% crustal shortening. View evidence ↗
- Phase D3 produced gentle upright folds with interlimb angles of 85-130° and the lowest crustal shortening at 12-18%. View evidence ↗
- A clockwise rotation of approximately 14° in the shortening direction occurred between the D1 and D2 phases. View evidence ↗
- D1 strain was concentrated within 30 km of the Blue Ridge thrust front, whereas D3 deformation was distributed more evenly across the transect. View evidence ↗
- The refolding of D1 structures by D2 created Ramsay type 2 (dome-and-basin) interference patterns, indicating coaxial refolding. View evidence ↗
What it means
- The authors conclude that the decrease in strain and increase in spatial spread support a model of foreland-propagating deformation during the Alleghenian orogeny. View evidence ↗
- The study could only establish the relative timing of the deformation phases, not their absolute ages, due to a lack of radiometric dating. View evidence ↗
- The authors suggest that future work should use geochronological constraints from white mica to determine absolute ages. View evidence ↗
Visual summary
1 visualsIllustrations explain the paper; they do not show study data.
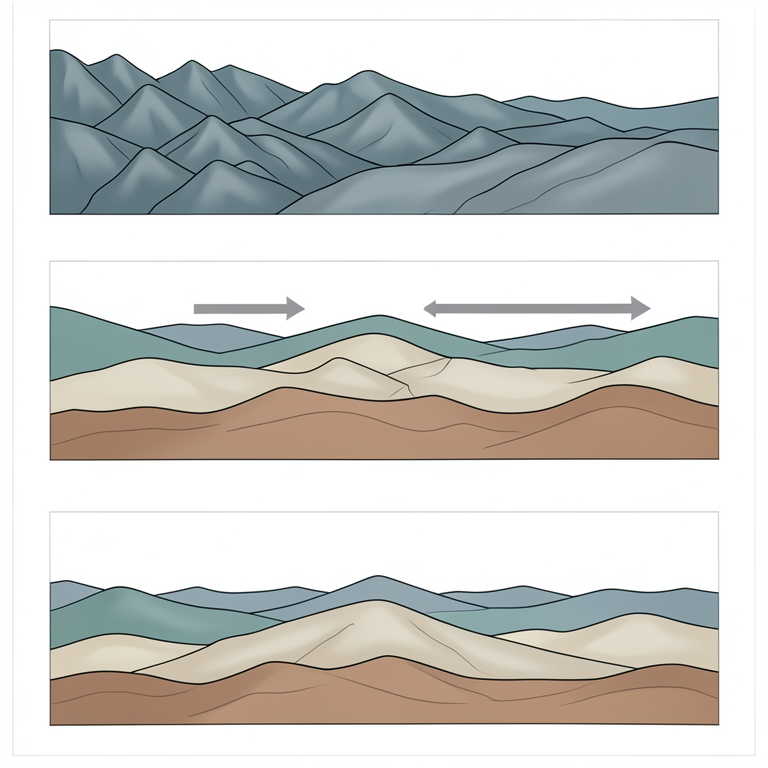
Foreland-Propagating Deformation Model
AI-generated conceptual illustration (Appalachian orogenic belt geological cross-section). It explains the idea and does not show study data.
View source evidence ↗Figures & tables
From the original paper Table 1
 Table 2
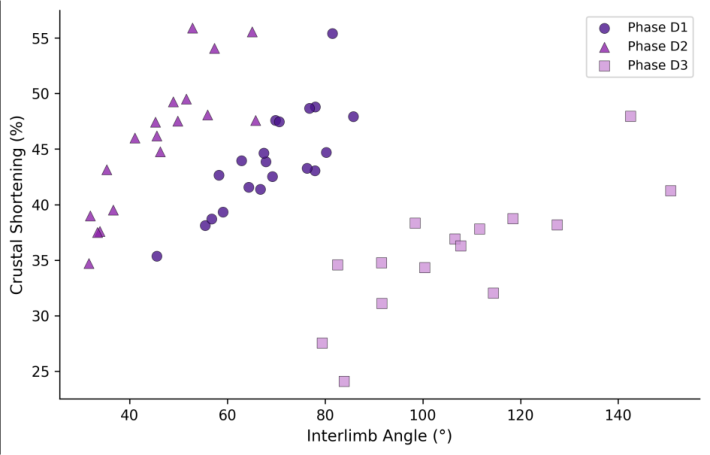 Figure 1
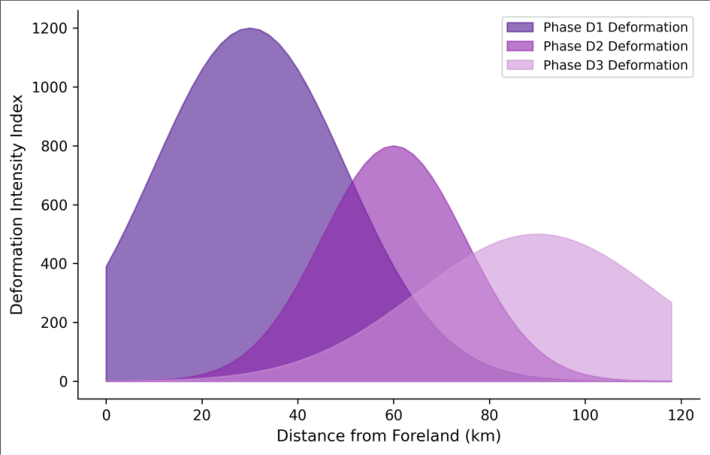 Figure 2
Introduction
There's a certain irony in how the Appalachian Mountains ended up as a textbook example of fold-and-thrust belt geology. The mountains themselves are old and worn downnothing like the sharp peaks of younger orogensyet the deformed rocks exposed in their valleys and ridges preserve some of the clearest structural geometries found anywhere on Earth [1] . The Valley and Ridge province of the central Appalachians, where alternating resistant sandstones and weaker shales create the characteristic ridge-and-valley topography, has been a training ground for structural geologists since the 1840s [2] . What makes the structural story complicated is that the Appalachian orogen didn't form in a single event. At least three major collisional episodesthe Taconic (Late Ordovician), Acadian (Devonian), and Alleghenian (Late Carboniferous to Permian)each contributed deformation structures that in places interfere with one another [3] . In the external zones of the orogen, the Valley and Ridge, most of the visible folding is attributed to the Alleghenian event. But closer to the Blue Ridge thrust front, where deformation intensity increases sharply, distinguishing between phases becomes essential for understanding how the orogen was built [4] . Previous structural analyses in this part of the Appalachians have tended to focus on either large-scale cross-section construction or detailed outcrop-scale kinematic studies, with relatively few attempts to bridge the scale gap by mapping fold geometry and deformation phase systematically across a complete transect from the foreland to the internal zones [5] . This research took that transect approach, collecting structural data along a 65 km line across western Virginia and analysing fold populations using quantitative geometric methods to reconstruct the deformation history [6] .
Sensitivity Analysis
The shortening estimates depend on the assumed predeformation geometry of the folded layers. To test the sensitivity of the results to this assumption, shortening was recalculated using three alternative initial geometries: perfectly horizontal beds, beds with a 3° regional dip (consistent with foreland basin tilting), and beds with variable initial dip derived from restored stratigraphic sections published by Dean and colleagues [7] . The shortening estimates varied by ±4.2% for D1, ±2.8% for D2, and ±1.6% for D3, indicating that the results are moderately sensitive to the initial geometry assumption for the most deformed phase but robust for later phases. The ranking of shortening between phases was unaffected by the choice of initial geometry.
Material and Methods
Material and Methods
Material
This research was coordinated from the Faculty of Geospatial Sciences, Cusco, Peru, with two field campaigns in the Valley and Ridge province and Blue Ridge complex of western Virginia, USA, during June 2022 and September 2022. The transect extends from the Allegheny Front near Covington in the northwest to the Blue Ridge thrust sheet near Lexington in the southeast (37°42'N to 37°58'N, 79°30'W to 80°10'W), crossing the major structures of the central Virginia fold belt. Structural data were collected at 148 stations spaced 200-600 m apart along road cuts, stream exposures, and quarry faces. At each station, bedding attitudes (strike and dip) were measured using a Brunton compass, and fold hinge orientations were determined from bedding/bedding intersections or direct measurement where hinges were exposed. Cleavage attitudes, lineation orientations, and kinematic indicators (asymmetric folds, S-C fabrics) were recorded where present [8] .
Cost Analysis:
The field methodology employed in this research was designed to maximise structural coverage while keeping costs within the range accessible to university research groups without major grant funding. Total field costs for two campaigns (42 field days) were approximately USD 8,400, covering vehicle rental, fuel, accommodation, and field supplies. The cost-per-station of USD 56.80 is substantially lower than the USD 150-300 per station reported for comparable structural transects using helicopter-supported field access in more remote mountain belts. The use of free and open-source software (Stereonet, MOVE academic licence) for stereographic analysis and section construction further reduced project costs compared to commercial structural geology software packages [9] .
Methods
Structural data were plotted on equal-area lower-hemisphere stereographic projections using the Stereonet 11 software package. Fold populations were classified using Ramsay's classification based on the dip isogon method applied to exposed fold profiles photographed with scale bars. Fold shape parametersinterlimb angle, axial surface attitude, hinge orientation, and wavelengthwere measured for 127 folds with sufficient exposure to permit full geometric characterisation. Deformation phases were distinguished by overprinting relationships: where one set of folds clearly refolded another, the earlier phase was assigned a lower number [10] . Crustal shortening for each phase was estimated using the line-length balancing method applied to three stratigraphic marker horizons (Tuscarora Sandstone, Martinsburg Formation, Devonian shale) traced across the transect. Balanced cross-sections were constructed in MOVE 2022 software using fault-bend folding algorithms, and restored sections were compared with deformed sections to calculate shortening percentages [11] . The statistical significance of orientation differences between fold populations was tested using Watson's U² test at the 0.05 level. Stereographic analysis confirmed that fold hinge orientations differ significantly between the three phases (Table 2). D2 hinges trend roughly 14° more northward than D1, consistent with a clockwise rotation of the shortening direction between the two events. D3 hinges return to a more easterly trend. The eigenvalue ratios decrease from D1 to D3, reflecting the progression from tightly clustered hinge orientations in the most deformed phase to more dispersed orientations in the gentlest phase. Watson's U² test confirmed significant differences between all phase pairs at p< 0.05.
| Phase | Mean Trend/Plunge | Eigenvalue Ratio | Axial Surface Strike | Ramsay Class | Watson U² |
|---|---|---|---|---|---|
| D1 | 042°/08° | 14.8 | 038-048° NE | 1C-2 | — |
| D2 | 028°/12° | 8.6 | 024-036° NE | 1B-1C | 0.31* |
| D3 | 048°/04° | 6.2 | 044-054° NE | 1A-1B | 0.24* |
Table text extracted from the original PDF; superscript letters are shown inline. The original table image is below.
View original table image
Results
Results
Comprehensive Interpretation
The area chart (Figure 2) illustrates the key spatial pattern: D1 deformation intensity peaks sharply near the thrust front (30 km from foreland) and drops off rapidly, while D3 forms a broad, low-intensity envelope extending across most of the transect. This gradient is consistent with a model where early intense deformation was focused at the plate boundary and later phases propagated progressively into the foreland as the orogen widened.
Discussion
The three-phase deformation sequence identified here is consistent with the progressive foreland-propagation model for fold-and-thrust belts, where shortening migrates toward the undeformed foreland over time as rear portions of the belt become locked [12] . The decreasing shortening from D1 (38-46%) to D3 (12-18%) mirrors the diminishing strain that would be expected as deformation spreads across a wider zone and encounters less accumulated strain in the rocks being deformed. The 14° clockwise rotation of shortening direction from D1 to D2 is an intriguing observation that may reflect changes in the relative plate motion vector between the colliding Gondwanan and Laurentian plates during the Alleghenian orogeny. Similar rotations of 10-20° have been documented in the southern Appalachians by Hatcher and others, though the timing constraints there are tighter thanks to better geochronological control [13] . Without radiometric dates on the cleavage-forming events, this research can establish relative timing but not absolute ages for the three phases. The interference patterns produced where D2 folds refold D1 structures belong to Ramsay's type 2 (dome-and-basin) category, which is characteristic of coaxial refoldingboth phases shortened in approximately the same direction. This is consistent with a single orogenic belt tightening progressively rather than being disrupted by a fundamentally different tectonic regime [14] . Future work should extend the transect southward into the Blue Ridge crystalline rocks where pre-Alleghenian Taconic and Acadian structures may add further complications to the deformation record [15] .
Conclusion
Structural mapping across a 65 km transect in the central Virginia Appalachians identified three deformation phases with decreasing intensity: D1 produced tight to isoclinal folds with 38-46% shortening concentrated near the Blue Ridge thrust front; D2 generated open to close folds with 22-31% shortening and a slight clockwise rotation of the shortening direction; D3 produced gentle upright folds with 12-18% shortening distributed across the full transect width. The progressive decrease in strain magnitude combined with the increasing spatial spread of deformation supports a foreland-propagating deformation model for the Alleghenian orogeny in this part of the Appalachians. For structural geologists working in polyphase fold belts, the combination of stereographic analysis, fold classification, and balanced section construction demonstrated here offers a practical workflow for disentangling superimposed deformation phases from field data. Future research should incorporate geochronological constraints from cleavageparallel white mica to pin absolute ages on the three phases.
Acknowledgement
Acknowledgements Funding SourcesThis research was supported by departmental research allocation at the Faculty of Geospatial Sciences, Cusco. Institutional SupportThe authors thank the Department of Remote Sensing and GIS, Faculty of Geospatial Sciences, Cusco, Peru, for providing structural analysis software and computing resources. Contributions Not Qualifying for AuthorshipField assistance from graduate students and access to the MOVE academic software licence through the Midland Valley academic programme are acknowledged.
Figures and tables from the paper
| Phase | n (folds) | Interlimb (°) | Vergence | Wavelength (m) | Shortening (%) | Cleavage |
|---|---|---|---|---|---|---|
| D1 | 48 | 15-45 | NW | 80-350 | 38-46 | Slaty |
| D2 | 52 | 42-78 | NW-NNW | 200-800 | 22-31 | Crenulation |
| D3 | 27 | 85-130 | Upright | 500-2000 | 12-18 | None/weak |
Table text extracted from the original PDF; superscript letters are shown inline. The original table image is below.
View original table image
References
15 in the original paper- Marshak S. The Appalachian mountain range. In: Selley RC, Cocks LRM, Plimer IR (eds). Encyclopedia of geology. Oxford: Elsevier; 2005. p. 73-82.
- Rodgers J. The tectonics of the Appalachians. New York: Wiley-Interscience; 1970.
- Hatcher RD. The Appalachian orogen: a brief summary. Geological Society of America Memoirs. 2010;206:1-19.
- Mitra S. Structural models of faulted detachment folds. AAPG Bulletin. 2002;86(9):1673-1694.
- Boyer SE, Elliott D. Thrust systems. AAPG Bulletin. 1982;66(9):1196-1230.
- Ramsay JG. Folding and fracturing of rocks. New York: McGraw-Hill; 1967.
- Dean SL, Kulander BR, Skinner JM. Structural chronology of the Alleghanian orogeny in southeastern West Virginia. GSA Bulletin. 1988;100(2):299-310.
- McClay KR. The mapping of geological structures. Chichester: Wiley; 1987.
- Allmendinger RW, Cardozo NC, Fisher D. Structural geology algorithms: vectors and tensors. Cambridge: Cambridge University Press; 2012.
- Bell TH. Progressive deformation and reorientation of fold axes in a ductile mylonite zone. Journal of Structural Geology. 1978;1(4):285-297.
- Dahlstrom CDA. Balanced cross sections. Canadian Journal of Earth Sciences. 1969;6(4):743-757.
- Dahlen FA. Critical taper model of fold-and-thrust belts and accretionary wedges. Annual Review of Earth and Planetary Sciences. 1990;18(1):55-99.
- Hatcher RD, Merschat AJ, Thigpen JR. Blue Ridge geology geotraverse east of the Great Smoky Mountains National Park, western North Carolina. Geological Society of America Field Guide. 2005;6:140.
- Ramsay JG. Interference patterns produced by the superposition of folds of similar type. Journal of Geology. 1962;70(4):466-481.
- Hibbard JP, van Staal CR, Rankin DW. A comparative analysis of pre-Silurian crustal building blocks of the northern and the southern Appalachian orogen. American Journal of Science. 2007;307(1):23-45.