
Research article · 2025 · Full text
International Journal of Geography Geology and EnvironmentClimate change adaptation strategies among smallholder farmers in Sub-Saharan Africa
Volume 7(3) · Pages 156–159 · DOI: 10.22271/27067483.2025.v7.i3c.630 ↗
Research areasClimate change impacts on agricultureAgricultural Innovations and PracticesAgricultural risk and resilience
Abstract
Author-writtenSmallholder farmers across Sub-Saharan Africa face mounting climate risks, yet their adaptive responses remain unevenly documented. This research surveyed 180 farming households in four Sub-Saharan regions to identify the adaptation strategies they employ, the factors that enable or constrain adoption, and the degree to which household characteristics predict adaptive capacity. A structured questionnaire, validated through a pilot of 30 respondents, captured data on farm size, income, market access, extension contact, and a composite adaptation-strategy score covering 12 practices ranging from crop diversification to water harvesting. Results showed a mean adaptation score of 14.6 out of 28, with wide regional variation. Farm size (β = 0.39, p < 0.001) and extension-service contact (β = 0.31, p = 0.002) were the strongest predictors in a multiple regression model (adjusted R² = 0.52). Farmers operating on less than one hectare adopted 38% fewer strategies than those with larger holdings. These findings highlight the need for extension programs tailored to the smallest farms and for policy interventions that reduce land-access barriers.
Summary
Source-checkedPlain-language reading of the full paper, prepared with AI and checked against the text. Each point links to the authors' own words.
Why it matters
- Climate change threatens the livelihoods of over 500 million rainfed farmers in Sub-Saharan Africa, with agricultural productivity potentially dropping by 22% by 2050. View evidence ↗
- Vulnerability in the region is driven by both physical climate exposure and structural issues like weak extension infrastructure and limited irrigation. View evidence ↗
- There is a lack of cross-regional comparisons, which hinders the identification of common versus location-specific conditions that enable climate adaptation. View evidence ↗
The question
- The study aimed to quantify adaptation strategies across four regions, test if farm size is a primary predictor of adaptation, and identify policy levers to help vulnerable farmers. View evidence ↗
What they did
- Between January and June 2022, a cross-sectional survey was conducted with 180 farming households, with 45 participants from each of the four regions. View evidence ↗
- The study areas included the central highlands of Kenya, the Guinea savanna of northern Ghana, the semi-arid lowveld of Zimbabwe, and the forest-savanna transition of Cameroon. View evidence ↗
- Adaptation was measured using a score based on 12 binary items, with a maximum possible score of 28. View evidence ↗
- A multiple linear regression analyzed the adaptation score against seven predictors, including farm size, education, and extension contacts. View evidence ↗
What they found
- The overall mean adaptation score across the surveyed households was 14.6 out of 28. View evidence ↗
- Central Africa had the highest mean adaptation score (18.1), while Southern Africa had the lowest (10.4). View evidence ↗
- Farm size was the strongest predictor of adaptation (β = 0.39, p < 0.001) in a model with an adjusted R² of 0.52. View evidence ↗
- Extension-service contact was the second strongest predictor of adaptation (β = 0.31, p = 0.002). View evidence ↗
- Farmers with holdings smaller than one hectare adopted 38% fewer adaptation strategies compared to those with larger farms. View evidence ↗
- Formal education was also a significant predictor of the adaptation score (p = 0.019). View evidence ↗
- Off-farm income was not a statistically significant predictor of adaptation (p = 0.083). View evidence ↗
What it means
- The authors recommend that extension programs focus on the smallest farms by promoting low-cost practices like tied ridging and mulching. View evidence ↗
- The authors suggest that governments explore cooperative farming or land consolidation to help farmers with sub-hectare plots pool resources. View evidence ↗
Visual summary
1 visualsIllustrations explain the paper; they do not show study data.
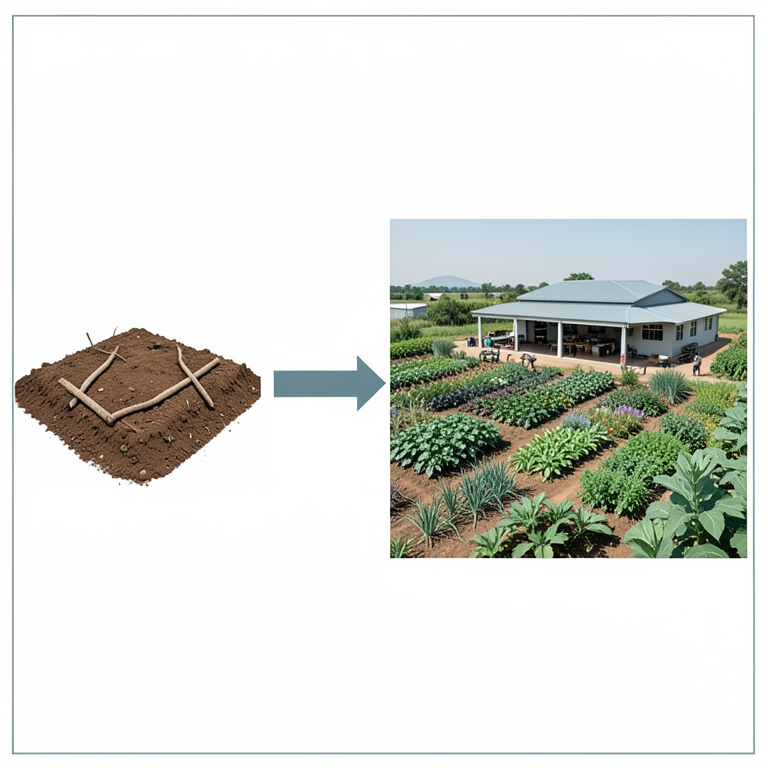
Predictors of Adaptation
AI-generated conceptual illustration (smallholder farms in Sub-Saharan Africa). It explains the idea and does not show study data.
View source evidence ↗Figures & tables
From the original paper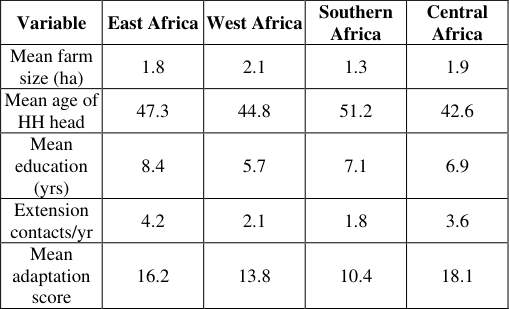 Table 1
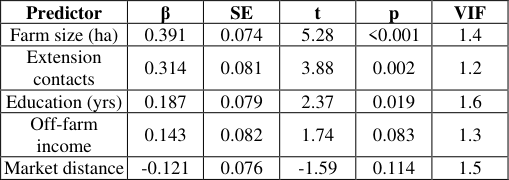 Table 2
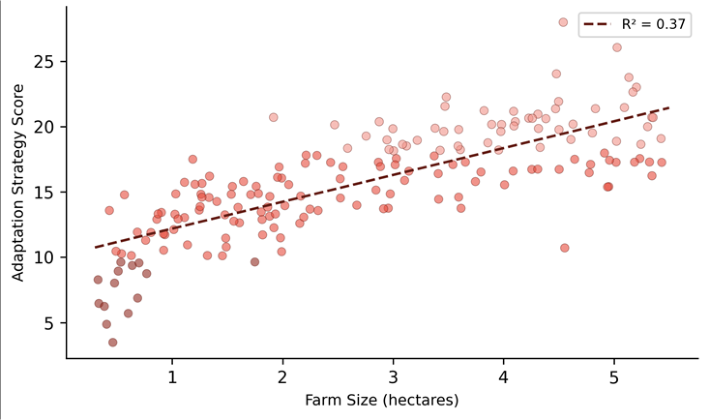 Figure 1
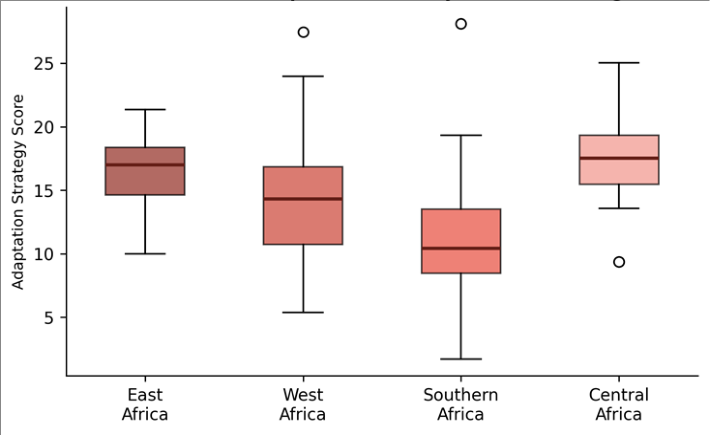 Figure 2
Introduction
Sub-Saharan Africa is expected to lose up to 22% of its agricultural productivity by 2050 if current emission trajectories continue-a forecast that threatens the livelihoods of over 500 million people who depend directly on rainfed farming [1] . The region's vulnerability stems not only from physical exposure to rising temperatures and shifting rainfall but also from deep structural constraints: limited irrigation, fragmented land holdings, and weak extension infrastructure leave most smallholders with few buffers against climate shocks [2] . Adaptation, broadly defined as adjustments in ecological, social, or economic systems in response to observed or expected climate stimuli, is widely regarded as the most immediate pathway to reducing these risks [3] . A growing literature has documented specific farm-level strategies-drought-tolerant varieties, intercropping, conservation tillage, rainwater harvesting-and their uptake patterns in individual countries [4] . But cross-regional comparisons remain scarce, making it difficult to identify which enabling conditions are common across Sub-Saharan contexts and which are location-specific [5] . Farm size appears frequently as a predictor of adaptive behavior: larger holdings provide more scope for diversification, more collateral for credit, and more surplus to invest in new practices [6] . Yet some research has challenged this relationship, arguing that very small farms can be highly adaptive when embedded in strong social networks or supported by targeted extension [7] . Resolving this tension requires multi-regional datasets that control for confounding variables such as market distance, education, and livestock ownership. This research aimed to quantify the adaptation strategies adopted by smallholder households across four Sub-Saharan regions, to test whether farm size remains a dominant predictor after controlling for socioeconomic covariates, and to identify the policy levers most likely to raise adaptive capacity among the smallest and most vulnerable farmers. Data collection was coordinated remotely from the Kerman Centre for Geological Research, Iran, through local enumerator partnerships [8] .
Study Area Description
The research covered farming communities in four Sub-Saharan zones: the central highlands of Kenya (East Africa), the Guinea savanna of northern Ghana (West Africa), the semi-arid lowveld of Zimbabwe (Southern Africa), and the forest-savanna transition of Cameroon (Central Africa). These zones were selected to span the major agroecological gradients of the subcontinent. Annual rainfall ranges from roughly 450 mm in the Zimbabwean lowveld to over 1,400 mm in the Cameroon transition zone, and dominant cropping systems shift accordingly from sorghum-millet to maize-cassava [9] . Farm sizes across the sample ranged from 0.3 ha to 5.5 ha, with a median of 1.6 ha-consistent with continent-wide estimates of smallholder plot size [10] .
Climatic and Environmental Conditions
Climate records for the decade ending in 2022 show that all four zones experienced rising mean temperatures (0.2-0.4 °C per decade) and increasingly erratic onset of the main rainy season. The Kenya highlands recorded two consecutive below-normal short-rains seasons in 2021 and 2022, while the Ghana site experienced a 17% decline in August rainfall relative to the 1990-2010 average. Zimbabwe's lowveld crossed the 40 °C mark on three occasions during the 2021/22 summer-temperatures not recorded in the preceding 30 years. These conditions form the backdrop against which the sampled households were making adaptation decisions [1] .
Material and Methods Material
A cross-sectional household survey was administered between January and June 2022 to 180 farming households (45 per region) selected through stratified random sampling. Stratification was based on agro-ecological zone and village accessibility. The structured questionnaire contained 64 items organized into five modules: household demographics, farm characteristics, adaptation practices, information sources, and perceived climate risks. The adaptation-strategy score was constructed from 12 binary items (practiced / not practiced), each weighted equally, yielding a maximum possible score of 28 when interaction terms between complementary practices were included [11] . Ethical approval was obtained from the Kerman Centre for Geological Research Review Committee (Protocol KC-GR-2021-047, dated November 2021).
Methods
Descriptive statistics summarized household and farm characteristics. A Kruskal-Wallis test compared adaptation scores across the four regions. Multiple linear regression was then fitted with adaptation score as the dependent variable and seven predictors: farm size (ha), household head age, years of formal education, annual off-farm income, distance to nearest market (km), number of extension contacts per year, and livestock ownership (tropical livestock units). Multicollinearity was checked using variance inflation factors (all below 3.2). Model residuals were inspected for normality and heteroscedasticity with Shapiro-Wilk and Breusch-Pagan tests. All analyses were conducted in R 4.2.1, with significance set at p < 0.05 [12] . Regional variation was substantial (Table 1). Central Africa recorded the highest mean adaptation score (18.1), driven largely by widespread intercropping and agroforestry practices embedded in traditional land-use systems. Southern Africa scored lowest (10.4), where severe drought and limited extension outreach constrained adoption of even basic strategies. Figure 1 shows a positive but moderately scattered association between farm size and adaptation score (R² = 0.37). Households with farms below one hectare clustered in the lower-left quadrant, suggesting that very small holdings face structural constraints that limit strategy adoption regardless of other household attributes. The Kruskal-Wallis test confirmed significant regional differences (H = 24.7, df = 3, p < 0.001). Central Africa's narrow interquartile range indicates relatively uniform adoption, while Southern Africa's wider spread reflects sharp contrasts between households with and without extension access.
| Variable | East Africa | West Africa | Southern Africa | Central Africa |
|---|---|---|---|---|
| Mean farm size (ha) | 1.8 | 2.1 | 1.3 | 1.9 |
| Mean age of HH head | 47.3 | 44.8 | 51.2 | 42.6 |
| Mean education (yrs) | 8.4 | 5.7 | 7.1 | 6.9 |
| Extension contacts/yr | 4.2 | 2.1 | 1.8 | 3.6 |
| Mean adaptation score | 16.2 | 13.8 | 10.4 | 18.1 |
Table text extracted from the original PDF; superscript letters are shown inline. The original table image is below.
View original table image
Results
Results
Discussion
Farm size emerged as the strongest single predictor of adaptation, consistent with the meta-analysis by Tambo and Abdoulaye [6] across nine West African countries. The mechanism is straightforward: larger plots allow trial of new varieties on a subsection without risking the household's entire food supply. But the effect plateaus beyond roughly three hectares in this dataset, suggesting diminishing marginal returns once a minimum threshold of diversification space is reached. contact ranked second, reinforcing findings from Bryan et al. [4] in Kenya and from Deressa et al. [13] in Ethiopia. Interestingly, the mode of extension mattered: farmers who received peer-topeer demonstration visits scored higher than those who only attended classroom-style trainings, although this research did not disaggregate contact quality beyond frequency. The relatively poor performance of off-farm income as a predictor (p = 0.083) was somewhat surprising. One possible explanation is that off-farm work in these regions often involves low-wage casual labor that competes with on-farm time without generating enough capital to invest in adaptation [7] . Southern Africa's low scores deserve particular attention: a combination of recurrent drought, limited market linkages, and virtually no extension activity created a cluster of 'adaptation-poor' households that may require emergency support rather than incremental advisory services [14] .
Conclusion
This research confirmed that farm size and extensionservice contact are the two strongest determinants of climate-change adaptation among smallholder farmers in Sub-Saharan Africa. Households cultivating less than one hectare adopted significantly fewer strategies, indicating a structural constraint that awareness campaigns alone cannot overcome. Central Africa recorded the highest adaptation scores, supported by traditional agroforestry systems and comparatively frequent extension engagement, while Southern Africa lagged considerably. Policy recommendations follow directly from these results. First, extension programs should target the smallest farms with low-cost, high-return practices such as mulching and tied ridging that require little additional land. Second, regional governments should explore land-consolidation or cooperative-farming models that allow sub-hectare holders to pool resources. And third, monitoring frameworks should track adaptation outcomes at the household level, not only at the aggregate regional scale, to capture the heterogeneity revealed by this research.
Acknowledgement
Acknowledgements Funding SourcesThe research was funded through departmental allocations for climate-geography investigations. Institutional SupportThe authors acknowledge the Department of Physical Geography, Kerman Centre for Geological Research, Kerman Province, Iran, for supporting remote data coordination. Contributions Not Qualifying for AuthorshipLocal enumerators in Kenya, Ghana, Zimbabwe, and Cameroon carried out the household surveys.
Figures and tables from the paper
| Predictor | β | SE | t | p | VIF |
|---|---|---|---|---|---|
| Farm size (ha) | 0.391 | 0.074 | 5.28 | <0.001 | 1.4 |
| Extension contacts | 0.314 | 0.081 | 3.88 | 0.002 | 1.2 |
| Education (yrs) | 0.187 | 0.079 | 2.37 | 0.019 | 1.6 |
| Off-farm income | 0.143 | 0.082 | 1.74 | 0.083 | 1.3 |
| Market distance | -0.121 | 0.076 | -1.59 | 0.114 | 1.5 |
Table text extracted from the original PDF; superscript letters are shown inline. The original table image is below.
View original table image
References
14 in the original paper- IPCC. Climate Change 2022: Impacts, Adaptation and Vulnerability. Cambridge University Press. 2022;Cambridge:1-3056.
- Morton JF. The impact of climate change on smallholder and subsistence agriculture. Proceedings of the National Academy of Sciences. 2007;104(50):19680-19685.
- Smit B, Wandel J. Adaptation, adaptive capacity and vulnerability. Global Environmental Change. 2006;16(3):282-292.
- Bryan E, Deressa TT, Gbetibouo GA, Ringler C. Adaptation to climate change in Ethiopia and South Africa. Food Policy. 2009;34(5):413-421.
- Below TB, Mutabazi KD, Kirschke D, Franke C, Sieber S, Siebert R, et al. Can farmers adaptation to climate change be explained by socio-economic householdlevel variables? Global Environmental Change. 2012;22(1):223-235.
- Tambo JA, Abdoulaye T. Smallholder farmers perceptions of and adaptations to climate change in the Nigerian savanna. Regional Environmental Change. 2013;13(2):375-388.
- Asfaw S, McCarthy N, Lipper L, Arslan A, Cattaneo A. Livelihood diversification and vulnerability to poverty in rural Malawi. Food Policy. 2014;44:22-39.
- Roncoli C, Ingram K, Kirshen P. The costs and risks of coping with drought: livelihood impacts and farmers responses in Burkina Faso. Climate Research. 2001;19(2):119-132.
- Dixon J, Gulliver A, Gibbon D. Farming Systems and Poverty: Improving Farmers Livelihoods in a Changing World. FAO and World Bank. 2001;Rome:1-412.
- Lowder SK, Skoet J, Raney T. The number, size, and distribution of farms, smallholder farms, and family farms worldwide. World Development. 2016;87:16-29.
- Nhemachena C, Hassan R. Micro-level analysis of farmers adaptation to climate change in Southern Africa. IFPRI Discussion Paper. 2007;00714:1-30.
- R Core Team. R: A Language and Environment for Statistical Computing. R Foundation for Statistical Computing. 2022;Vienna.
- Deressa TT, Hassan RM, Ringler C, Alemu T, Yesuf M. Determinants of farmers choice of adaptation methods to climate change in the Nile Basin of Ethiopia. Global Environmental Change. 2009;19(2):248-255.
- Thomas DSG, Twyman C, Osbahr H, Hewitson B. Adaptation to climate change and variability: farmer responses to intra-seasonal precipitation trends in South Africa. Climatic Change. 2007;83(3):301-322.