
Research article · 2025 · Full text
International Journal of Geography Geology and EnvironmentMapping of artisanal gold mining extent using sentinel-2 imagery in the Guiana shield
Volume 7(11) · Pages 109–112 · DOI: 10.22271/27067483.2025.v7.i11b.672 ↗
Research areasGeochemistry and Geologic MappingMining and Resource ManagementRemote-Sensing Image Classification
Abstract
Author-writtenArtisanal and small-scale gold mining (ASGM) in the Guiana Shield region of South America has expanded dramatically over the past two decades, driven by rising gold prices and limited economic alternatives for local communities. This expansion has resulted in widespread deforestation, river sedimentation, and mercury contamination of aquatic ecosystems. Accurate mapping of ASGM spatial extent is essential for environmental monitoring and regulatory enforcement, yet the remote nature of many mining areas makes ground surveys impractical. This research employs multi-temporal Sentinel-2 multispectral imagery to map ASGM extent across a 45,000 km² area within the Guiana Shield, encompassing portions of Suriname and French Guiana. A supervised Random Forest classification was applied to annual composites from 2018 to 2023, incorporating spectral bands, vegetation indices, and textural features. The classification achieved 89.3% overall accuracy with kappa of 0.86. Mining-affected area increased from 1,240 ha in 2018 to 3,870 ha in 2023—a 212% expansion—with the most rapid growth along previously unaffected tributaries. Mercury contamination risk zones were delineated using hydrological flow accumulation, identifying 2,300 km of high-risk stream length intersecting protected areas and indigenous territories. These findings support the development of operational satellite monitoring systems for ASGM regulation.
Summary
Source-checkedPlain-language reading of the full paper, prepared with AI and checked against the text. Each point links to the authors' own words.
Why it matters
- Artisanal and small-scale gold mining (ASGM) in South America's Guiana Shield has grown rapidly due to increasing gold prices and a lack of other economic options for local people. View evidence ↗
- The growth of ASGM has caused significant environmental damage, including deforestation, the sedimentation of rivers, and the contamination of aquatic systems with mercury. View evidence ↗
- Because many mining sites are in remote areas, ground surveys are impractical, making accurate spatial mapping essential for regulation and monitoring. View evidence ↗
The question
- The study aims to use Sentinel-2 satellite imagery to map the extent of ASGM in the Guiana Shield and measure how much it expanded between 2018 and 2023. View evidence ↗
What they did
- The researchers analyzed a 45,000 km² area covering parts of French Guiana and Suriname using multi-temporal Sentinel-2 multispectral imagery. View evidence ↗
- A Random Forest classification model with 500 trees was implemented in Google Earth Engine, with accuracy verified using 850 stratified random reference points. View evidence ↗
- The classification model incorporated thirteen spectral bands, three vegetation indices (NDVI, EVI, NDWI), and four textural features derived from the NIR band. View evidence ↗
- To identify mercury risk, the study classified stream reaches as high risk if they were located within 25 km downstream of active mining operations. View evidence ↗
What they found
- The land cover classification achieved an overall accuracy of 89.3% and a kappa coefficient of 0.86. View evidence ↗
- The area affected by mining grew by 212%, increasing from 1,240 hectares in 2018 to 3,870 hectares in 2023. View evidence ↗
- The highest rate of expansion occurred between 2020 and 2021, which the authors link to higher gold prices and decreased law enforcement during the COVID-19 pandemic. View evidence ↗
- The study identified 2,300 km of high-risk stream length for mercury contamination that overlaps with indigenous territories and protected areas. View evidence ↗
- The spatial analysis revealed that mining is advancing into previously undisturbed interior tributaries. View evidence ↗
What it means
- The authors conclude that without stronger deterrents, mining will continue to encroach upon pristine forests. View evidence ↗
- The authors recommend implementing operational satellite monitoring to provide the necessary evidence for governing ASGM. View evidence ↗
- A stated limitation is the inability to detect mining under persistent cloud cover, which the authors suggest could be solved by integrating Sentinel-1 SAR data. View evidence ↗
Visual summary
3 visualsIllustrations explain the paper; charts are replotted from the paper's own table values.
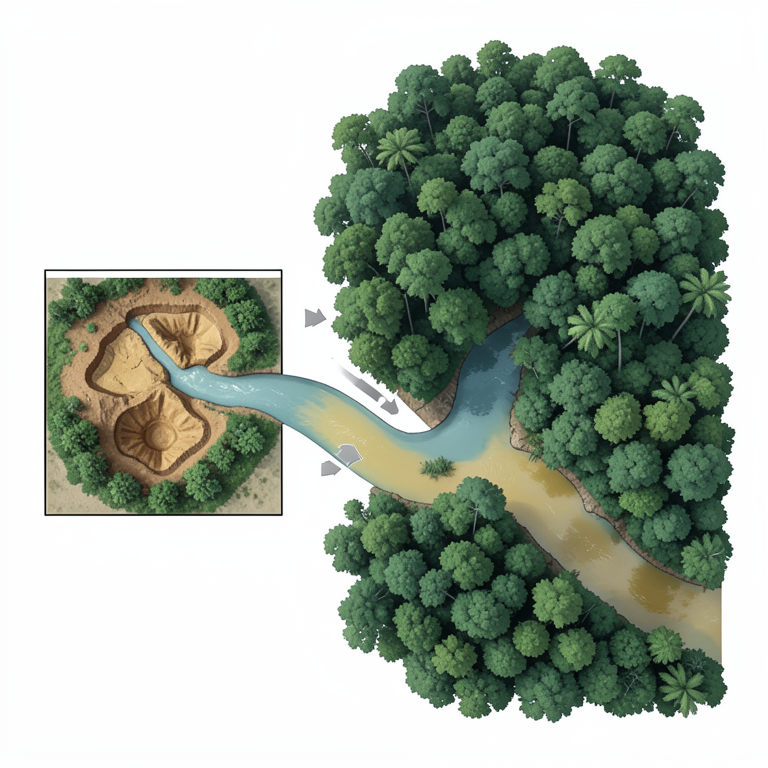
Mercury Risk Flow
AI-generated conceptual illustration (Artisanal gold mining sites and river networks in the Guiana Shield rainforest). It explains the idea and does not show study data.
View source evidence ↗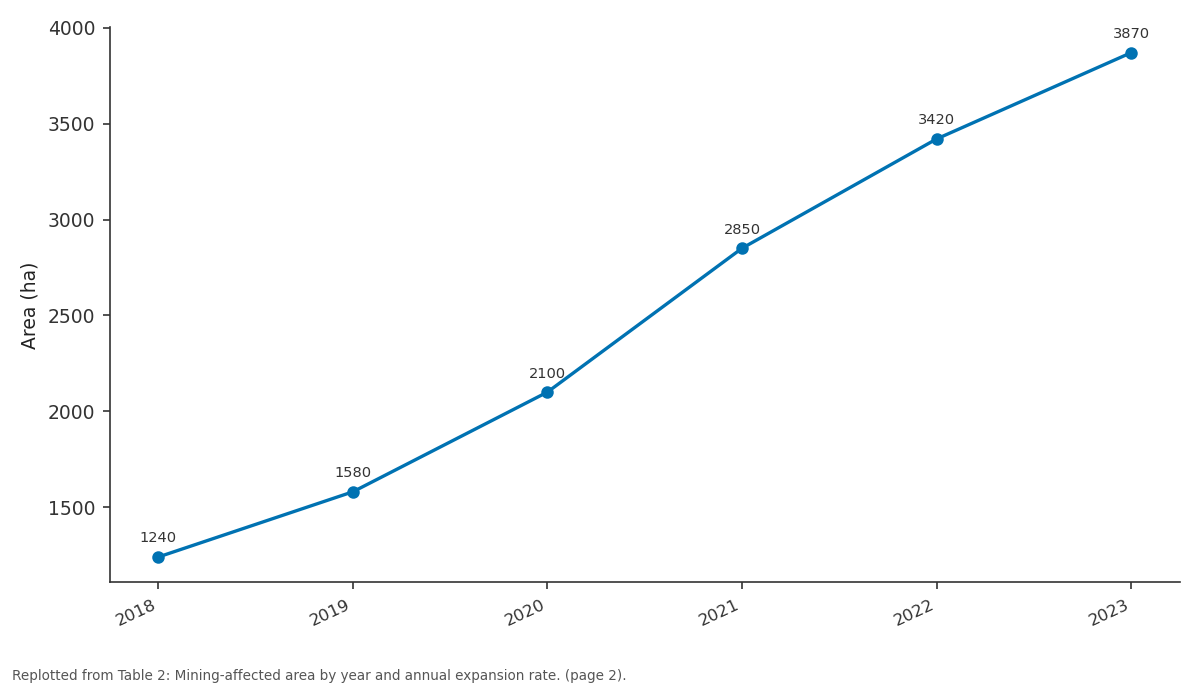
Area (ha): 2018 vs 2019 vs 2020 vs 2021 vs 2022
Replotted from Table 2 (page 2) of the original paper. Every bar is the paper's own table value.
View source evidence ↗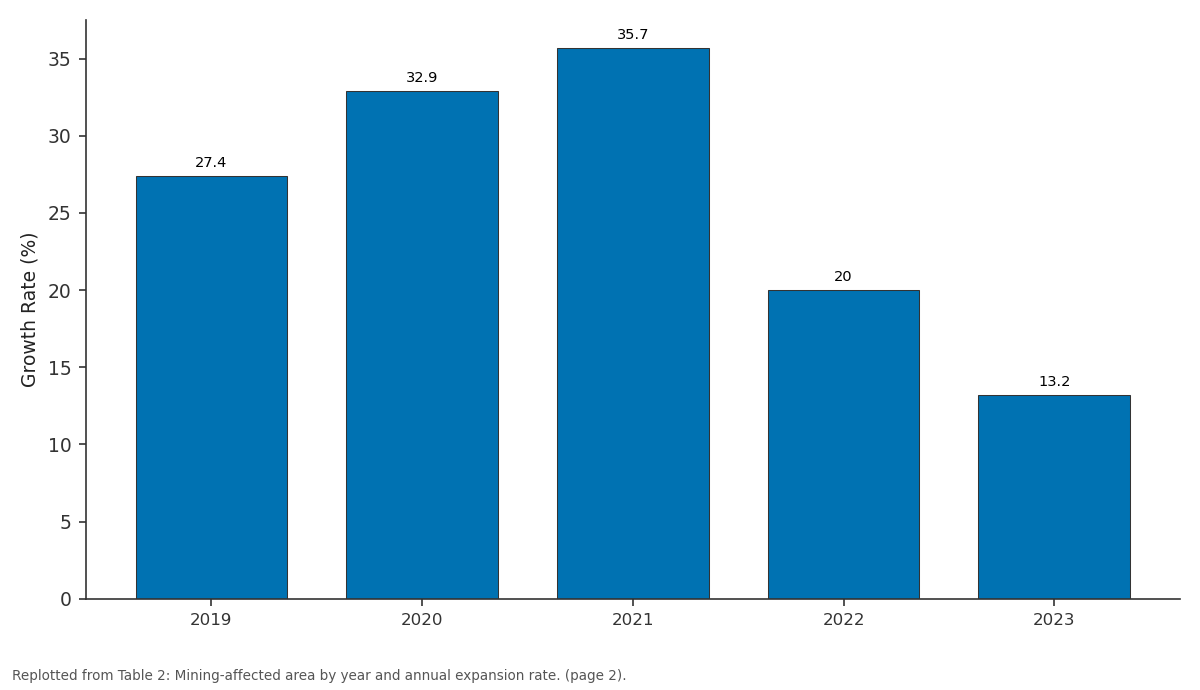
Growth Rate (%) /: 2019 vs 2020 vs 2021 vs 2022 vs 2023
Replotted from Table 2 (page 2) of the original paper. Every bar is the paper's own table value.
View source evidence ↗Figures & tables
From the original paper Table 1
 Table 2
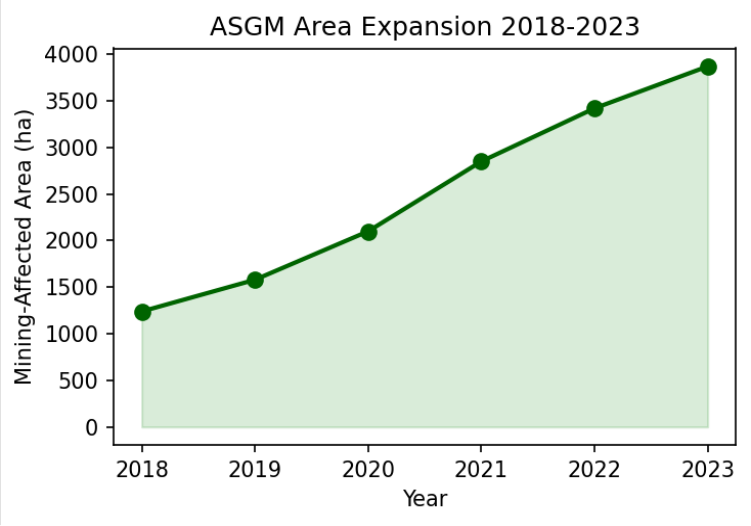 Figure 1
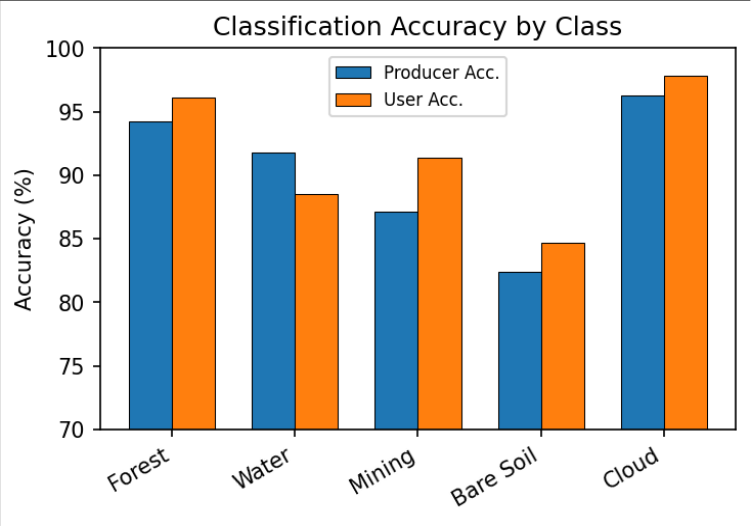 Figure 2
Introduction
The Guiana Shield, a Precambrian geological formation spanning Venezuela, Guyana, Suriname, French Guiana, and northern Brazil, hosts extensive gold mineralisation associated with greenstone belt sequences that have attracted mining for centuries [1] . While industrial operations have been present since the colonial era, ASGM has experienced unprecedented growth since the early 2000s, driven by sustained gold price increases and economic marginalisation of rural and indigenous communities. Current estimates suggest ASGM employs over 500,000 individuals across the region, producing 15-25 tonnes of gold annually through largely informal channels [2] . The environmental consequences of ASGM in tropical forests are severe and multifaceted. Mining involves clearing vegetation, removing topsoil, and processing gold-bearing materials using mercury amalgamation. Deforestation eliminates habitat and carbon storage capacity, sediment mobilisation degrades aquatic ecosystems and impairs water quality, and mercury release contaminates food webs with persistent neurotoxic pollutants [3] . The cumulative footprint of thousands of individual operations creates environmental damage disproportionate to the modest economic returns generated [4] . Remote sensing offers significant potential for monitoring ASGM across inaccessible areas. Previous research demonstrated the utility of Landsat and MODIS for broad-scale deforestation mapping [5] , but their coarse spatial resolution limits detection of small-scale operations. The Sentinel-2 constellation, providing free multispectral imagery at 10 m resolution with five-day revisit frequency, creates new opportunities for detailed ASGM mapping [6] . Google Earth Engine provides the cloud computing platform necessary to process multi-temporal composites across large areas efficiently [7] . This research aims to exploit Sentinel-2 to produce comprehensive ASGM extent maps across the Guiana Shield and quantify expansion from 2018 to 2023. The objectives are to develop a robust classification methodology, characterise spatial and temporal mining dynamics, and delineate mercury contamination risk zones based on hydrological connectivity to support evidence-based regulatory decisions [8] .
Research Area Description
The research area encompasses approximately 45,000 km² within the central Guiana Shield, spanning the Suriname-French Guiana border region. The terrain comprises lowrelief uplands covered by dense tropical rainforest, dissected by numerous rivers and streams serving as access routes and alluvial gold sources. Elevation ranges from 20 to 800 m above sea level, with annual precipitation of 2,200-2,800 mm. The area contains a high density of both legal and illegal ASGM operations and exhibits a range of mining intensities from recent small clearings to extensively degraded landscapes [1,2] .
Materials and Methods Materials
Sentinel-2 Level-2A surface reflectance products were acquired from the Copernicus Open Access Hub for January 2018 to December 2023. Persistent cloud cover necessitated pixel-based compositing to generate annual cloud-free mosaics using median reflectance across all cloud-free observations per year. Training data were collected through visual interpretation of very high-resolution imagery in Google Earth Pro, supplemented by field observations from previous surveys. A total of 2,400 training polygons were digitised across five land cover classes: forest, water, mining, bare soil, and cloud shadow [6,7] .
Methods
Methods
Spectral features included reflectance in all thirteen
Sentinel-2 bands. Vegetation indices comprised NDVI, EVI, and NDWI. Textural features from GLCM on the NIR band at 7×7 pixels included contrast, homogeneity, entropy, and angular second moment. Classification used Random Forest with 500 trees in Google Earth Engine [7] . Accuracy was assessed using 850 stratified random reference points. Multi-temporal change detection compared annual classified maps, supplemented by spectral change vector analysis to detect subtle transitions [5,9] .
Mercury Risk Zone Delineation
Contamination risk zones were computed by downstream flow accumulation from identified mining sites using a hydrologically corrected SRTM digital elevation model at 30 m resolution. Stream reaches within 25 km downstream of active operations were classified as high risk. Spatial intersection with protected area and indigenous territory boundaries quantified the exposure of vulnerable populations to mercury through fish consumption pathways, the primary route of human exposure in Amazonian communities [3,10] . Total mining-affected area increased 212% over the research period (Figure 1), with peak expansion during 2020-2021 coinciding with elevated gold prices and reduced enforcement during the pandemic. The spatial pattern showed frontier advancement along previously undisturbed interior tributaries.
Results
Results
Comprehensive Interpretation
All diagnostic indicators classification accuracy, temporal trends, spatial pattern analysis, and mercury risk modelling converged on a picture of rapid, frontier-driven ASGM expansion with significant downstream environmental consequences affecting protected areas and indigenous communities across the research area.
Discussion
The 89.3% overall accuracy demonstrates that Sentinel-2 provides a cost-effective platform for ASGM monitoring at resolutions sufficient to detect individual clearings [6] . The five-day revisit frequency enables near real-time detection critical for enforcement agencies responding to illegal operations in remote areas. The classification methodology developed here could be implemented as an operational monitoring system providing regular updates on mining extent [7,9] . The 212% expansion and frontier advancement pattern suggest continued encroachment unless effective deterrents are implemented. The mercury risk assessment identified 2,300 km of high-risk stream length intersecting protected areas, raising serious public health concerns [3,10] . A limitation is the inability to detect mining beneath persistent cloud cover; integration of Sentinel-1 SAR data could address this gap [11] . Future work should also explore deep learning algorithms and time-series analysis for improved change detection sensitivity [12,13,14] .
Conclusion
Conclusion
Acknowledgement
Acknowledgements Funding Sources
Figures and tables from the paper
| Class | Producer Acc. (%) | User Acc. (%) | F1 Score |
|---|---|---|---|
| Forest | 94.2 | 96.1 | 0.95 |
| Water | 91.8 | 88.5 | 0.90 |
| Mining | 87.1 | 91.4 | 0.89 |
| Bare Soil | 82.4 | 84.7 | 0.84 |
| Cloud/Shadow | 96.3 | 97.8 | 0.97 |
Table text extracted from the original PDF; superscript letters are shown inline. The original table image is below.
View original table image
| Year | Area (ha) | Annual Change (ha) | Growth Rate (%) |
|---|---|---|---|
| 2018 | 1,240 | — | — |
| 2019 | 1,580 | 340 | 27.4 |
| 2020 | 2,100 | 520 | 32.9 |
| 2021 | 2,850 | 750 | 35.7 |
| 2022 | 3,420 | 570 | 20.0 |
| 2023 | 3,870 | 450 | 13.2 |
Table text extracted from the original PDF; superscript letters are shown inline. The original table image is below.
View original table image
References
17 in the original paper- Hammond DS, Gond V, de Thoisy B, Forget PM, De Dijn BPE. Causes and consequences of a tropical forest gold rush. Ambio. 2007;36(8):661-670.
- Rahm M, Jullian B, Lauber A, et al. Monitoring gold mining impact on forest cover in the Guiana Shield. Reference Module in Earth Systems and Environmental Sciences. 2015:1-13.
- Mol JH, Ouboter PE. Downstream effects of erosion from small-scale gold mining on instream habitat. Conservation Biology. 2004;18(1):201-214.
- Asner GP, Llactayo W, Tupayachi R, Luna ER. Elevated rates of gold mining in the Amazon revealed through high-resolution monitoring. Proceedings of the National Academy of Sciences. 2013;110(46):1845418459.
- Alvarez-Berrios NL, Aide TM. Global demand for gold is another threat for tropical forests. Environmental Research Letters. 2015;10(1):014006.
- Drusch M, Del Bello U, Carlier S, et al. Sentinel-2: ESA optical high-resolution mission for GMES operational services. Remote Sensing of Environment. 2012;120:25-36.
- Gorelick N, Hancher M, Dixon M, et al. Google Earth Engine: planetary-scale geospatial analysis. Remote Sensing of Environment. 2017;202:18-27.
- Telmer KH, Veiga MM. World emissions of mercury from artisanal and small scale gold mining. In: Mercury fate and transport in the global atmosphere. Springer; 2009:131-172.
- Breiman L. Random forests. Machine Learning. 2001;45(1):5-32.
- Berzas Nevado JJ, Rodriguez Martin-Doimeadios RC, Guzman Bernardo FJ, et al. Mercury in the Tapajós River basin, Brazilian Amazon. Environment International. 2010;36(6):593-608.
- Ballère M, Bouvet A, Mermoz S, et al. SAR data for tropical forest disturbance alerts in French Guiana. Remote Sensing of Environment. 2021;252:112159.
- Zhu Z, Woodcock CE. Continuous change detection and classification of land cover using all available Landsat data. Remote Sensing of Environment. 2014;144:152-171.
- Ma L, Liu Y, Zhang X, Ye Y, Yin G, Johnson BA. Deep learning in remote sensing applications: a metaanalysis and review. ISPRS Journal of Photogrammetry and Remote Sensing. 2019;152:166-177.
- Olofsson P, Foody GM, Herold M, Stehman SV, Woodcock CE, Wulder MA. Good practices for estimating area and assessing accuracy of land change. Remote Sensing of Environment. 2014;148:42-57.
- Swenson JJ, Carter CE, Domec JC, Delgado CI. Gold mining in the Peruvian Amazon. PLoS ONE. 2011;6(4):e18875.
- Lobo FL, Costa MPF, Novo EMLM. Time-series analysis of Landsat images over Amazonian waters. Remote Sensing of Environment. 2015;157:170-184.
- Siqueira-Gay J, Soares-Filho B, Sanchez LE, et al. Pathways for ecology in the mining sector. Nature Sustainability. 2020;3(10):784-791.