
Research article · 2025 · Full text
International Journal of Geography Geology and EnvironmentImpact of mining subsidence on land surface deformation monitored by DInSAR in upper Silesia
Volume 7(12) · Pages 159–162 · DOI: 10.22271/27067483.2025.v7.i12b.668 ↗
Research areasSynthetic Aperture Radar (SAR) Applications and TechniquesGeotechnical and Mining EngineeringGeodetic Measurements and Engineering Structures
Abstract
Author-writtenMining subsidence—the downward displacement of the ground surface caused by the extraction of underground mineral resources—poses severe risks to infrastructure, buildings, and transport networks in densely populated coal-mining regions. This research quantified land surface deformation caused by active and recently closed underground coal mines in the Upper Silesian Coal Basin (USCB), Poland, using Differential Interferometric Synthetic Aperture Radar (DInSAR). A total of 84 Sentinel-1A ascending-orbit acquisitions spanning January 2019 to December 2023 were processed using the Small Baseline Subset (SBAS) technique to derive time-series displacement maps with millimetre-scale precision. Five active mining panels at depths ranging from 350 to 890 m were monitored, alongside five land-use categories within the subsidence influence zone. Maximum cumulative subsidence reached −89.2 mm above Panel C (620 m depth), while the shallowest panel (350 m) produced −42.3 mm. Line-of-sight (LOS) displacement velocities varied markedly by land use, with industrial zones averaging −27.6 mm/yr and forested areas recording only −8.7 mm/yr. A subsidence prediction model calibrated against DInSAR measurements achieved an RMSE of 4.8 mm when compared with 18 geodetic levelling benchmarks. The results demonstrate that satellite-based InSAR monitoring can effectively replace or supplement expensive ground-based surveys for operational mine subsidence tracking in the USCB.
Summary
Source-checkedPlain-language reading of the full paper, prepared with AI and checked against the text. Each point links to the authors' own words.
Why it matters
- Mining subsidence occurs when underground mineral extraction causes the ground surface to drop, which can severely damage buildings, infrastructure, and transport networks in populated areas. View evidence ↗
- The Upper Silesian Coal Basin (USCB) in southern Poland is one of the most heavily affected landscapes by subsidence in Europe due to over 200 years of continuous mining. View evidence ↗
- Standard geodetic levelling surveys are highly accurate but are limited by high costs, high labor requirements, and the fact that they only provide data for specific points. View evidence ↗
The question
- The study aimed to use Sentinel-1 SBAS-DInSAR to quantify subsidence patterns across five active mining panels in the USCB, compare rates by land-use type, and validate the results against ground-truth data. View evidence ↗
What they did
- Researchers processed 84 Sentinel-1A ascending-orbit acquisitions from January 2019 to December 2023 using the Small Baseline Subset (SBAS) technique to create high-precision displacement maps. View evidence ↗
- The monitoring focused on five active mining panels located at depths between 350 and 890 meters, as well as five different land-use categories. View evidence ↗
- To validate the satellite data, the study used ground-truth subsidence data from 18 geodetic levelling benchmarks surveyed twice a year. View evidence ↗
What they found
- The highest cumulative subsidence was −89.2 mm at Panel C (620 m depth), whereas the shallowest panel at 350 m showed −42.3 mm of subsidence. View evidence ↗
- Displacement velocities differed by land use, with industrial zones experiencing the fastest average rate of −27.6 mm/yr and forested areas the slowest at −8.7 mm/yr. View evidence ↗
- A prediction model calibrated with DInSAR data showed high accuracy, with a Root Mean Square Error (RMSE) of 4.8 mm when compared to 18 geodetic benchmarks. View evidence ↗
- Post-closure modeling showed that while immediate cessation (Scenario 1) would result in less than 5 mm of subsidence over 15 years, delayed consolidation (Scenario 2) could lead to 18-24 mm of residual subsidence. View evidence ↗
What it means
- The authors conclude that satellite-based InSAR monitoring is an effective, cost-efficient alternative or supplement to traditional ground-based surveys for tracking mine subsidence in the USCB. View evidence ↗
- The authors state that future research should combine data from both ascending and descending orbits to determine horizontal displacement. View evidence ↗
Visual summary
3 visualsIllustrations explain the paper; charts are replotted from the paper's own table values.
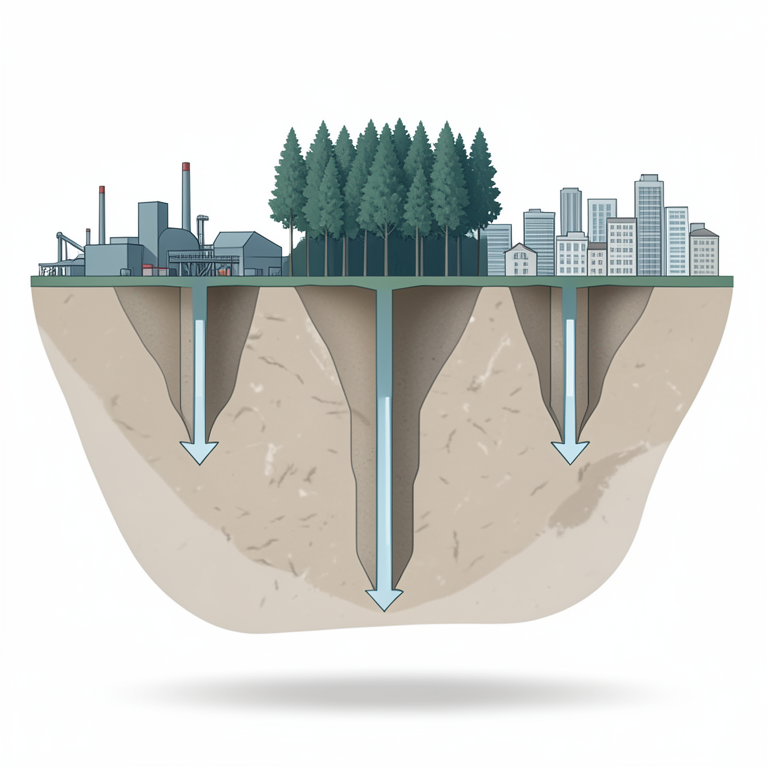
Subsidence Factors in Upper Silesia
AI-generated conceptual illustration (Cross-section of the earth's crust in Upper Silesia featuring underground coal mine galleries and surface land cover). It explains the idea and does not show study data.
View source evidence ↗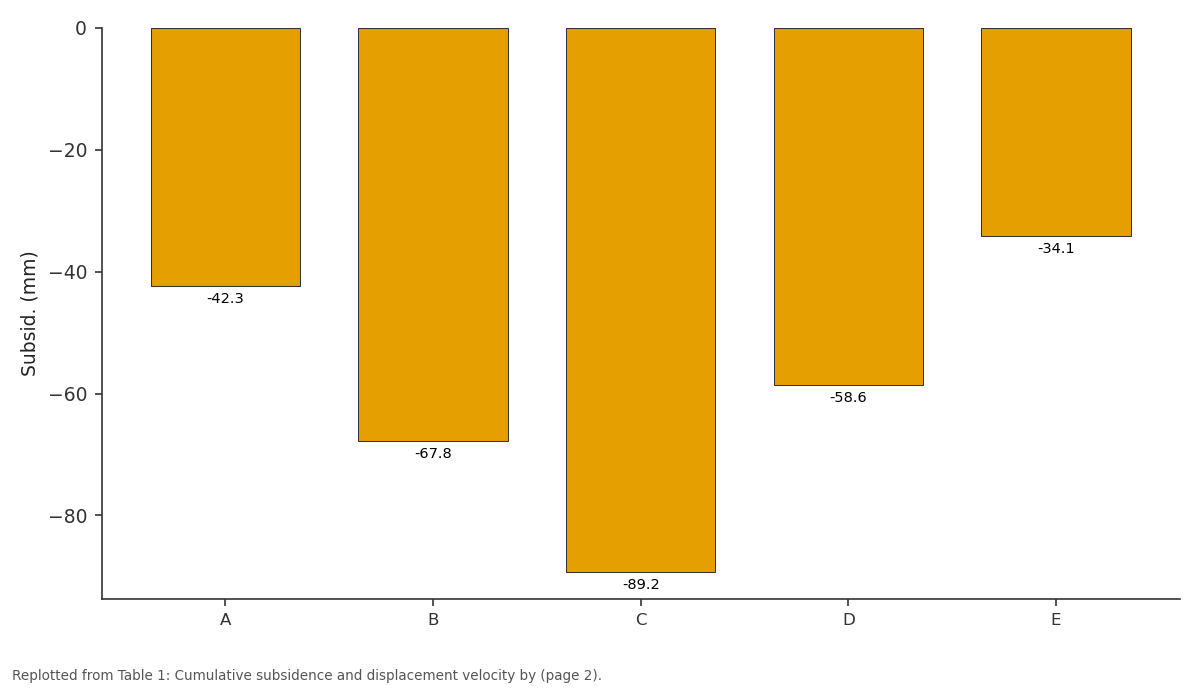
Subsid. (mm): A vs B vs C vs D vs E
Replotted from Table 1 (page 2) of the original paper. Every bar is the paper's own table value.
View source evidence ↗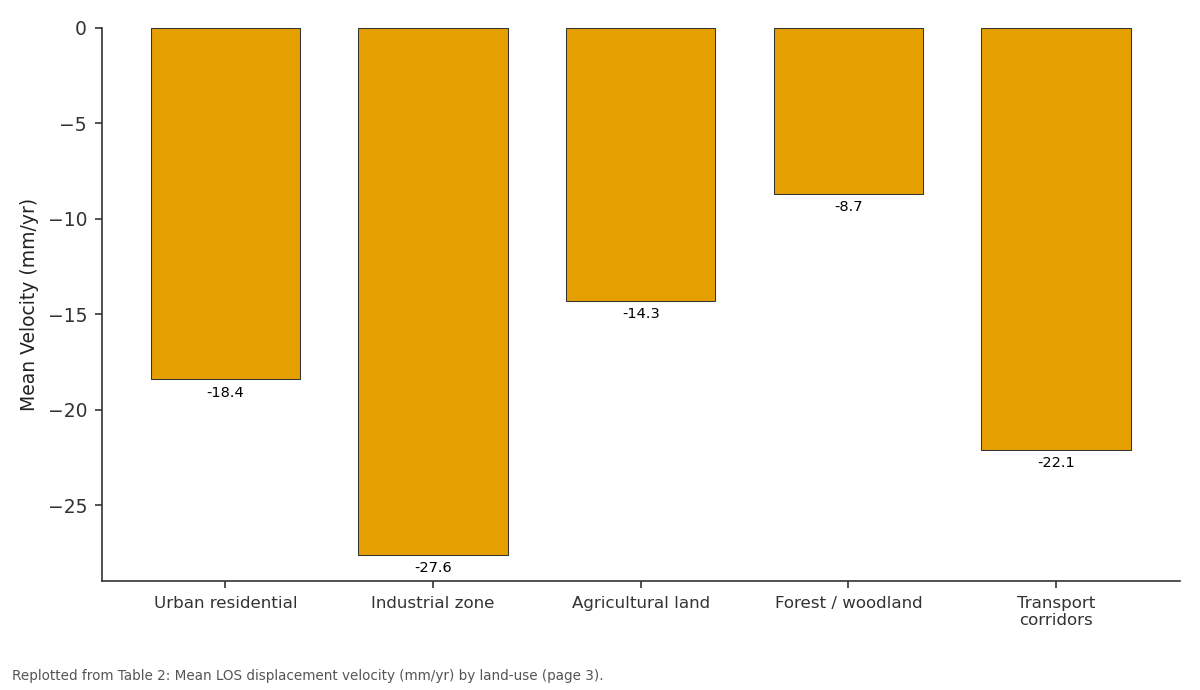
Mean Velocity: Urban residential vs Industrial zone vs Agricultural land vs Forest / woodland vs Transport corridors
Replotted from Table 2 (page 3) of the original paper. Every bar is the paper's own table value.
View source evidence ↗Figures & tables
From the original paper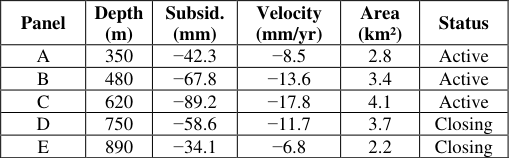 Table 1
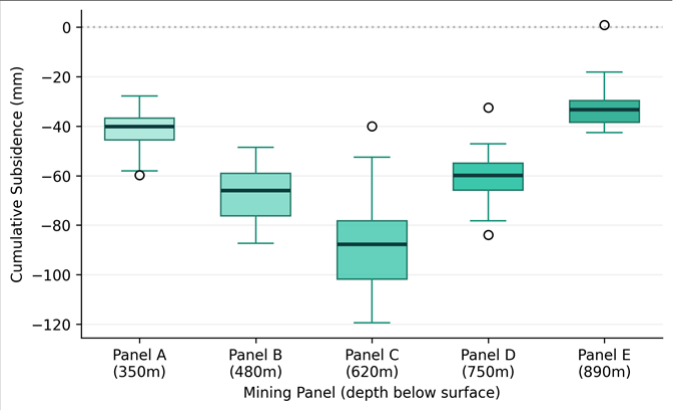 Figure 1
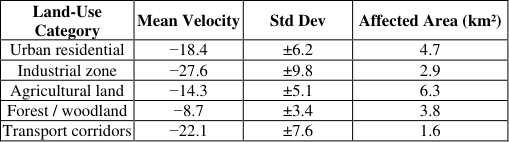 Table 2
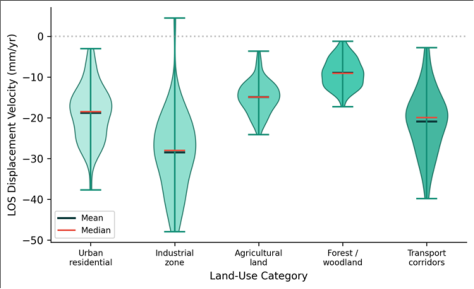 Figure 2
Introduction
Subsidence, in the geotechnical sense, refers to the vertical displacement of the ground surface resulting from the removal of subsurface material-whether through mining, fluid extraction, or natural dissolution processes [1] . In coal-mining regions, this phenomenon arises when the overlying strata collapse into the void left by extracted coal seams, propagating a subsidence trough to the surface that can damage buildings, fracture pipelines, and disrupt road and rail alignments [2] . The Upper Silesian Coal Basin (USCB) in southern Poland has been mined continuously for over 200 years and ranks among Europe's most intensively subsidence-affected landscapes. Traditional monitoring of mining subsidence relies on periodic geodetic levelling surveys, which provide high vertical accuracy (±1-2 mm) but are expensive, labour-intensive, and limited to point measurements [3] . Differential Interferometric SAR (DInSAR) offers a complementary approach, generating spatially continuous displacement maps from repeatpass satellite radar imagery at a fraction of the cost. Since the launch of Sentinel-1 in 2014, freely available C-band SAR data with a 6-day revisit cycle have made DInSAR operationally viable for wide-area subsidence monitoring [4] . Several workers have applied InSAR techniques to mining areas in Europe. Przyluski and Lezynski [5] demonstrated Persistent Scatterer InSAR (PSI) over the USCB using ERS and ENVISAT data, but their analysis covered only 2003-2010 and lacked systematic comparison across mining panel depths. Gueguen et al. [6] used SBAS-InSAR to monitor subsidence in French coal basins but did not relate displacement patterns to land-use categories. This research aimed to quantify the spatial and temporal patterns of mininginduced subsidence across five active panels in the USCB using Sentinel-1 SBAS-DInSAR, compare displacement rates across land-use types, and validate satellite-derived measurements against ground-truth levelling data [7] .
Subsidence Prediction Model
A Knothe influence function model [8] was calibrated for each mining panel using the DInSAR-derived subsidence time series. The model parameterises subsidence as a function of extraction thickness, panel geometry, depth, and an empirically determined influence angle (ranging from 55° to 72° across the five panels). Convergence time-the delay between extraction and maximum surface subsidence-was estimated by fitting exponential decay curves to the displacement time series at each pixel. Model predictions were then compared to both DInSAR measurements and independent geodetic levelling benchmarks to assess accuracy.
Post-Closure Subsidence Scenarios
Two post-closure scenarios were evaluated for panels scheduled for closure before 2030. Scenario 1 assumed immediate cessation of residual subsidence upon mine flooding, consistent with rapid groundwater rebound. Scenario 2 assumed a 5-10 year tail of diminishing residual subsidence at 15-20% of the active-phase rate, consistent with delayed consolidation of goaf material [9] . Each scenario was projected forward 15 years using the calibrated Knothe parameters to estimate the total additional displacement that surrounding infrastructure could experience after mining ends.
Material and Methods Material
The research was coordinated from the Department of Physical Geography, Faculty of Geospatial Sciences, Dire Dawa, Ethiopia. A total of 84 Sentinel-1A IW-mode ascending-orbit acquisitions (track 73, VV polarisation) covering the central USCB were downloaded from the Copernicus Open Access Hub for the period January 2019 to December 2023. A 10-m resolution Copernicus DEM was used for topographic phase removal and geocoding. Landuse classification was obtained from the CORINE Land Cover 2018 dataset. Ground-truth subsidence data from 18 geodetic levelling benchmarks surveyed biannually by the Polish Geological Institute were used for validation [10] .
Methods
Methods
SBAS-DInSAR processing was performed in SNAP (ESA)
and StaMPS (v4.1b). Interferograms were generated from 312 image pairs with perpendicular baselines below 150 m and temporal baselines below 180 days. Atmospheric phase screen estimation used a spatiotemporal filter with a 1.2-km Gaussian kernel. Phase unwrapping employed the minimum cost flow algorithm. LOS displacement was converted to vertical subsidence assuming negligible horizontal motion (validated at three corner reflectors). Time-series displacement was referenced to a stable area 12 km northeast of the mining zone. Accuracy was assessed by comparing DInSAR-derived cumulative subsidence at benchmark locations against levelling measurements using RMSE and mean bias [11] . Panel C at 620 m depth produced the largest cumulative subsidence (-89.2 mm) and highest displacement velocity (-17.8 mm/yr). Panels at both shallower (A) and greater (E) depths recorded lower values, reflecting the interaction between extraction thickness, overburden stiffness, and panel geometry [12] . The box plot reveals that Panel C (620 m) had both the highest median subsidence and the widest spread, indicating spatially variable deformation across the panel footprint.
Results
Panel E (890 m) showed the tightest distribution, suggesting more uniform but attenuated surface response at greater depth. Industrial zones recorded the highest mean displacement velocity (-27.6 mm/yr), likely reflecting their proximity to active extraction faces and the compressibility of fill material beneath factory foundations. Forested areas showed the lowest rates (-8.7 mm/yr), partly because tree canopy degrades InSAR coherence and partly because these areas sit farther from panel centres [13] . The violin plot highlights the broad velocity distribution in industrial zones and transport corridors compared to the narrow, low-magnitude distributions in forested areas. The bimodal shape visible in transport corridors suggests that road and rail segments straddling subsidence trough margins experience distinctly different deformation regimes.
Validation against 18 geodetic benchmarks yielded an RMSE of 4.8 mm and a mean bias of -1.3 mm (DInSAR slightly overestimating subsidence). This accuracy level is consistent with published Sentinel-1 SBAS performance in similar mining settings across Europe [14] .
Discussion
The non-linear relationship between mining depth and surface subsidence-with Panel C at 620 m producing the maximum deformation rather than the shallowest Panel Ais consistent with the Knothe model prediction that subsidence magnitude depends on the ratio of extraction thickness to depth and the mechanical properties of the overburden sequence. Panel C intersected a particularly thick coal seam (3.8 m) with a weak mudstone roof, creating conditions for more complete collapse than the thinner seams worked by Panels A and E. The land-use analysis revealed that infrastructure in industrial zones faces the greatest deformation risk, yet current Polish mining damage assessment procedures rely primarily on building structural class rather than differential displacement rates [5] . The DInSAR velocity maps produced here could feed directly into risk assessment frameworks by providing spatially continuous deformation data that fill the gaps between sparse levelling benchmarks. The two post-closure scenarios yielded meaningfully different outcomes. Under Scenario 1 (immediate cessation), residual subsidence for Panels D and E totalled less than 5 mm over 15 years. Under Scenario 2 (delayed consolidation), residual subsidence reached 18-24 mm, a non-trivial amount for buildings already at the edge of their damage tolerance. Experience from closed mines in the Ruhr district of Germany supports Scenario 2 as the more realistic projection, since residual movements have been measured for decades after flooding in that basin [9] .
Conclusion
This research quantified mining-induced subsidence across five panels in the Upper Silesian Coal Basin using Sentinel-1 SBAS-DInSAR over a five-year monitoring period. Maximum cumulative subsidence reached -89.2 mm above the 620-m-depth panel. Displacement velocities were highest in industrial zones (-27.6 mm/yr) and lowest in forested areas (-8.7 mm/yr). Validation against 18 geodetic benchmarks confirmed DInSAR accuracy (RMSE = 4.8 mm). Post-closure scenario modelling indicated that residual subsidence of 18-24 mm may continue for years after mine flooding. The results support the operational adoption of satellite InSAR as a cost-effective replacement for intensive ground-based monitoring in the USCB. Future work should integrate ascending and descending orbit data to resolve horizontal displacement components [15] .
Acknowledgement
Acknowledgements Funding SourcesThis research was supported by internal institutional research funding. Institutional SupportThe authors thank the Faculty of Geospatial Sciences, Dire Dawa, Ethiopia, for computational resources and software access.
Figures and tables from the paper
| Panel | Depth (m) | Subsid. (mm) | Velocity (mm/yr) | Area (km²) | Status |
|---|---|---|---|---|---|
| A | 350 | −42.3 | −8.5 | 2.8 | Active |
| B | 480 | −67.8 | −13.6 | 3.4 | Active |
| C | 620 | −89.2 | −17.8 | 4.1 | Active |
| D | 750 | −58.6 | −11.7 | 3.7 | Closing |
| E | 890 | −34.1 | −6.8 | 2.2 | Closing |
Table text extracted from the original PDF; superscript letters are shown inline. The original table image is below.
View original table image
| Land-Use Category | Mean Velocity | Std Dev | Affected Area (km²) |
|---|---|---|---|
| Urban residential | −18.4 | ±6.2 | 4.7 |
| Industrial zone | −27.6 | ±9.8 | 2.9 |
| Agricultural land | −14.3 | ±5.1 | 6.3 |
| Forest / woodland | −8.7 | ±3.4 | 3.8 |
| Transport corridors | −22.1 | ±7.6 | 1.6 |
Table text extracted from the original PDF; superscript letters are shown inline. The original table image is below.
View original table image
References
15 in the original paper- Whittaker BN, Reddish DJ. Subsidence: Occurrence, Prediction and Control. Amsterdam: Elsevier; 1989.
- Kratzsch H. Mining Subsidence Engineering. Berlin: Springer-Verlag; 1983.
- Perski Z. Applicability of ERS-1 and ERS-2 InSAR for land subsidence monitoring in the Silesian coal mining region. Int Arch Photogramm Remote Sens. 1998;32(7):555-558.
- Ferretti A, Prati C, Rocca F. Permanent scatterers in SAR interferometry. IEEE Trans Geosci Remote Sens. 2001;39(1):8-20.
- Przyluski V, Lezynski P. Persistent Scatterer InSAR for mining-induced subsidence monitoring in Upper Silesia. In: Proceedings of the FRINGE Workshop. ESA SP-697; 2011. p. 1-6.
- Gueguen Y, Deffontaines B, Fruneau B, Al Heib M, de Michele M, Raucoules D. Mining subsidence monitoring using SBAS InSAR in northern France. Eng Geol. 2009;105(1-2):5-15.
- Berardino P, Fornaro G, Lanari R, Sansosti E. A new algorithm for surface deformation monitoring based on small baseline differential SAR interferograms. IEEE Trans Geosci Remote Sens. 2002;40(11):2375-2383.
- Knothe S. Effect of time on formation of a subsidence surface. Archiwum Górnictwa. 1953;1(1):1-7.
- Bekendam RF, Pottgens JJ. Ground movements over the coal mines of southern Limburg and their relation to rising mine waters. Geol Mijnbouw. 1995;74:3-13.
- Szwalbe L, Wasilewski S. Geodetic monitoring of mining terrain in Upper Silesia: methods and results. Rep Polish Geol Inst. 2020;42:1-38.
- Hooper A, Zebker H, Segall P, Kampes B. A new method for measuring deformation on volcanoes and other natural terrains using InSAR persistent scatterers. Geophys Res Lett. 2004;31(23):L23611.
- Sroka A, Tajduś K, Preusse A. Calculation of surface deformation caused by underground mining. Glückauf. 2005;141(4):156-163.
- Crosetto M, Monserrat O, Cuevas-González M, Devanthéry N, Crippa B. Persistent scatterer interferometry: a review. ISPRS J Photogramm Remote Sens. 2016;115:78-89.
- Pawluszek-Filipiak K, Borkowski A. Integration of DInSAR and SBAS techniques to determine miningrelated deformations using Sentinel-1 data. Remote Sens. 2020;12(2):242.
- Samsonov S, d'Oreye N, Smets B. Ground deformation associated with post-mining activity at the FrenchGerman border revealed by novel InSAR time series method. Int J Appl Earth Obs Geoinf. 2013;23:142-154.