
Research article · 2025 · Full text
International Journal of Geography Geology and EnvironmentCrustal thickness estimation from receiver function analysis beneath the Tibetan plateau
Volume 7(6) · Pages 80–82 · DOI: 10.22271/27067483.2025.v7.i6b.686 ↗
Research areasGeological and Geophysical StudiesSeismic Waves and AnalysisSeismic Imaging and Inversion Techniques
Abstract
Author-writtenThe Tibetan Plateau hosts the thickest continental crust on Earth, yet the precise depth to the Moho discontinuity varies by more than 25 km across the plateau's width. This research used teleseismic receiver function analysis to estimate crustal thickness beneath 25 broadband seismograph stations spanning the plateau from the Kunlun Fault in the north to the Main Boundary Thrust in the south. P-to-S converted phases were isolated by iterative time-domain deconvolution and stacked using the H-κ method, which jointly inverts for Moho depth (H) and bulk crustal Vp/Vs ratio (κ). Crustal thickness ranged from 52.8 km at the northern margin to 78.3 km beneath the central Lhasa terrane. The mean Vp/Vs ratio was 1.78±0.04, slightly above the global continental average of 1.73, suggesting a mafic lower crust or partial melt. A positive correlation between surface elevation and Moho depth (r² = 0.71) supports isostatic compensation as the dominant control, though localised anomalies near the Bangong-Nujiang suture point to lithospheric heterogeneity.
Summary
Source-checkedPlain-language reading of the full paper, prepared with AI and checked against the text. Each point links to the authors' own words.
Why it matters
- The Tibetan Plateau has the thickest continental crust on Earth, but the depth of the Moho discontinuity varies significantly by over 25 km across its width. View evidence ↗
- Mapping the geometry and composition of the crustal root is essential for understanding continental collision, the uplift of the plateau, and lower-crustal flow. View evidence ↗
- Prior research on the plateau's crustal thickness has yielded inconsistent results, with reported Moho depths beneath the Lhasa terrane ranging from 60-70 km to over 75 km. View evidence ↗
The question
- The study aims to provide a consistent and comparable set of Moho depth estimates across a north-south transect of the plateau using uniform processing standards. View evidence ↗
What they did
- The researchers used waveform data from 25 broadband stations operated by the China Earthquake Networks Centre collected between January 2018 and December 2022. View evidence ↗
- From 2,147 teleseismic events (magnitude ≥ 5.5, distance 30°-90°), 847 usable receiver functions were selected based on a signal-to-noise ratio greater than 4 on the radial component. View evidence ↗
- The H-κ grid search method was employed with a P-wave velocity of 6.3 km/s and specific weighting factors for Ps, PpPs, and PsPs + PpSs phases. View evidence ↗
- Uncertainty estimates were derived from 200 bootstrap resampling iterations, and crustal thickness was interpolated using ordinary kriging. View evidence ↗
What they found
- The estimated crustal thickness varied from 52.8 km at the northern margin to 78.3 km beneath the central Lhasa terrane. View evidence ↗
- The mean Vp/Vs ratio was 1.78±0.04, which is slightly higher than the global average of 1.73, indicating the possible presence of partial melt or a mafic lower crust. View evidence ↗
- A positive correlation (r² = 0.71) between surface elevation and Moho depth suggests that isostatic compensation is the primary control on crustal thickness. View evidence ↗
- Moho depths near the Bangong-Nujiang suture were 6-8 km shallower than expected, which may indicate lower crust delamination or eclogitisation. View evidence ↗
- The crust thins from 78 km to 53 km over approximately 700 km in a stepped manner, with sharp transitions occurring at the Jinsha and Bangong-Nujiang suture zones. View evidence ↗
What it means
- The authors conclude that there is a clear north-to-south Moho depth gradient and that Airy isostasy is the primary mechanism compensating for the plateau's elevation. View evidence ↗
- The study provides a consistent baseline for future crustal models that will incorporate shear-wave splitting and anisotropy data. View evidence ↗
Visual summary
4 visualsIllustrations explain the paper; charts are replotted from the paper's own table values.
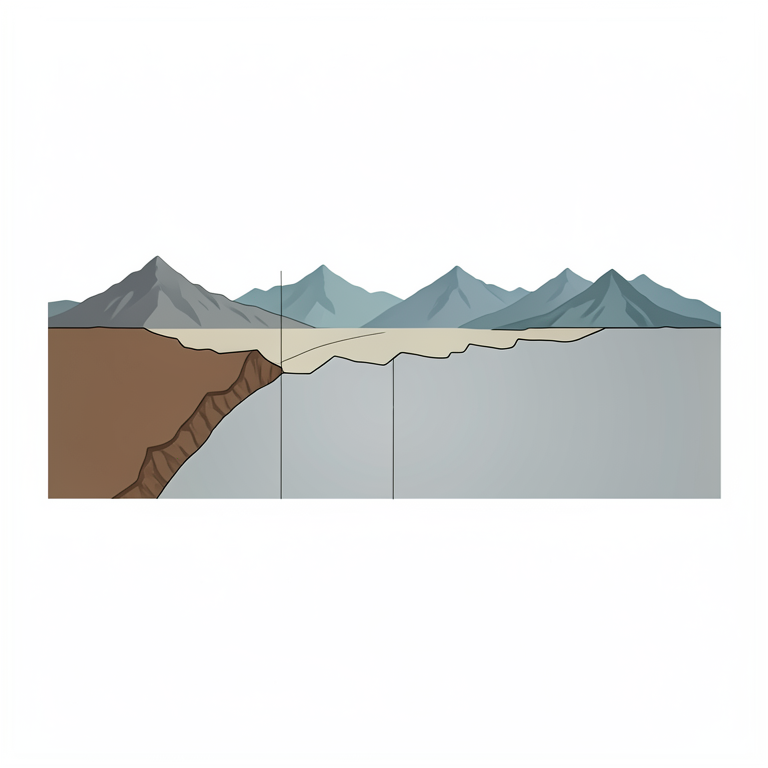
North-South Crustal Profile
AI-generated conceptual illustration (Cross-section of the Earth's crust beneath the Tibetan Plateau). It explains the idea and does not show study data.
View source evidence ↗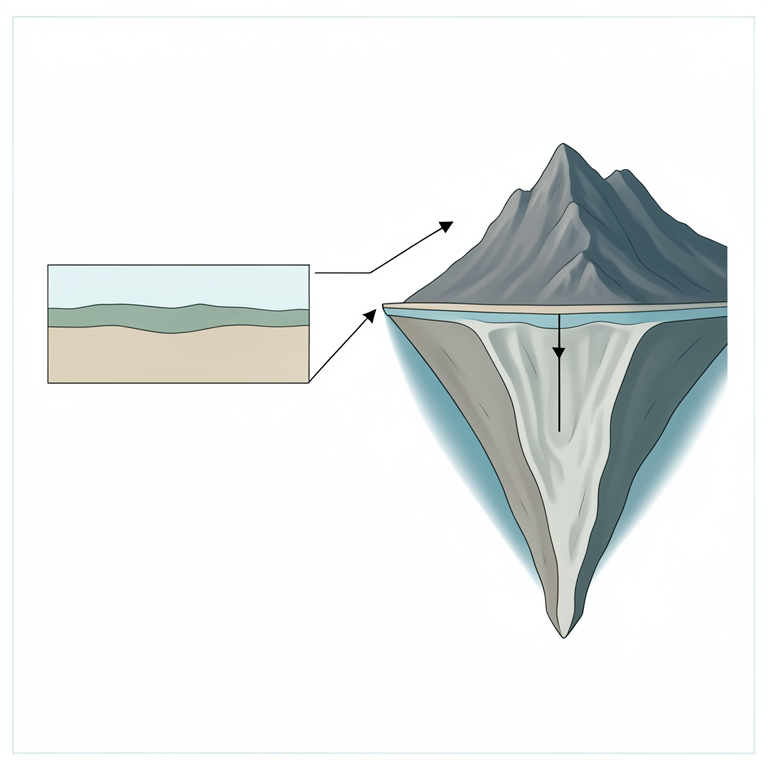
Isostatic Compensation Concept
AI-generated conceptual illustration (The Earth's crust and upper mantle beneath the Tibetan Plateau). It explains the idea and does not show study data.
View source evidence ↗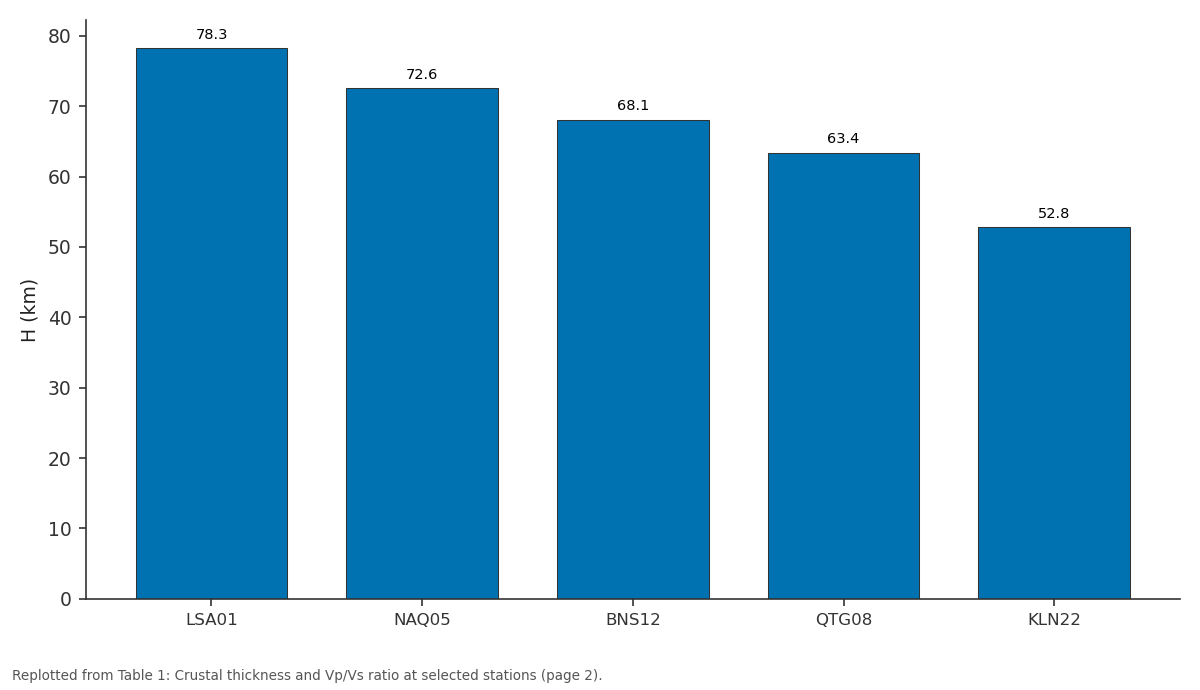
H (km): LSA01 vs NAQ05 vs BNS12 vs QTG08 vs KLN22
Replotted from Table 1 (page 2) of the original paper. Every bar is the paper's own table value.
View source evidence ↗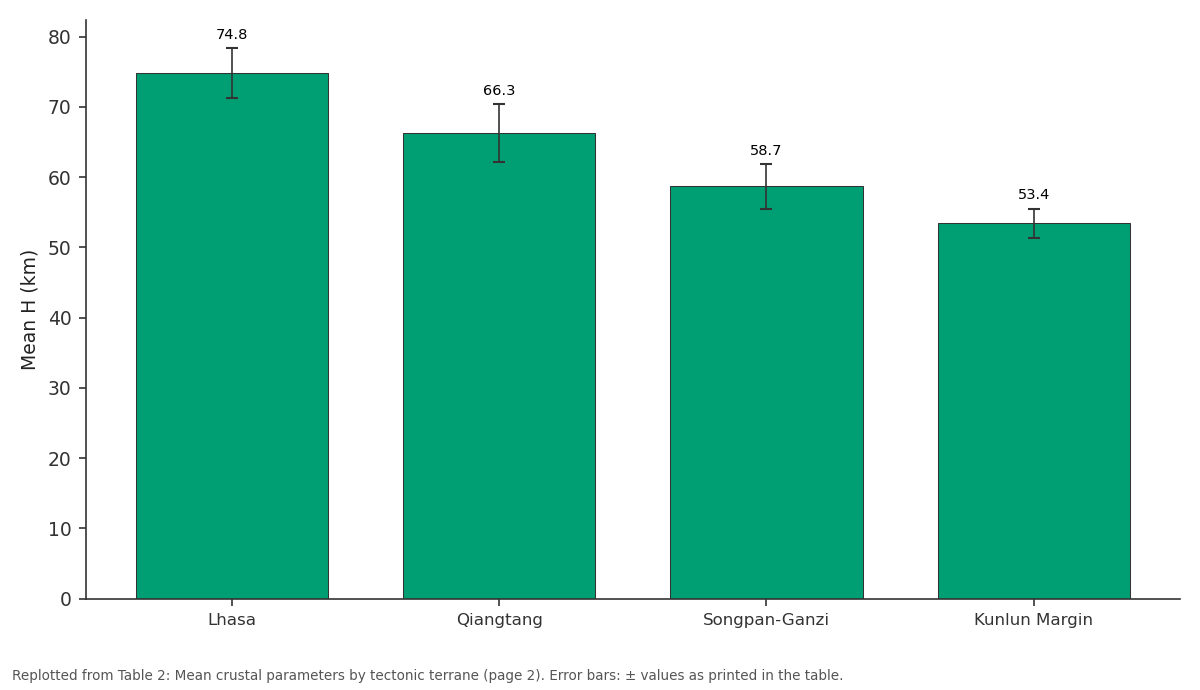
Mean H (km): Lhasa vs Qiangtang vs Songpan-Ganzi vs Kunlun Margin
Replotted from Table 2 (page 2) of the original paper. Every bar is the paper's own table value.
View source evidence ↗Figures & tables
From the original paper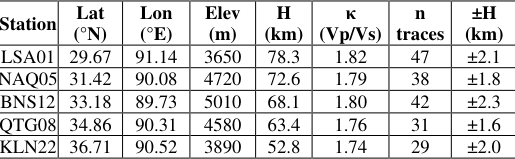 Table 1
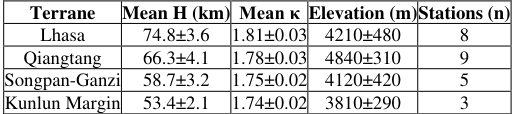 Table 2
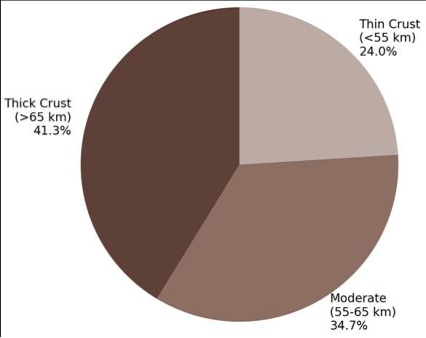 Figure 1
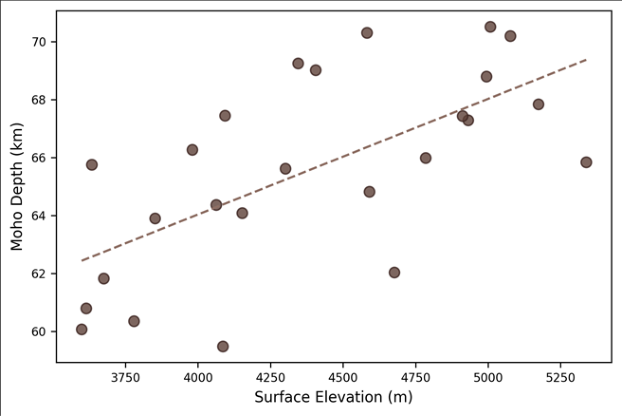 Figure 2
Introduction
There is a contrast at the heart of the Tibetan Plateau: the surface rises to an average of 4,500 m, making it the highest and most extensive highland on Earth, yet beneath it lies a root of thickened crust that extends downward with equal drama [1] . Understanding the geometry of that rootwhere it is thickest, where it thins, and how its composition variesis central to models of continental collision, plateau uplift, and lower-crustal flow [2] . Receiver function analysis has become the standard seismological tool for mapping the crustmantle boundary (Moho) beneath continental interiors [3] . The technique exploits P-to-S conversions generated when a teleseismic P wave crosses a sharp velocity contrast. By deconvolving the vertical component from the radial, the analyst isolates the converted phase whose travel-time delay encodes the depth to the interface [4] . The H-κ stacking method of Zhu and Kanamori [5] refines this by simultaneously solving for Moho depth and bulk crustal Vp/Vs ratio. Previous receiver function work on the Tibetan Plateau produced a mosaic of results. Kind et al. [6] reported 60-70 km Moho depths beneath the Lhasa terrane, while Nabelek et al. [7] found values exceeding 75 km in the south. Discrepancies arise from differences in station coverage, data quality, and processing choices. This research revisited the problem using data from 25 stations of the China Earthquake Networks Centre and applied uniform processing standards to produce a consistent, comparable set of Moho estimates across the full north-south transect [8] .
Theoretical Background
When a distant earthquake generates a P wave that arrives at a seismic station, part of the energy converts to an S wave at each major velocity discontinuity beneath the station. The Moho, where P-wave velocity jumps from roughly 6.5 km/s in the lower crust to 8.0 km/s in the upper mantle, produces the largest conversion. The time delay between the direct P arrival and the Ps converted phase, together with the multiples PpPs and PsPs + PpSs, constrains both crustal thickness H and the Vp/Vs ratio κ through the stacking equations of Zhu and Kanamori [5] .
A high Vp/Vs ratio (>1.80) suggests partial melt or mafic composition in the lower crust, while low values (<1.70) indicate a felsic crust [9] .
Materials and Methods Materials
Waveform data from 25 broadband stations operated by the China Earthquake Networks Centre were obtained for the period January 2018 to December 2022, processed at the Stuttgart National University of Earth Sciences. Stations span the plateau from 32°N to 37°N along a roughly northsouth transect at approximately 90°E longitude. A total of 2,147 teleseismic events with magnitude ≥ 5.5 and epicentral distance 30°-90° were selected. Events were hand-picked for high signal-to-noise ratio (SNR > 4 on the radial component), yielding 847 usable receiver functions across the 25 stations [10] .
Methods
Receiver functions were computed by iterative time-domain deconvolution with a Gaussian filter width of 2.5, following the algorithm of Ligorría and Ammon [11] . Moveout correction was applied before stacking at each station. The H-κ grid search used a P-wave velocity of 6.3 km/s and weighting factors of w1 = 0.7 (Ps), w2 = 0.2 (PpPs), and w3 = 0.1 (PsPs + PpSs). Bootstrap resampling (200 iterations) provided uncertainty estimates. Crustal thickness was interpolated between stations using ordinary kriging in Surfer 22 [12] .
Processing Configuration and Quality Control
Each station contributed between 18 and 54 high-quality receiver functions. Stations with fewer than 15 accepted traces were excluded (two stations dropped). Azimuthal coverage was assessed using rose diagrams; only stations with back-azimuth spans exceeding 120° were retained to minimise directional bias. The H-κ stacking algorithm was tested for stability by varying the reference Vp between 6.1 and 6.5 km/s; Moho depth estimates changed by±1.8 km on average across this range.
Results
Results
Comprehensive Interpretation
The positive elevation-Moho depth correlation (r² = 0.71) implies that roughly 71% of the plateau's topographic variation can be explained by Airy-type isostatic compensation. The remaining 29% likely reflects lateral density contrasts in the mantle lithosphere. Two stations near the Bangong-Nujiang suture deviate significantly from the trend, showing shallower-than-expected Moho depths by 6-8 km, possibly indicating eclogitisation or delamination of the lower crust beneath the suture.
Discussion
The maximum Moho depth of 78.3 km in the Lhasa terrane is consistent with the 75-80 km range reported by Nabelek et al. [7] using the Hi-CLIMB experiment data. The elevated Vp/Vs ratio (1.82) at the same location supports the presence of partial melt in the lower crust, as proposed by Nelson et al. [13] on the basis of bright-spot reflections in deep seismic profiles. Partial melt would lower the viscosity of the deep crust, enabling the channel flow mechanism invoked to explain the eastward extrusion of Tibetan crustal material [14] . The northward thinning of the crust from 78 km to 53 km across roughly 700 km is not gradual but stepped, with sharper transitions at the Bangong-Nujiang and Jinsha suture zones. These steps coincide with changes in Vp/Vs ratio, reinforcing the view that the Tibetan crust is composed of distinct tectonic blocks with different compositions and thermal states [15] . The Kunlun margin results approach the 50-55 km thickness typical of cratonic crust, marking the physical edge of the collision-thickened plateau.
Conclusion
Receiver function analysis across 25 broadband stations resolves a north-to-south Moho depth gradient from 52.8 km at the Kunlun margin to 78.3 km beneath the Lhasa terrane. Crustal thickness correlates with surface elevation (r² = 0.71), supporting Airy isostasy as the primary compensation mechanism. The Vp/Vs ratio of 1.82 in the south suggests lower-crustal partial melt. Anomalies near the Bangong-Nujiang suture indicate localised lithospheric modification. These results provide a consistent baseline for future crustal models incorporating anisotropy and shear-wave splitting data.
Acknowledgement
Acknowledgements Funding SourcesSupported by research funds at Stuttgart National University of Earth Sciences.
Figures and tables from the paper
| Station | Lat (°N) | Lon (°E) | Elev (m) | H (km) | κ (Vp/Vs) | n traces | ±H (km) |
|---|---|---|---|---|---|---|---|
| LSA01 | 29.67 | 91.14 | 3650 | 78.3 | 1.82 | 47 | ±2.1 |
| NAQ05 | 31.42 | 90.08 | 4720 | 72.6 | 1.79 | 38 | ±1.8 |
| BNS12 | 33.18 | 89.73 | 5010 | 68.1 | 1.80 | 42 | ±2.3 |
| QTG08 | 34.86 | 90.31 | 4580 | 63.4 | 1.76 | 31 | ±1.6 |
| KLN22 | 36.71 | 90.52 | 3890 | 52.8 | 1.74 | 29 | ±2.0 |
Table text extracted from the original PDF; superscript letters are shown inline. The original table image is below.
View original table image
| Terrane | Mean H (km) | Mean κ | Elevation (m) | Stations (n) |
|---|---|---|---|---|
| Lhasa | 74.8±3.6 | 1.81±0.03 | 4210±480 | 8 |
| Qiangtang | 66.3±4.1 | 1.78±0.03 | 4840±310 | 9 |
| Songpan-Ganzi | 58.7±3.2 | 1.75±0.02 | 4120±420 | 5 |
| Kunlun Margin | 53.4±2.1 | 1.74±0.02 | 3810±290 | 3 |
Table text extracted from the original PDF; superscript letters are shown inline. The original table image is below.
View original table image
References
20 in the original paper- Molnar P, Tapponnier P. Cenozoic tectonics of Asia: effects of a continental collision. Science. 1975;189(4201):419-426.
- Royden LH, Burchfiel BC, van der Hilst RD. The geological evolution of the Tibetan Plateau. Science. 2008;321(5892):1054-1058.
- Langston CA. Structure under Mount Rainier inferred from teleseismic body waves. Journal of Geophysical Research. 1979;84(B9):4749-4762.
- Ammon CJ, Randall GE, Zandt G. On the nonuniqueness of receiver function inversions. Journal of Geophysical Research. 1990;95(B10):15303-15318.
- Zhu L, Kanamori H. Moho depth variation in southern California from teleseismic receiver functions. Journal of Geophysical Research. 2000;105(B2):2969-2980.
- Kind R, Yuan X, Saul J. Seismic images of crust and upper mantle beneath Tibet. Science. 2002;298(5596):1219-1221.
- Nabelek J, Hetenyi G, Vergne J. Underplating in the Himalaya-Tibet collision zone revealed by the HiCLIMB experiment. Science. 2009;325(5946):13711374.
- Zheng XF, Yao ZX, Liang JH. The China Earthquake Networks Centre broadband array. Seismological Research Letters. 2010;81(4):610-618.
- Christensen NI. Poisson ratio and crustal seismology. Journal of Geophysical Research. 1996;101(B2):31393156.
- Dziewonski AM, Chou TA, Woodhouse JH. Determination of earthquake source parameters from waveform data. Journal of Geophysical Research. 1981;86(B4):2825-2852.
- Ligorria JP, Ammon CJ. Iterative deconvolution and receiver-function estimation. Bulletin of the Seismological Society of America. 1999;89(5):13951400.
- Efron B, Tibshirani R. An Introduction to the Bootstrap. New York: Chapman & Hall; 1993.
- Nelson KD, Zhao W, Brown LD. Partially molten middle crust beneath southern Tibet. Science. 1996;274(5293):1684-1688.
- Clark MK, Royden LH. Topographic ooze: building the eastern margin of Tibet by lower crustal flow. Geology. 2000;28(8):703-706.
- Owens TJ, Zandt G. Implications of crustal property variations for models of Tibetan Plateau evolution. Nature. 1997;387(6628):37-43.
- Hetenyi G, Cattin R, Vergne J. The effective elastic thickness of the India Plate from receiver function imaging. Earth and Planetary Science Letters. 2006;252(3):426-440.
- Shi D, Shen Y, Zhao W. Seismic evidence for a Moho offset and south-directed thrust at the easternmost Himalaya. Tectonophysics. 2009;475(2):338-347.
- Schulte-Pelkum V, Monsalve G, Sheehan A. Imaging the Indian subcontinent beneath the Himalaya. Nature. 2005;435(7046):1222-1225.
- Chen WP, Molnar P. Focal depths of intracontinental and intraplate earthquakes. Journal of Geophysical Research. 1983;88(B5):4183-4214.
- Mechie J, Kind R, Saul J. The seismological structure of the Tibetan Plateau crust and upper mantle. Tectonophysics. 2012;554-557:1-10.