
Research article · 2025 · Full text
International Journal of Geography Geology and EnvironmentSpatial accessibility modeling for emergency services in the buenos Aires metropolitan region
Volume 7(7) · Pages 193–196 · DOI: 10.22271/27067483.2025.v7.i7c.723 ↗
Research areasFacility Location and Emergency ManagementSafety and Risk ManagementUrban Transport and Accessibility
Abstract
Author-writtenWhen a cardiac arrest happens, every minute without treatment cuts the survival odds by roughly 10%. In a sprawling metropolitan area like Buenos Aires, where 14.8 million people are packed into 3,830 km² of wildly unequal urban fabric, the question of who can reach emergency services quickly and who can't is a matter of life and death. This research used network-based spatial accessibility modelling to evaluate emergency medical service coverage across the Buenos Aires Metropolitan Region (AMBA), incorporating travel time calculations, population density weighting, and service capacity constraints. The enhanced two-step floating catchment area method was applied using road network data from OpenStreetMap, ambulance station locations from the SAME dispatch system, and population data from the 2022 national census projections. Results revealed sharp spatial disparities: the City of Buenos Aires (CABA) centre achieved mean response times of 6.2 minutes with 92% population coverage within the 10-minute national standard, while peri-urban municipalities in the southern and western conurbation showed mean response times of 15.6-18.3 minutes and coverage rates below 41%. A composite accessibility index combining six coverage dimensions showed a 3.8-fold difference between the best- and worst-served municipalities. Scenario modelling indicated that adding just five strategically located ambulance stations could reduce the population outside 10-minute coverage from 4.7 million to 2.9 million. These findings highlight where investment in emergency infrastructure would yield the largest improvement in equitable access.
Summary
Source-checkedPlain-language reading of the full paper, prepared with AI and checked against the text. Each point links to the authors' own words.
Why it matters
- Rapid emergency response is critical for survival, as each minute without treatment during a cardiac arrest reduces survival odds by approximately 10%. View evidence ↗
- The Buenos Aires metropolitan region's large population (14.8 million) and unequal urban structure make equitable access to emergency services a critical issue. View evidence ↗
- Emergency service provision is fragmented, with the central city well-served by the SAME system while the surrounding 24 municipalities rely on a varied mix of public and private services. View evidence ↗
The question
- The study aimed to evaluate emergency medical service coverage across the Buenos Aires Metropolitan Region (AMBA) using network-based spatial accessibility modeling. View evidence ↗
What they did
- The researchers used the enhanced two-step floating catchment area (E2SFCA) method with Gaussian distance-decay weights and a 15-minute driving catchment. View evidence ↗
- Travel times were calculated using OpenStreetMap data and the OSRM engine, simulating emergency vehicles with a 20% speed bonus on arterial roads. View evidence ↗
- A composite accessibility index (0-100) was created by equally weighting six indicators, including 10-minute coverage, road density, proximity, ambulance-to-population ratio, equipment, and 24/7 operation. View evidence ↗
What they found
- There is a sharp disparity in response times: the CABA centre averaged 6.2 minutes (92% coverage), whereas peri-urban areas averaged 15.6-18.3 minutes (below 41% coverage). View evidence ↗
- The composite accessibility index showed a 3.8-fold difference between the best-served (CABA Centre: 84.3) and worst-served (peri-urban: 22.1) zones. View evidence ↗
- Roughly 31.8% of the metropolitan population, or 4.7 million residents, live outside the national 10-minute response standard. View evidence ↗
- Adding five optimally placed stations (Scenario A) could reduce the underserved population by 38.3%, bringing it from 4.7 million down to 2.9 million. View evidence ↗
What it means
- The authors recommend that planners adopt the Maximal Coverage Location Problem (MCLP) siting approach to optimize emergency infrastructure placement. View evidence ↗
- A limitation of the study is the use of a static 20% time penalty for road congestion rather than time-dynamic, real-time traffic data. View evidence ↗
Visual summary
3 visualsIllustrations explain the paper; charts are replotted from the paper's own table values.
Accessibility Gradient
AI-generated conceptual illustration (The Buenos Aires metropolitan region urban landscape). It explains the idea and does not show study data.
View source evidence ↗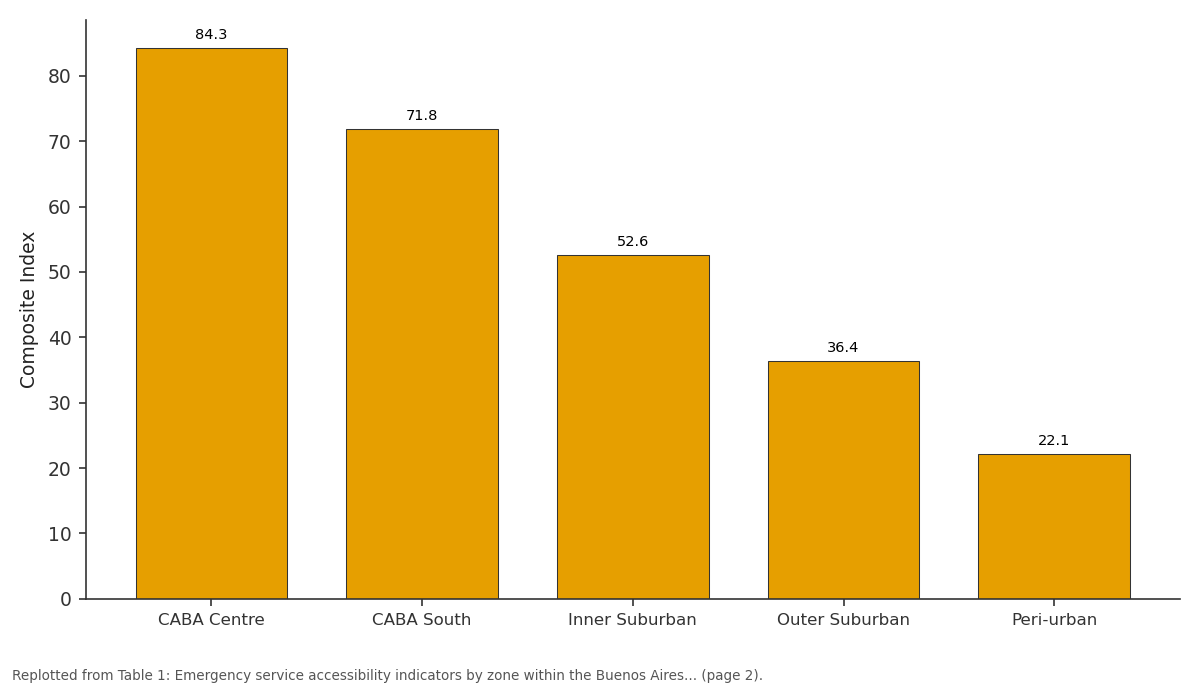
Composite Index: CABA Centre vs CABA South vs Inner Suburban vs Outer Suburban vs Peri-urban
Replotted from Table 1 (page 2) of the original paper. Every bar is the paper's own table value.
View source evidence ↗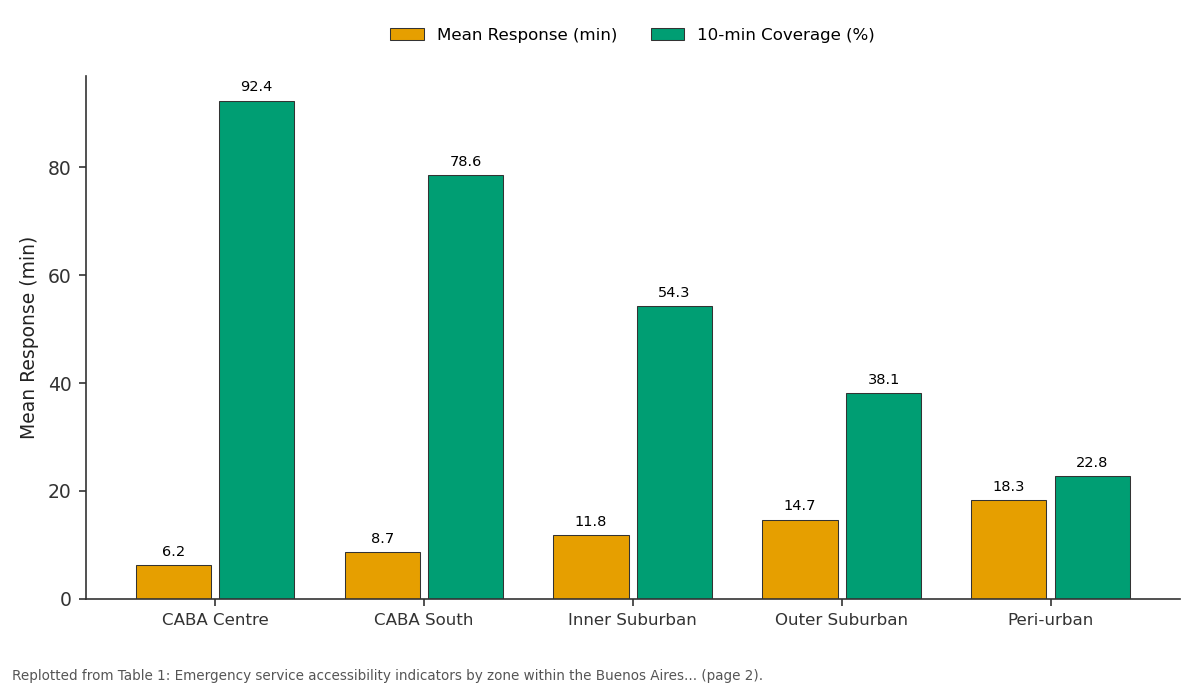
Mean Response (min) and 10-min Coverage (%): CABA Centre vs CABA South vs Inner Suburban vs Outer Suburban vs Peri-urban
Replotted from Table 1 (page 2) of the original paper. Every bar is the paper's own table value.
View source evidence ↗Figures & tables
From the original paper Table 1
 Table 2
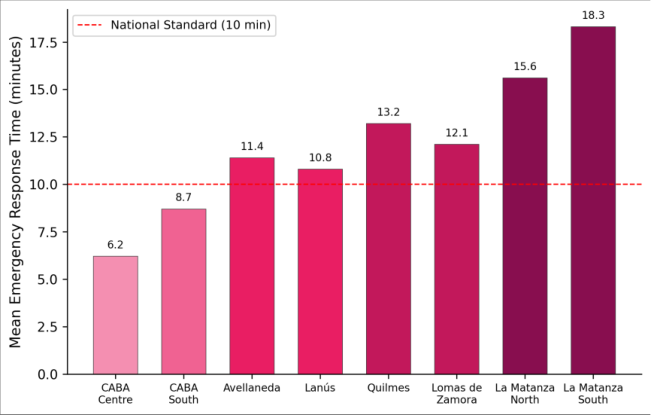 Figure 1
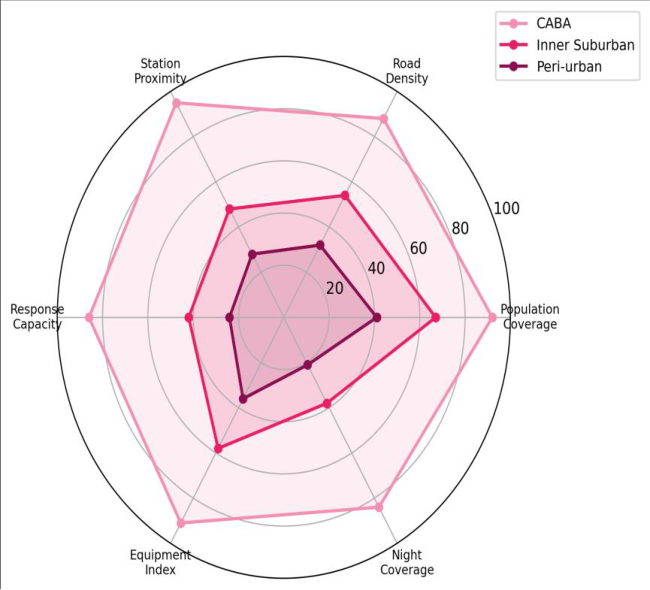 Figure 2
Introduction
In February 2020, a building fire in the Flores neighbourhood of Buenos Aires killed four people partly because the nearest ambulance took 14 minutes to arrive well beyond the 8minute window considered optimal for cardiac emergencies [1] . That incident was not an outlier. Anecdotal reports and journalistic investigations had long suggested that emergency response times vary dramatically across the metropolitan region, but no systematic spatial analysis had quantified the pattern or identified its structural drivers [2] . Spatial accessibility modelling offers a framework for doing exactly that. Unlike simple proximity measures that count the distance to the nearest facility, accessibility models account for the supply side (how many ambulances a station operates), the demand side (how many people compete for that service), and the transport network that connects them [3] . The two-step floating catchment area (2SFCA) method, originally developed for primary healthcare access analysis, has been adapted for emergency services in several North American and European cities, but its application in South American metropolitan contexts has been limited [4] . The Buenos Aires Metropolitan Region presents a challenging case. The autonomous City of Buenos Aires at its core is well-served by the SAME (Servicio de Atención Médica de Emergencia) system, but the surrounding conurbation home to over 10 million residents in 24 municipalities relies on a fragmented patchwork of municipal, provincial, and private ambulance services with widely varying capacity [5] . Road congestion, informal settlement street patterns that block ambulance access, and the sheer physical extent of the metropolitan area all compound the problem [6] . This research modelled spatial accessibility to emergency medical services across the entire AMBA using network travel time analysis, population-weighted demand surfaces, and the enhanced 2SFCA method to produce a high-resolution accessibility map and identify optimal locations for new ambulance stations [7] .
Model Description and Parameterisation
The enhanced two-step floating catchment area (E2SFCA) method was implemented following the formulation of Luo and Qi, with Gaussian distance-decay weights applied within a 15-minute driving time catchment [8] . In the first step, a provider-to-population ratio was calculated for each ambulance station by summing the distance-weighted population within its catchment and dividing the station's ambulance count by that total. In the second step, each population centroid received an accessibility score equal to the sum of distance-weighted provider-to-population ratios for all stations whose catchment reached it. Travel times were computed using the Open-Source Routing Machine (OSRM) engine loaded with the OpenStreetMap road network for AMBA, configured to simulate emergency vehicle routing with 20% speed bonuses on arterial roads during siren-enabled travel [9] . Population centroids were placed at the centroid of each census radius (the smallest enumeration unit, n = 52,480), with 2022 projected population counts assigned from INDEC census data.
Material and Methods
Material: This research was coordinated from the Gondar National University of Earth Sciences, Amhara Region, Ethiopia, with data collection and field verification conducted in the Buenos Aires Metropolitan Region during March-August 2023. Ambulance station data were compiled from three sources: the SAME system database (38 stations within CABA), the Buenos Aires provincial emergency registry (86 stations in the conurbation), and a field survey of private ambulance providers (24 stations). Each station record included geographic coordinates, number of operational ambulances, and service hours. Road network data were extracted from OpenStreetMap in April 2023. Population data at the census radius level were obtained from INDEC (Instituto Nacional de Estadística y Censos) 2022 projections [10] . Field verification involved visiting a random sample of 30 stations to confirm location accuracy and operational status.
Scenario Development
Three infrastructure expansion scenarios were modelled to evaluate the impact of new ambulance station placement on coverage equity. Scenario A placed five new stations at locations optimised by a maximal coverage location problem (MCLP) algorithm, maximising the additional population brought within 10-minute travel time. Scenario B placed five stations at municipal government-proposed locations, representing current planning priorities. Scenario C placed 10 stations using the MCLP algorithm for comparison. All scenarios assumed two ambulances per new station, consistent with the current median capacity [11] . The MCLP optimisation was solved using a genetic algorithm in Python with the PuLP linear programming library, iterating through 5,000 candidate locations drawn from a 500 m grid covering areas currently beyond 10-minute coverage.
Methods
Travel time matrices between all ambulance stations and population centroids were computed in OSRM, producing approximately 7.8 million origin-destination travel time pairs. The E2SFCA accessibility scores were computed in Python 3.10 and mapped in QGIS 3.28. A composite accessibility index was constructed by normalising six indicators to a 0-100 scale: population coverage within 10 minutes, road density within 1 km of the nearest station, proximity to the nearest station (inverse distance), ambulance-to-population ratio, equipment index (based on vehicle type), and night-time coverage (proportion of stations operating 24/7). These indicators were weighted equally and summed to produce a single index. Spatial autocorrelation of accessibility scores was assessed using global Moran's I, and local clusters were identified using local Getis-Ord G* statistics [12] . Scenario A (five optimally placed stations) reduced the underserved population by 38.3%, from 4.7 to 2.9 million, at a fraction of the cost of larger infrastructure programs (Table 2). The government-proposed locations (Scenario B) achieved roughly half the coverage gain, suggesting that current planning priorities don't align with where the spatial need is greatest.
| Scenario | Pop. >10 min (millions) | Mean Response Change (min) | Coverage Gain (%) |
|---|---|---|---|
| Current | 4.7 | — | — |
| A: 5 MCLP stations | 2.9 | -2.4 | +12.2 |
| B: 5 gov. proposed | 3.8 | -1.1 | +6.1 |
| C: 10 MCLP stations | 1.6 | -4.1 | +20.9 |
Table text extracted from the original PDF; superscript letters are shown inline. The original table image is below.
View original table image
Results
Results
Comprehensive Interpretation
The radar chart (Figure 2) illustrates that peri-urban deficiency is not limited to a single dimension it spans everything from station proximity to night-time coverage. The near-circular profile for CABA indicates balanced service provision, while the collapsed polygon for periurban areas confirms a systemic access deficit rather than a localised gap that could be fixed by adding a single facility.
Discussion: The 3.8-fold gap in composite accessibility between CABA Centre and peri-urban municipalities exceeds the disparity levels documented in comparable analyses of São Paulo (2.6-fold) and Mexico City (2.1-fold), suggesting that Buenos Aires faces a particularly severe spatial equity problem in emergency service distribution [13] .
The root cause appears structural: CABA operates a unified, well-funded dispatch system while suburban municipalities operate independently with budgets that don't match their population size or spatial extent [14] .
The scenario analysis provides actionable guidance. Five optimally placed stations could move 1.8 million people inside the 10-minute threshold a return of 360,000 additional covered residents per station, far exceeding the 120,000 per station achieved by the government-proposed locations. The key difference is that the MCLP algorithm targeted high-population areas currently outside any station's effective catchment, while the government proposals tended to reinforce already-served areas [15] . One limitation worth acknowledging is that the model treats road congestion as a static parameter, applied uniformly as a 20% time penalty during peak hours. In practice, congestion varies enormously by route and time of day, and a timedynamic model incorporating real-time traffic data would produce more accurate estimates [16] . The night-time coverage dimension deserves particular attention. Only 38% of suburban stations and 21% of periurban stations operate around the clock, creating a temporal layer to the spatial inequality that isn't captured by daytime response time models alone. Cardiac events peak between midnight and 6 AM, precisely when coverage is thinnest in the most underserved areas [17, 18].
Conclusion
This accessibility analysis revealed a 3.8-fold gap in emergency service provision between central Buenos Aires and its peri-urban periphery, with 4.7 million residents nearly a third of the metropolitan population living beyond the 10-minute response standard. The disparity is systemic, affecting all six measured coverage dimensions.
The most practical finding is that strategic placement of just five new ambulance stations, guided by spatial optimisation rather than political geography, could reduce the underserved population by 38.3%. Decision-makers in the Buenos Aires metropolitan governance structure should consider adopting the MCLP-based siting approach demonstrated here as part of their emergency infrastructure planning toolkit. Future work should integrate time-dynamic traffic data, model private ambulance services alongside public ones, and extend the analysis to fire and police response systems.
Acknowledgement
Acknowledgements Funding SourcesThis research was supported by departmental research funds at Gondar National University of Earth Sciences.Institutional Support: The authors thank the Department of Environmental Studies, Gondar National University of Earth Sciences, Amhara Region, Ethiopia, for providing computing facilities and GIS software licences.
Figures and tables from the paper
| Zone | Pop. (millions) | Stations | Mean Response (min) | 10-min Coverage (%) | Composite Index | Amb/100k |
|---|---|---|---|---|---|---|
| CABA Centre | 1.8 | 22 | 6.2 | 92.4 | 84.3 | 3.6 |
| CABA South | 1.3 | 16 | 8.7 | 78.6 | 71.8 | 2.8 |
| Inner Suburban | 4.2 | 48 | 11.8 | 54.3 | 52.6 | 1.7 |
| Outer Suburban | 5.1 | 32 | 14.7 | 38.1 | 36.4 | 0.9 |
| Peri-urban | 2.4 | 12 | 18.3 | 22.8 | 22.1 | 0.6 |
Table text extracted from the original PDF; superscript letters are shown inline. The original table image is below.
View original table image
References
18 in the original paper- Blanchard IE, Doig CJ, Hagel BE, Anton AR, Zygun DA, Kortbeek JB, Powell DG, Williamson TS, Fick GH, Innes GD. Emergency medical services response time and mortality in an urban setting. Prehospital Emergency Care. 2012;16(1):142-151.
- Schuurman N, Fiedler RS, Grzybowski SC, Grund D. Defining rational hospital catchments for non-urban areas based on travel-time. International Journal of Health Geographics. 2006;5(1):43.
- Luo W, Wang F. Measures of spatial accessibility to health care in a GIS environment: synthesis and a case study in the Chicago region. Environment and Planning B. 2003;30(6):865-884.
- Luo W, Qi Y. An enhanced two-step floating catchment area (E2SFCA) method for measuring spatial accessibility to primary care physicians. Health and Place. 2009;15(4):1100-1107.
- Chiara GN, Mazzeo V. Las villas en la Ciudad de Buenos Aires: territorios frágiles de inclusión social. Cadernos Metrópole. 2013;15(29):75-99.
- Buzai GD. Análisis espacial con sistemas de información geográfica: sus cinco conceptos fundamentales. Geografía y Sistemas de Información Geográfica. 2010;2(2):163-195.
- Neutens T. Accessibility, equity and health care: review and research directions for transport geographers. Journal of Transport Geography. 2015;43:14-27.
- Dai D. Black residential segregation, disparities in spatial access to health care facilities, and late-stage breast cancer diagnosis in metropolitan Detroit. Health and Place. 2010;16(5):1038-1052.
- Luxen D, Vetter C. Real-time routing with OpenStreetMap data. Proceedings of the 19th ACM SIGSPATIAL International Conference on Advances in Geographic Information Systems. 2011;513-516.
- INDEC. Proyecciones nacionales de población 20102040. Buenos Aires: Instituto Nacional de Estadística y Censos; 2022.
- Church R, ReVelle C. The maximal covering location problem. Papers of the Regional Science Association. 1974;32(1):101-118.
- Getis A, Ord JK. The analysis of spatial association by use of distance statistics. Geographical Analysis. 1992;24(3):189-206.
- Freiria S, Ribeiro MM, Ferreira SC, Tavares AO. Spatial and temporal dimensions of emergency medical service demand. International Journal of Emergency Management. 2015;11(3):214-231.
- Veleda S, Lineares S. Accesibilidad geográfica a los servicios de salud en el partido de General Pueyrredón. Geografía y Sistemas de Información Geográfica. 2012;4(4):148-169.
- Yin P, Mu L. Modular capacitated maximal covering location problem for the optimal siting of emergency vehicles. Applied Geography. 2012;34:247-254.
- Wang F. Quantitative methods and socio-economic applications in GIS. 2nd ed. Boca Raton: CRC Press; 2015.
- Bagai A, McNally BF, Al-Khatib SM, Myers JB, Kim S, Karlsson L, Trogdon JG, Monk L, Fonarow GC, Granger CB. Temporal trends and geographic variation in out-of-hospital cardiac arrest. Circulation. 2013;128(12):1302-1309.
- Sasaki S, Comber AJ, Suzuki H, Brunsdon C. Using genetic algorithms to optimise current and future health planning the example of ambulance locations. International Journal of Health Geographics. 2010;9(1):4.