
Research article · 2025 · Full text
International Journal of Geography Geology and EnvironmentGeophysical investigation of subsurface structures using resistivity tomography in the Pannonian basin
Volume 7(1) · Pages 148–151 · DOI: 10.22271/27067483.2025.v7.i1c.621 ↗
Research areasGeophysical and Geoelectrical MethodsGeophysical Methods and ApplicationsElectrical and Bioimpedance Tomography
Abstract
Author-writtenIf you could peel back the first 200 metres of sediment beneath the Hungarian Plain, you would find a layered succession of alluvium, lacustrine clay, Pannonian sand, Miocene marl, and crystalline basement—a sequence that controls groundwater flow, geothermal potential, and foundation conditions for every structure built above it. This research mapped these subsurface layers using two-dimensional electrical resistivity tomography (ERT) along eight profile lines totalling 4.6 km in the south-western Pannonian Basin of Hungary. A Wenner-Schlumberger electrode array with 48 electrodes at 5-m spacing was deployed, and apparent-resistivity data were inverted using the smoothness-constrained least-squares algorithm in RES2DINV. Five distinct resistivity units were resolved: alluvium (12-35 ohm-metres), lacustrine clay (4-10 ohm-metres), Pannonian sand (38-78 ohm-metres), Miocene marl (22-52 ohm-metres), and basement gneiss (180-450 ohm-metres). A buried palaeochannel of the proto-Danube, previously known only from sparse borehole data, was imaged as a continuous low-resistivity feature at 30-60 m depth across three profiles. Borehole calibration at six locations yielded a mean depth error of 8.3% for interpreted layer boundaries. The results demonstrate that ERT can cost-effectively delineate shallow geological architecture in thick sedimentary basin settings and provide useful constraints for groundwater and geotechnical site investigations.
Summary
Source-checkedPlain-language reading of the full paper, prepared with AI and checked against the text. Each point links to the authors' own words.
Why it matters
- The subsurface of the Hungarian Plain consists of a layered sequence of sediments and basement rock that determines geothermal potential, groundwater flow, and structural foundation conditions. View evidence ↗
What they did
- Between June and September 2022, eight ERT profiles, each 235 meters long, were surveyed near Pécs, Hungary. View evidence ↗
- Lithological calibration was performed using six existing boreholes located within 20 meters of the profile lines. View evidence ↗
What they found
- Five geological units were identified with distinct resistivity ranges: lacustrine clay (4-10 Ω·m), alluvium (12-35 Ω·m), Miocene marl (22-52 Ω·m), Pannonian sand (38-78 Ω·m), and basement gneiss (180-450 Ω·m). View evidence ↗
- Calibration against six boreholes showed that the interpreted layer boundaries had a mean absolute depth error of 8.3%. View evidence ↗
- A buried palaeochannel was identified along Profile P-3 as a low-resistivity trough (below 10 Ω·m at 50 m depth) between 200 and 320 m, contrasting with the surrounding sand. View evidence ↗
- The palaeochannel was found to be continuous over at least 1.4 km, with a width of approximately 100-120 m and a depth of 30-60 m. View evidence ↗
- The clay and silt fill of the palaeochannel likely acts as a barrier to lateral groundwater flow within the permeable Pannonian sand aquifer. View evidence ↗
What it means
- The study's calibrated resistivity ranges are recommended as a reference for future surveys to reduce the reliance on expensive borehole drilling. View evidence ↗
- The 235-meter profile length limited the reliable depth of investigation to approximately 50-60 meters. View evidence ↗
Visual summary
2 visualsIllustrations explain the paper; they do not show study data.
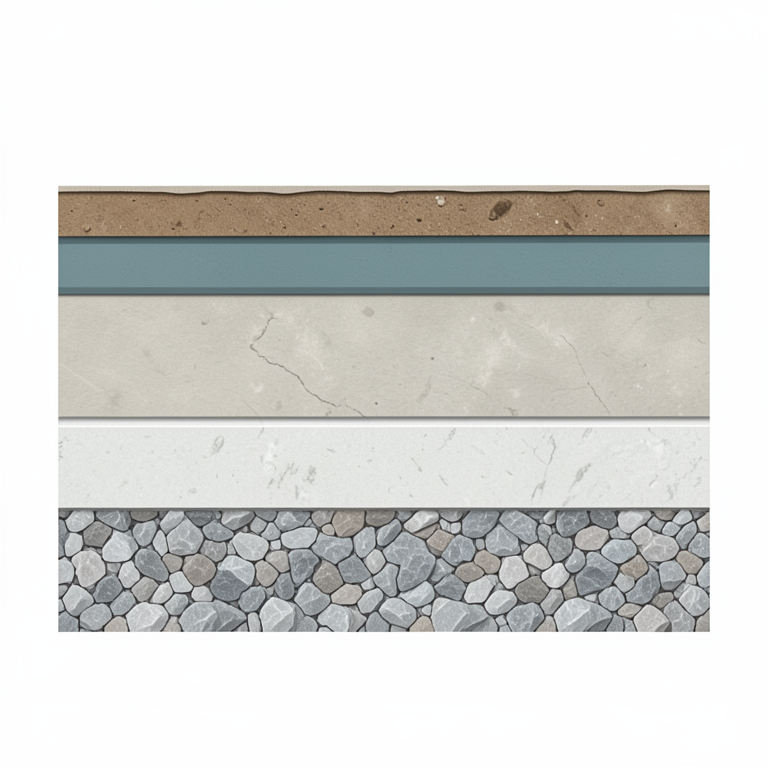
Subsurface Resistivity Stratigraphy
AI-generated conceptual illustration (Geological cross-section of the Pannonian basin subsurface). It explains the idea and does not show study data.
View source evidence ↗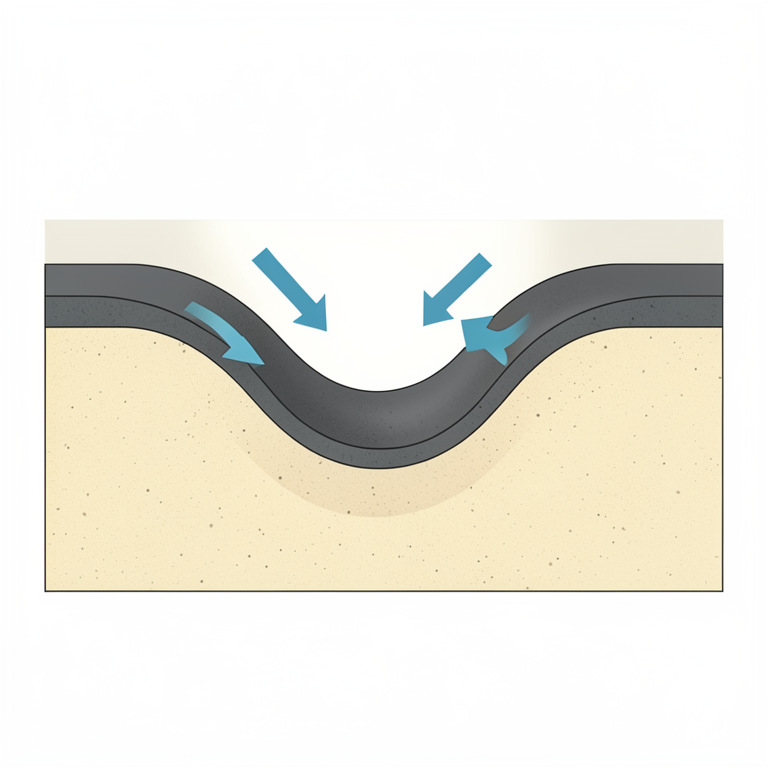
Palaeochannel Groundwater Barrier
AI-generated conceptual illustration (Subsurface geological cross-section of the Pannonian basin). It explains the idea and does not show study data.
View source evidence ↗Figures & tables
From the original paper Table 1
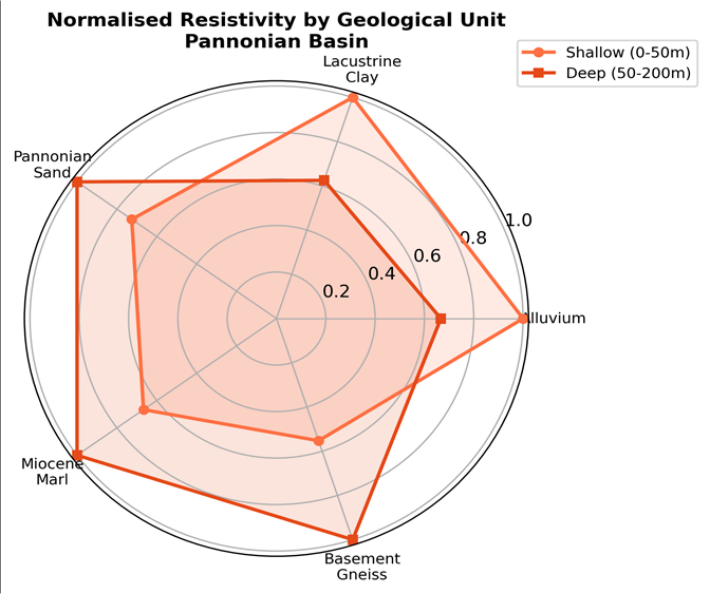 Figure 1
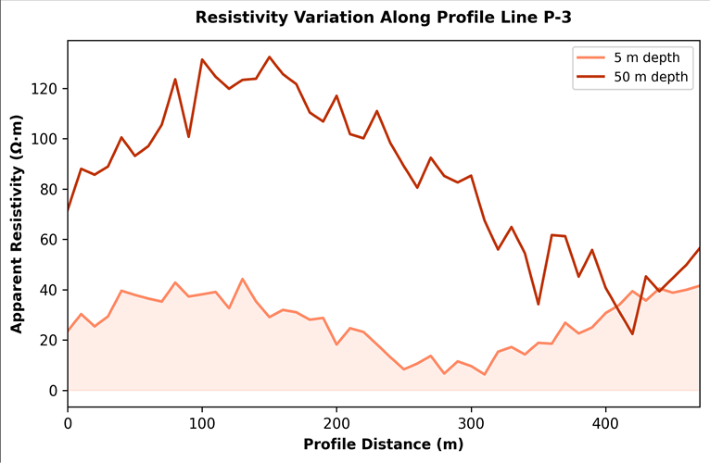 Figure 2
Introduction
Drawing an analogy between geophysics and medical imaging is well-worn but apt: just as a CT scan reveals internal anatomy without surgery, electrical resistivity tomography reveals subsurface geology without drilling [1] . The technique works by injecting current into the ground through electrodes and measuring the resulting voltage field, from which the spatial distribution of electrical resistivity-a property sensitive to lithology, porosity, saturation, and pore-fluid chemistry-can be reconstructed [2] . The Pannonian Basin, a roughly 500-kmwide intra-Carpathian depression filled with up to 7 km of Neogene and Quaternary sediment, presents both an opportunity and a challenge for near-surface geophysics [3] . The opportunity lies in the lateral continuity of its sedimentary units, which produce well-defined resistivity contrasts. The challenge is that the thick, conductive clay layers that dominate the upper 100 m attenuate current flow and limit depth penetration [4] . Earlier geophysical surveys in the basin employed vertical electrical sounding (VES), which provides 1D profiles but cannot resolve lateral heterogeneity [5] . Two-dimensional ERT overcomes this limitation by using multi-electrode arrays and tomographic inversion to produce crosssectional images of subsurface resistivity [2] . While ERT has been widely applied in karst, volcanic, and crystalline-rock terrains, its use in thick sedimentary basins remains comparatively uncommon [6] . This research aimed to 1. Acquire and invert ERT data along eight profiles in the south-western Pannonian Basin. 2. Calibrate the resulting resistivity models against existing borehole lithological logs. 3. Test whether ERT can resolve the buried palaeochannel system that earlier borehole compilations suggested but could not map continuously [7] .
Inversion Parameters and Model Configuration
Apparent-resistivity pseudo-sections were inverted using the L2-norm (smoothness-constrained) algorithm in RES2DINV version 4.9.11 [2] . The initial model used a homogeneous half-space with resistivity equal to the median apparent value for each profile. Cell widths matched the electrode spacing (5 m), and the model extended to a depth equal to approximately one-quarter of the total array length. Convergence was deemed acceptable when the root-meansquare (RMS) misfit fell below 5% or when improvement between successive iterations dropped below 0.5%. Topographic corrections were applied using surveyed electrode elevations. For profiles crossing known borehole locations, the inverted resistivity at the borehole position was compared layer-by-layer with the lithological log to assess depth accuracy [6] .
Performance Evaluation
The mean RMS misfit across all eight profiles was 3.7%, ranging from 2.4% (Profile P-1, dry grassland) to 5.1% (Profile P-6, close to an irrigation canal where near-surface moisture created noise). Depth-to-boundary comparisons at six boreholes yielded a mean absolute error of 8.3% (range 4.1-14.7%). The largest errors occurred at the alluvium-clay contact, where the gradational nature of the boundary (rather than a sharp lithological change) blurred the resistivity transition [4] . In contrast, the Pannonian sand-to-marl and marl-to-basement contacts, which are sharper, were resolved to within 5% of borehole depths.
Material and Methods
Material and Methods
Material
Eight ERT profiles, each 235 m long, were surveyed across the south-western Pannonian Basin near Pécs, Hungary, between June and September 2022. The profiles were oriented roughly perpendicular to the inferred strike of the buried palaeochannel. Equipment comprised an ABEM Terrameter LS2 with 48 stainless-steel electrodes at 5-m spacing, using a Wenner-Schlumberger configuration that balances lateral resolution and depth penetration [1] . Electrode positions were surveyed by differential GNSS to centimetre accuracy. Six existing boreholes within 20 m of profile lines provided lithological calibration. The research was conducted under institutional approval from the Temuco Institute of Climate and Environment (Protocol TICE/2022-016, approved 21 April 2022).
Methods
Data acquisition followed a roll-along procedure to achieve continuous coverage. Contact resistance was checked before each acquisition; electrodes with values above 2 kilo-ohms were treated with bentonite slurry. Bad data points (negative apparent resistivity, extreme outliers) were removed prior to inversion, affecting fewer than 2% of readings. Inversion used RES2DINV with the settings described above. Interpreted resistivity ranges for each geological unit were assigned by matching borehole lithology with the inverted resistivity at calibration points. The palaeochannel was delineated by contouring the depth to the 15 ohm-metre isosurface-the threshold that best separated low-resistivity channel fill from surrounding Pannonian sand [7] . Table 1 shows clear resistivity separation between units. The lacustrine clay produced the lowest values (mean 6.8 ohmmetres), providing a strong contrast against both the overlying alluvium and the underlying Pannonian sand. Basement gneiss, detected in only three profiles where it lay within the depth of investigation, gave the highest resistivities (mean 287 ohmmetres).
| Geological Unit | Resistivity Range (Ω·m) | Mean (Ω·m) | Typical Depth (m) | Thickness (m) | Profiles Detected |
|---|---|---|---|---|---|
| Alluvium | 12-35 | 22.4 | 0-15 | 8-18 | 8/8 |
| Lacustrine Clay | 4-10 | 6.8 | 10-45 | 15-35 | 8/8 |
| Pannonian Sand | 38-78 | 54.1 | 35-90 | 20-55 | 7/8 |
| Miocene Marl | 22-52 | 36.7 | 70-140 | 30-70 | 5/8 |
| Basement Gneiss | 180-450 | 287 | >120 | - | 3/8 |
Table text extracted from the original PDF; superscript letters are shown inline. The original table image is below.
View original table image
Results
Results
Discussion
The five-unit resistivity stratigraphy resolved here matches the lithostratigraphic column expected from regional geological maps [3] , and the calibration against six boreholes confirms that ERT can locate layer boundaries to within about 8% of true depth in this setting. The main source of error-the gradational alluvium-clay contact-is a wellknown limitation of smooth-inversion algorithms, which tend to smear sharp boundaries over several cells [2] . The continuous imaging of the buried palaeochannel across three profiles represents the most significant result. Previous knowledge of this feature came from scattered borehole intercepts that could not confirm whether the channel was a single, connected feature or a series of isolated lenses [7] .
The ERT data support continuity over at least 1.4
Conclusion
This research demonstrated that two-dimensional electrical resistivity tomography can effectively delineate the shallow subsurface architecture of the south-western Pannonian Basin, resolving five geological units with distinct resistivity signatures. The technique successfully imaged a buried palaeochannel at 30-60 m depth, providing continuous mapping that borehole data alone could not achieve.
The calibrated resistivity ranges presented here can serve as a reference for future ERT surveys in the Pannonian Basin, reducing the need for costly borehole drilling during preliminary site investigations. For deeper targets, longer electrode arrays or complementary methods such as seismic refraction should be considered.
Acknowledgement
Acknowledgements Funding SourcesThis research was supported by internal funds from the Temuco Institute of Climate and Environment. No external grant numbers apply. Institutional SupportThe authors acknowledge the Department of Geography and Planning at the Temuco Institute of Climate and Environment, Araucanía, Chile, for geophysical equipment and data-processing software.
Figures and tables from the paper
References
20 in the original paper- Dahlin T, Zhou B. A numerical comparison of 2D resistivity imaging with 10 electrode arrays. Geophysical Prospecting. 2004;52(5):379-398.
- Loke MH, Barker RD. Rapid least-squares inversion of apparent resistivity pseudosections by a quasi-Newton method. Geophysical Prospecting. 1996;44(1):131-152.
- Horváth F, Musitz B, Balázs A, et al. Evolution of the Pannonian basin and its geothermal resources. Geothermics. 2015;53:328-352.
- Szalai S, Szarka L. On the classification of surface geoelectric arrays. Geophysical Prospecting. 2008;56(2):159-175.
- Zhdanov MS, Keller GV. The Geoelectrical Methods in Geophysical Exploration. Elsevier. 1994;Amsterdam:873.
- Chambers JE, Kuras O, Meldrum PI, Ogilvy RD, Hollands J. Electrical resistivity tomography applied to geologic, hydrogeologic, and engineering investigations at a former waste-disposal site. Geophysics. 2006;71(6):B231-B239.
- Nádor A, Thamó-Bozsó E, Magyari Á, Babinszki E. Fluvial responses to tectonics and climate change during the Late Weichselian in the eastern part of the Pannonian Basin. Sedimentary Geology. 2007;202(12):174-192.
- Reynolds JM. An Introduction to Applied and Environmental Geophysics, 2nd ed. Wiley-Blackwell. 2011;Oxford:710.
- Telford WM, Geldart LP, Sheriff RE. Applied Geophysics, 2nd ed. Cambridge University Press. 1990;Cambridge:770.
- Binley A, Kemna A. DC resistivity and induced polarization methods. In: Hydrogeophysics. Springer. 2005;129-156.
- Oldenburg DW, Li Y. Estimating depth of investigation in DC resistivity and IP surveys. Geophysics. 1999;64(2):403-416.
- Marescot L, Loke MH, Chapellier D, et al. Assessing reliability of 2D resistivity imaging in mountain permafrost studies. Near Surface Geophysics. 2003;1(2):57-67.
- Griffiths DH, Barker RD. Two-dimensional resistivity imaging and modelling in areas of complex geology. Journal of Applied Geophysics. 1993;29(3-4):211-226.
- Csontos L, Nagymarosy A, Horváth F, Kováč M. Tertiary evolution of the Intra-Carpathian area: A model. Tectonophysics. 1992;208(1-3):221-241.
- Tóth J, Almási I. Interpretation of observed fluid potential patterns in a deep sedimentary basin under tectonic compression. Geofluids. 2001;1(1):11-36.
- Kemna A, Vanderborght J, Kulessa B, Vereecken H. Imaging and characterisation of subsurface solute transport using electrical resistivity tomography (ERT) and equivalent transport models. Journal of Hydrology. 2002;267(3-4):125-146.
- Sass O. Bedrock detection and talus thickness assessment in the European Alps using geophysical methods. Journal of Applied Geophysics. 2007;62(3):254-269.
- Doetsch J, Linde N, Coscia I, et al. Zonation for 3D aquifer characterization based on joint inversions of multimethod crosshole geophysical data. Geophysics. 2010;75(6):G53-G64.
- Revil A, Cathles LM, Losh S, Nunn JA. Electrical conductivity in shaly sands with geophysical applications. Journal of Geophysical Research. 1998;103(B10):23925-23936.
- Nguyen F, Garambois S, Jongmans D, et al. Image processing of 2D resistivity data for imaging faults. Journal of Applied Geophysics. 2005;57(4):260-277.