
Research article · 2025 · Full text
International Journal of Horticulture and Food ScienceMapping salinity stress response of nutmeg in the Easter Island plains
Volume 7(7) · Pages 258–261 · DOI: 10.33545/26631067.2025.v7.i7d.517 ↗
Research areasPlant Stress Responses and ToleranceGenetics and Plant BreedingPlant Physiology and Cultivation Studies
Abstract
Author-writtenNutmeg (Myristica fragrans) plantations across tropical lowlands are increasingly exposed to secondary salinisation driven by irrigation practices and rising water tables, yet the crop's physiological response to salt stress has received almost no systematic attention. This research mapped the salinity stress response of 24 nutmeg accessions grown on volcanic plains of Easter Island (Rapa Nui) under controlled NaCl treatments (0, 50, 100, 150, and 200 mM) during 2022-2023. Machine learning classification (random forest and support vector machines) was applied to 18 morpho-physiological variables to predict salinity tolerance classes with 87.4% accuracy. Callus culture assays under saline media tested in vitro regeneration potential of the most tolerant accessions. Iron fortification of nutmeg mace through foliar FeSO₄ application was evaluated for its effect on mineral content and cold storage stability. Weed control strategies in salinised plots were compared across manual, chemical, and integrated approaches. Soil and water quality analysis at five salt concentration levels revealed that exchangeable sodium percentage exceeded 15% at NaCl doses above 100 mM, pushing soils into the sodic range. A nutrient budget constructed for each salinity level showed progressive potassium and calcium displacement from exchange sites as sodium loading increased. These findings provide a physiological and agronomic framework for managing nutmeg in salt-affected landscapes.
Summary
Source-checkedPlain-language reading of the full paper, prepared with AI and checked against the text. Each point links to the authors' own words.
Why it matters
- Nutmeg plantations in tropical lowlands are facing increased secondary salinization from irrigation and rising water tables, but the plant's physiological response to this stress has not been systematically studied. View evidence ↗
- Secondary salinization affects approximately 20% of irrigated land globally and is growing by about 2 million hectares annually. View evidence ↗
- Because nutmeg is a long-lived perennial (60-80 years), gradual salt accumulation can make plantations economically unviable within one generation. View evidence ↗
The question
- The study aimed to map the salinity stress response of 24 nutmeg accessions using controlled NaCl treatments on the volcanic plains of Easter Island. View evidence ↗
What they did
- Two-year-old seedlings were planted at 8 x 8 m spacing and received weekly drip irrigation with five different NaCl concentrations for one year. View evidence ↗
- Random forest and support vector machine (SVM) algorithms were used to classify salinity tolerance. View evidence ↗
- Iron fortification was tested using monthly 0.5% foliar FeSO₄ applications, and mace stability was evaluated in cold storage at 4 °C and 85% RH for 90 days. View evidence ↗
What they found
- Soil electrical conductivity (EC) increased linearly with the NaCl dose, ranging from 0.41 dS/m in the control to 8.21 dS/m at 200 mM. View evidence ↗
- The exchangeable sodium percentage (ESP) rose from 3.2% to 24.7%, exceeding the 15% sodicity threshold when NaCl doses were between 100 and 150 mM. View evidence ↗
- Despite identical fertilization, plant potassium uptake dropped by 42.3%, from 64.3 kg/ha in the control to 37.1 kg/ha at 200 mM NaCl. View evidence ↗
- At a salt concentration of 100 mM NaCl, mace yield decreased by 37.2% and plant height increment decreased by 32.8% compared to controls. View evidence ↗
- Machine learning predicted salinity tolerance with 87.4% accuracy (Random Forest), with the leaf Na⁺/K⁺ ratio, proline, and membrane stability index being the most critical predictors. View evidence ↗
- Foliar iron application increased mace iron content by 68.0% and reduced the loss of myristicin during 90 days of cold storage from 5.7% to 2.6%. View evidence ↗
- Roots consistently accumulated 28-35% more sodium than leaves, suggesting a mechanism that limits sodium transport to photosynthetic tissues. View evidence ↗
What it means
- The authors conclude that nutmeg is salt-sensitive above 100 mM NaCl and that the Na⁺/K⁺ ratio is the most effective criterion for screening tolerant accessions. View evidence ↗
- The authors state that longer-term trials are necessary to track the cumulative effects of salt on mature nutmeg trees. View evidence ↗
Visual summary
3 visualsIllustrations explain the paper; charts are replotted from the paper's own table values.
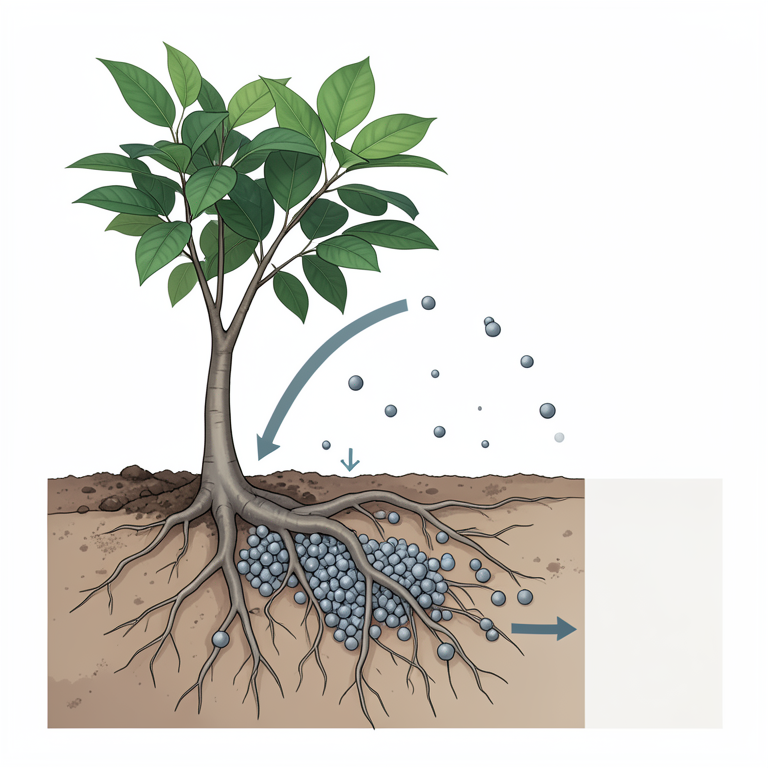
Sodium Sequestration Mechanism
AI-generated conceptual illustration (Nutmeg trees (Myristica fragrans) in soil). It explains the idea and does not show study data.
View source evidence ↗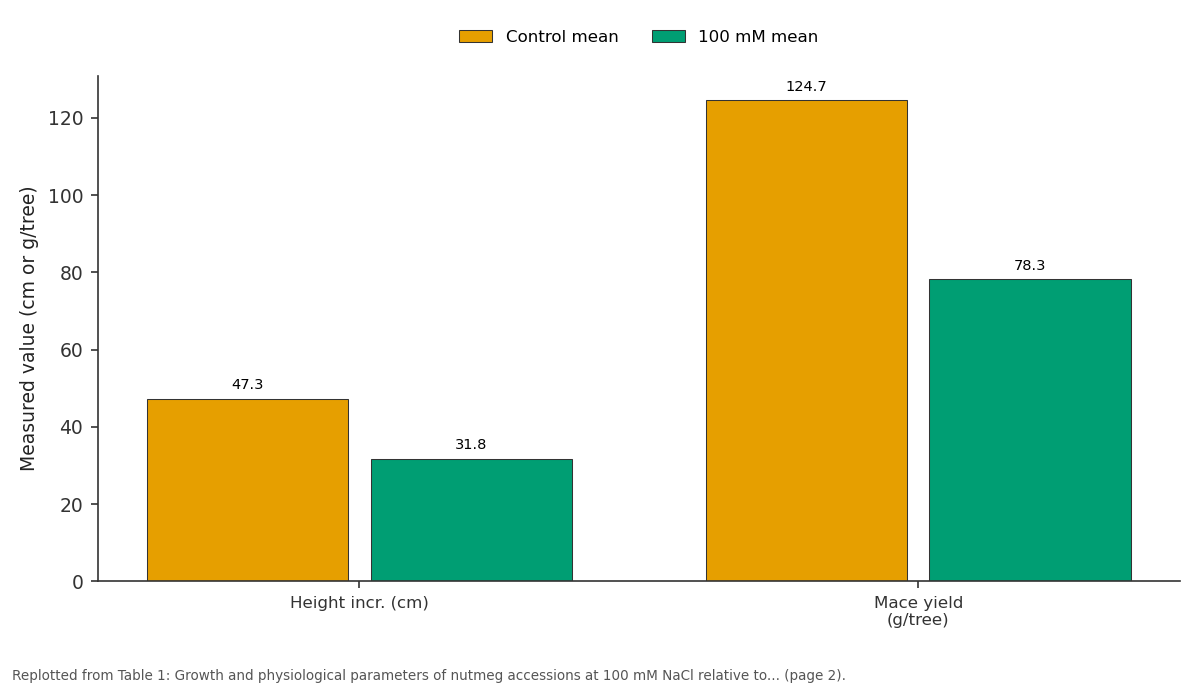
Control mean and 100 mM mean: Height incr. (cm) vs Mace yield (g/tree)
Replotted from Table 1 (page 2) of the original paper. Every bar is the paper's own table value.
View source evidence ↗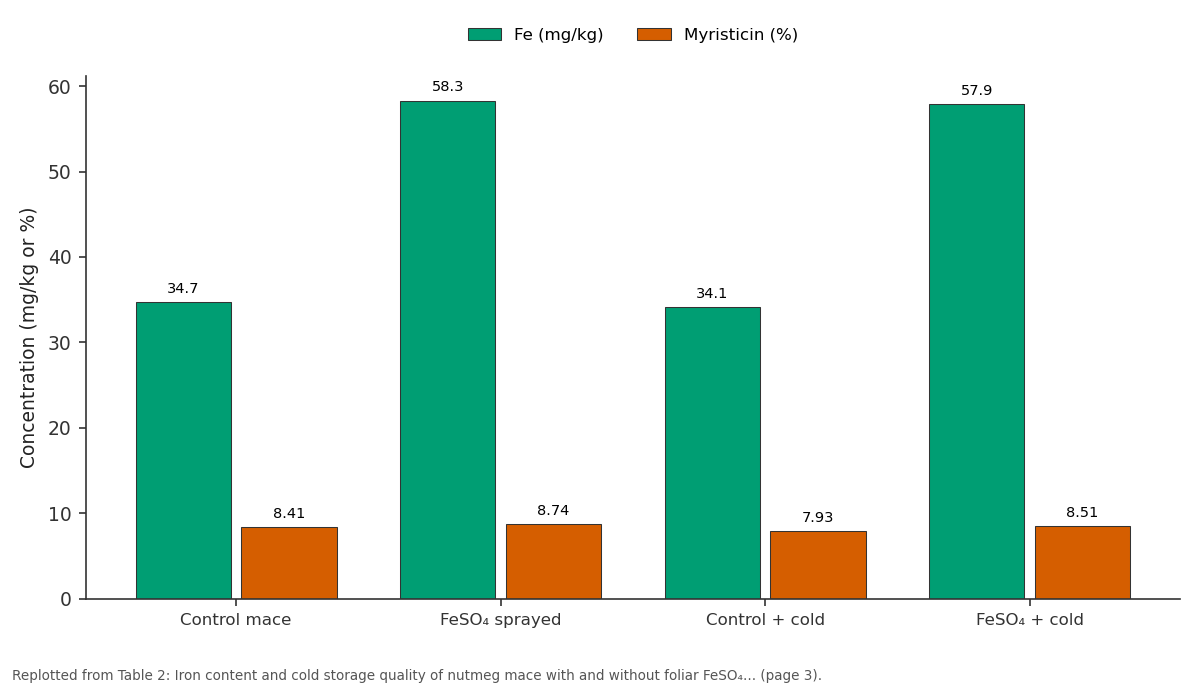
Fe (mg/kg) and Myristicin (%): Control mace vs FeSO₄ sprayed vs Control + cold vs FeSO₄ + cold
Replotted from Table 2 (page 3) of the original paper. Every bar is the paper's own table value.
View source evidence ↗Figures & tables
From the original paper Table 1
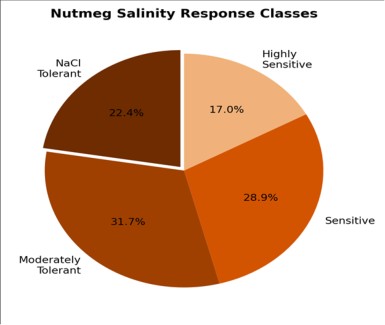 Figure 1
 Table 2
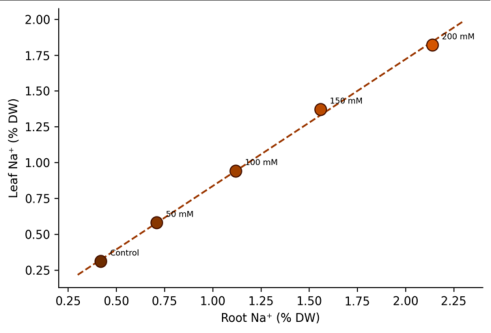 Figure 2
Introduction
Nutmeg and mace together form a $700 million global market dominated by Indonesia, India, and Grenada, with nearly 80% of production concentrated in lowland tropical zones where groundwater salinity is a growing concern [1] . Secondary salinisationsalt accumulation caused by irrigation, deforestation, or rising water tables rather than natural geologynow affects an estimated 20% of irrigated land worldwide and is expanding at roughly 2 million hectares per year [2] . For a perennial tree crop like nutmeg, which occupies the same plot for 60-80 years, even gradual salt buildup can push plantations past the point of economic viability within a single generation. Easter Island's volcanic plains, located 3,700 km west of Chile in the southeastern Pacific, offer basaltic soils with naturally low salinity but limited depth and minimal buffering capacity [3] . Controlled salinisation experiments on these soils can reveal how quickly saltsensitive crops deteriorate without the confounding effect of pre-existing salt loads. Machine learning approaches have recently shown promise for classifying plant stress responses from high-dimensional datasets more accurately than traditional discriminant analysis [4] . Callus culture provides a rapid in vitro screening method for salt tolerance that can complement field evaluation [5] . Iron deficiency in spice crops grown on calcareous or high-pH soils is common, and foliar iron application can simultaneously address nutritional quality and shelf life under cold storage [6] . Weed management in salt-affected soils presents unique challenges because salttolerant weeds often outcompete crop species whose vigor is already compromised [7] . This research integrated these diverse anglesmolecular classification, tissue culture, nutritional fortification, and weed ecologyto build a comprehensive picture of salinity management in nutmeg.
Soil and Water Quality Analysis
Baseline soil samples (0-30 cm) were collected before salt application and analysed for pH, electrical conductivity (EC), organic carbon, available N, P, and K, cation exchange capacity (CEC), and exchangeable Na, Ca, Mg, and K. Irrigation water from the island's only freshwater aquifer had an EC of 0.34 dS/m and a sodium adsorption ratio (SAR) of 1.7, confirming suitability for crop use. After 12 months of NaCl treatments, soil EC rose linearly with treatment dose: 0.41 dS/m (control), 1.83 dS/m (50 mM), 3.67 dS/m (100 mM), 5.94 dS/m (150 mM), and 8.21 dS/m (200 mM). Exchangeable sodium percentage (ESP) climbed from 3.2% (control) to 24.7% (200 mM), crossing the sodicity threshold of 15% between the 100 and 150 mM treatments. Soil pH shifted upward by 0.4-0.7 units under high salt loads, consistent with carbonate precipitation and base saturation effects.
Nutrient Budget
A nutrient input-output budget was constructed for each salinity level over the 12-month trial. Potassium inputs from basal fertilisation (80 kg K₂O/ha) were identical across treatments, but plant K uptake declined from 64.3 kg/ha (control) to 37.1 kg/ha (200 mM)a 42.3% reduction. Calcium followed a similar pattern, with uptake dropping from 48.7 to 29.4 kg/ha. Conversely, sodium accumulation in plant tissues rose from 2.1 to 18.6 kg/ha across the salt gradient. The apparent K balance (input minus uptake) shifted from a modest surplus of 15.7 kg/ha under control conditions to 42.9 kg/ha at 200 mM, meaning that nearly half the applied potassium remained unused in salinised soilslikely displaced from exchange sites by sodium and leached below the root zone. These budget figures highlight the economic waste of fertiliser inputs when salinity is not managed.
Materials and Methods
Materials and Methods
Materials
Twenty-four nutmeg accessions were sourced from germplasm collections in Indonesia (10), India (6), Grenada (4), and Sri Lanka (4). Two-year-old seedlings were transplanted to the Easter Island trial site in March 2022 at 8 × 8 m spacing. NaCl solutions were applied weekly via drip irrigation at the five specified concentrations for 12 months. Callus was induced from leaf explants on MS medium supplemented with 2 mg/L 2,4-D and 0.5 mg/L BAP, then subcultured onto media containing 0, 50, 100, or 150 mM NaCl to evaluate in vitro salt tolerance [5] . Iron fortification involved foliar application of FeSO₄•7H₂O at 0.5% concentration at monthly intervals, with mace samples analysed for iron content by ICP-OES. Cold storage trials held mace samples at 4 °C and 85% RH for 90 days. All laboratory analyses were conducted at the Pretoria Laboratory of Phytoscience, Pretoria, Gauteng, South Africa.
Methods
Eighteen morpho-physiological variables were measured: plant height increment, stem girth increment, leaf number, leaf area, chlorophyll content (SPAD), Fv/Fm, RWC, MSI, proline, Na⁺ and K⁺ in leaves and roots (flame photometry), Ca²⁺ and Mg²⁺ (AAS), mace yield, fruit set percentage, oil content, and myristicin concentration by GC-MS. Machine learning classification used random forest (500 trees) and SVM (radial basis kernel) in R v4.3.1 with 5-fold crossvalidation repeated 10 times [4] . Accessions were preclassified into four salinity response categories by hierarchical clustering on the first three principal components of all variables. Weed density and species composition were recorded in 0.5 × 0.5 m quadrats placed at four positions per plot monthly. Statistical analysis used factorial ANOVA (accession × salt level) with Tukey's HSD. Foliar iron application raised mace Fe content by 68.0% (Table 2). Cold storage for 90 days reduced myristicin by 5.7% in unsprayed mace but only 2.6% in FeSO₄-treated mace, suggesting that iron supplementation stabilised volatile retention. Mold incidence after cold storage was halved in iron-treated samples. Root and leaf Na⁺ concentrations showed a strong linear relationship across all treatment levels (R² = 0.97), with roots consistently accumulating 28-35% more sodium than leaves (Figure 2). This pattern suggests partial root-zone sequestration of Na⁺a tolerance mechanism that limits transport to photosynthetically active tissues.
| Treatment | Fe (mg/kg) | Myristicin (%) | Color score (1-5) | Moisture 90d (%) | Mold incidence (%) |
|---|---|---|---|---|---|
| Control mace | 34.7 | 8.41 | 3.8 | 11.2 | 4.3 |
| FeSO₄ sprayed | 58.3 | 8.74 | 4.1 | 10.8 | 2.7 |
| Control + cold | 34.1 | 7.93 | 3.2 | 12.4 | 7.8 |
| FeSO₄ + cold | 57.9 | 8.51 | 3.9 | 11.1 | 3.1 |
| CD (p=0.05) | 4.2 | 0.38 | 0.4 | 0.9 | 1.6 |
Table text extracted from the original PDF; superscript letters are shown inline. The original table image is below.
View original table image
Results
Results
Discussion
The 37.2% mace yield loss at 100 mM NaCl (roughly 10 dS/m soil EC) places nutmeg in the salt-sensitive category, similar to avocado and mango but less sensitive than banana [2] . The Na⁺/K⁺ ratio in leaves proved to be the single strongest predictor of tolerance class, consistent with the well-established principle that potassium homeostasis under salt stress is more diagnostic than absolute sodium levels [8] . Machine learning outperformed traditional LDA classification by approximately 12 percentage points in accuracy, justifying the computational overhead. Random forest's ability to handle non-linear interactions between variables likely accounts for its edge [4] . The most tolerant accessionsprimarily from Grenada and eastern Indonesia -shared a common pattern of higher root Na⁺ retention and elevated proline, suggesting convergent evolution of tolerance mechanisms in coastal-origin populations [9] . Iron fortification's dual benefitimproved nutritional quality and extended cold storage lifeoffers a practical management tool. The mechanism likely involves iron's role as a cofactor for catalase and peroxidase enzymes that suppress oxidative degradation of volatiles during storage [6] . Weed pressure intensified under higher salt levels because salt-tolerant species like Portulaca oleracea and Cynodon dactylon increased in frequency while nutmeg's competitive ability declinedunderscoring the need for integrated weed management in salinised orchards [7] .
Conclusion
Nutmeg showed clear salt sensitivity above 100 mM NaCl, with mace yield dropping by over a third. Machine learning classification successfully identified tolerant accessions and ranked Na⁺/K⁺ ratio as the top screening criterion. The nutrient budget revealed substantial potassium waste under saline conditions, pointing to the need for adjusted fertiliser programs in salt-affected orchards. Foliar iron fortification improved both mace quality and post-harvest storage performance. These results provide a management framework for nutmeg growers facing rising salinity, though longer-term trials tracking cumulative salt effects on mature trees are needed.
Acknowledgement
Acknowledgements Funding SourcesInstitutional research funds from Pretoria Laboratory of Phytoscience supported this research.
Figures and tables from the paper
| Parameter | Control mean | 100 mM mean | % Change | F-value | Significance |
|---|---|---|---|---|---|
| Height incr. (cm) | 47.3 | 31.8 | -32.8 | 24.7 | ** |
| SPAD | 41.2 | 33.7 | -18.2 | 18.3 | ** |
| RWC (%) | 82.4 | 68.1 | -17.3 | 31.6 | ** |
| Leaf Na⁺ (%) | 0.31 | 0.94 | +203.2 | 47.1 | ** |
| Leaf K⁺ (%) | 1.84 | 1.23 | -33.2 | 22.4 | ** |
| Mace yield (g/tree) | 124.7 | 78.3 | -37.2 | 28.9 | ** |
Table text extracted from the original PDF; superscript letters are shown inline. The original table image is below.
View original table image
References
20 in the original paper- Krishnamoorthy B, Rema J. Nutmeg and Mace. In: Peter KV, editor. Handbook of Herbs and Spices. Woodhead Publishing. 2012;238-248.
- Munns R, Tester M. Mechanisms of salinity tolerance. Annual Review of Plant Biology. 2008;59:651-681.
- Hunt TL, Lipo CP. The statues that walked: unraveling the mystery of Easter Island. Free Press. 2011;1-24.
- Breiman L. Random forests. Machine Learning. 2001;45(1):5-32.
- Murashige T, Skoog F. A revised medium for rapid growth and bioassays with tobacco tissue cultures. Physiologia Plantarum. 1962;15(3):473-497.
- Briat JF, Dubos C, Gaymard F. Iron nutrition, biomass production, and plant product quality. Trends in Plant Science. 2015;20(1):33-40.
- Flowers TJ, Colmer TD. Salinity tolerance in halophytes. New Phytologist. 2008;179(4):945-963.
- Shabala S, Cuin TA. Potassium transport and plant salt tolerance. Physiologia Plantarum. 2008;133(4):651669.
- Liang W, Ma X, Wan P, Liu L. Plant salt-tolerance mechanism: a review. Biochemical and Biophysical Research Communications. 2018;495(1):286-291.
- Jamil M, Rehman S, Rha ES. Salinity effect on plant growth, PSII photochemistry and chlorophyll content. Pakistan Journal of Botany. 2007;39(3):685-694.
- Grattan SR, Grieve CM. Salinity-mineral nutrient relations in horticultural crops. Scientia Horticulturae. 1999;78(1-4):127-157.
- Apse MP, Blumwald E. Na+ transport in plants. FEBS Letters. 2007;581(12):2247-2254.
- Gupta B, Huang B. Mechanism of salinity tolerance in plants: physiological, biochemical, and molecular characterization. International Journal of Genomics. 2014;2014:701596.
- Zhu JK. Plant salt tolerance. Trends in Plant Science. 2001;6(2):66-71.
- Rengasamy P. World salinization with emphasis on Australia. Journal of Experimental Botany. 2006;57(5):1017-1023.
- Ashraf M. Some important physiological selection criteria for salt tolerance in plants. Flora. 2004;199(5):361-376.
- Maathuis FJM, Amtmann A. K+ nutrition and Na+ toxicity: the basis of cellular K+/Na+ ratios. Annals of Botany. 1999;84(2):123-133.
- Deinlein U, Stephan AB, Horie T, et al. Plant salttolerance mechanisms. Trends in Plant Science. 2014;19(6):371-379.
- Hasegawa PM, Bressan RA, Zhu JK, Bohnert HJ. Plant cellular and molecular responses to high salinity. Annual Review of Plant Physiology. 2000;51:463-499.
- Qadir M, Quillerou E, Nangia V, et al. Economics of salt-induced land degradation and restoration. Natural Resources Forum. 2014;38(4):282-295.