
Research article · 2025 · Full text
International Journal of Geography Geology and EnvironmentGeographic analysis of renewable energy transition patterns in European Union countries
Volume 7(11) · Pages 174–177 · DOI: 10.22271/27067483.2025.v7.i11c.702 ↗
Research areasRenewable Energy and SustainabilityRenewable energy and sustainable power systemsIntegrated Energy Systems Optimization
Abstract
Author-writtenThe pace and trajectory of renewable energy (RE) transition vary markedly among EU member states, reflecting differences in resource endowments, policy environments, market structures, and societal preferences. This research presents a geographic analysis across the EU-27 for 2010-2023 using spatial statistics and composite indicator analysis to identify transition clusters and evaluate drivers of heterogeneity. Five composite indicators were constructed: capacity addition pace, technology diversification, grid integration advancement, investment intensity, and policy ambition. Cluster analysis identified four groups: Nordic leaders (DK, SE, FI, AT; >40% RE share; hydro/wind driven), Mediterranean solar adopters (ES, IT, GR, PT; rapid PV growth), Central European laggards (PL, CZ, HU, BG; fossil-dependent; lowest policy scores), and mixed-strategy transitioners (DE, FR, NL, BE, IE; moderate shares with aggressive recent additions). Policy framework strength was the strongest predictor of transition pace (partial R² = 0.38), followed by wind/solar resource availability (0.24) and GDP per capita (0.15). The geographic clustering suggests that regional demonstration effects and policy diffusion mechanisms supplement resource and economic drivers. Achieving collective EU targets requires differentiated support for lagging member states.
Summary
Source-checkedPlain-language reading of the full paper, prepared with AI and checked against the text. Each point links to the authors' own words.
Why it matters
- The European Union has set a target to achieve at least 42.5% renewable energy in its gross final energy consumption by the year 2030. View evidence ↗
- Different geographic factors, such as wind regimes, hydropower potential, and solar irradiance, create varying opportunities for renewable energy adoption across the region. View evidence ↗
- Prior research often focused on single technologies or specific policies, leaving a gap in integrated geographic analyses that examine the full transition spectrum and spatial clustering across member states. View evidence ↗
The question
- The study aims to analyze the EU-27 from 2010 to 2023 to identify spatial clusters of renewable energy transition and evaluate the factors causing differences in progress. View evidence ↗
What they did
- The researchers used annual renewable energy capacity, generation, and share data from 2010-2023, sourced from IRENA and Eurostat and broken down by specific technologies. View evidence ↗
- Five composite indicators were developed to measure the transition: policy comprehensiveness, cumulative investment per GDP, grid flexibility, Shannon diversity of the RE portfolio, and capacity addition CAGR. View evidence ↗
- The study employed multiple regression to evaluate predictors of transition pace and used hierarchical cluster analysis with Ward linkage and Euclidean distance to group member states. View evidence ↗
What they found
- The 'Nordic Leaders' cluster (Denmark, Sweden, Finland, Austria) achieved the highest mean renewable energy share of 54%, driven primarily by wind and hydro. View evidence ↗
- The 'Central European' cluster (Poland, Czech Republic, Hungary, Bulgaria) had the lowest mean renewable energy share at 14%, with biomass as the dominant technology. View evidence ↗
- The 'Mediterranean Solar' cluster (Spain, Italy, Greece, Portugal) showed a mean renewable energy share of 28%, dominated by solar PV. View evidence ↗
- The 'Mixed Strategy' cluster (Germany, France, Netherlands, Belgium, Ireland) had a mean renewable energy share of 22%, utilizing both wind and solar. View evidence ↗
- Technology diversification varied by group: Nordic leaders had the highest mean diversity (1.72), Mediterranean adopters saw the steepest increase (0.85 to 1.38), and Central European laggards were the least diversified (mean 0.64). View evidence ↗
- Policy framework strength was the strongest predictor of transition pace, with a partial R² of 0.38 and a coefficient of +0.52. View evidence ↗
- The wind/solar resource index was the second most influential predictor, with a partial R² of 0.24 and a coefficient of +0.41. View evidence ↗
- GDP per capita also significantly predicted transition pace, contributing a partial R² of 0.15. View evidence ↗
- Market liberalisation had the smallest impact among the predictors, with a partial R² of 0.08. View evidence ↗
What it means
- The authors conclude that to meet collective EU targets, support must be differentiated to address the specific barriers faced by member states that are lagging in their transition. View evidence ↗
- The authors suggest that future research should develop sub-national transition indicators and investigate the causal mechanisms of policy diffusion. View evidence ↗
Visual summary
3 visualsIllustrations explain the paper; charts are replotted from the paper's own table values.
Hierarchy of Transition Drivers
AI-generated conceptual illustration (European Union map with renewable energy infrastructure). It explains the idea and does not show study data.
View source evidence ↗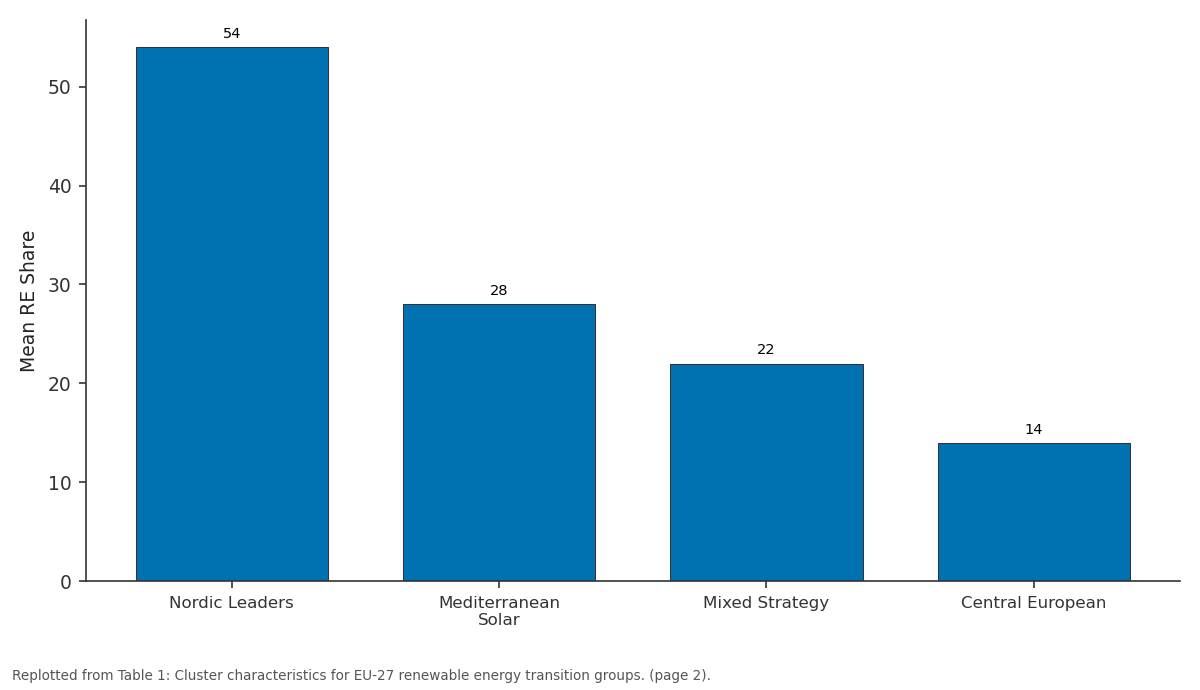
Mean RE Share: Nordic Leaders vs Mediterranean Solar vs Mixed Strategy vs Central European
Replotted from Table 1 (page 2) of the original paper. Every bar is the paper's own table value.
View source evidence ↗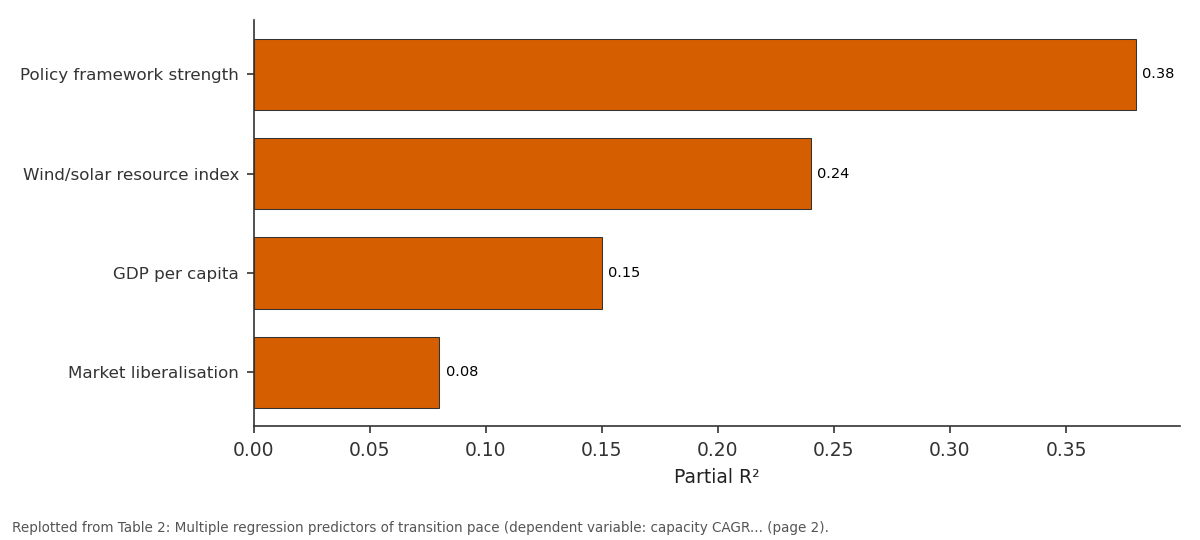
Partial R²: Policy framework... vs Wind/solar resource... vs GDP per capita vs Market liberalisation
Replotted from Table 2 (page 2) of the original paper. Every bar is the paper's own table value.
View source evidence ↗Figures & tables
From the original paper Table 1
 Table 2
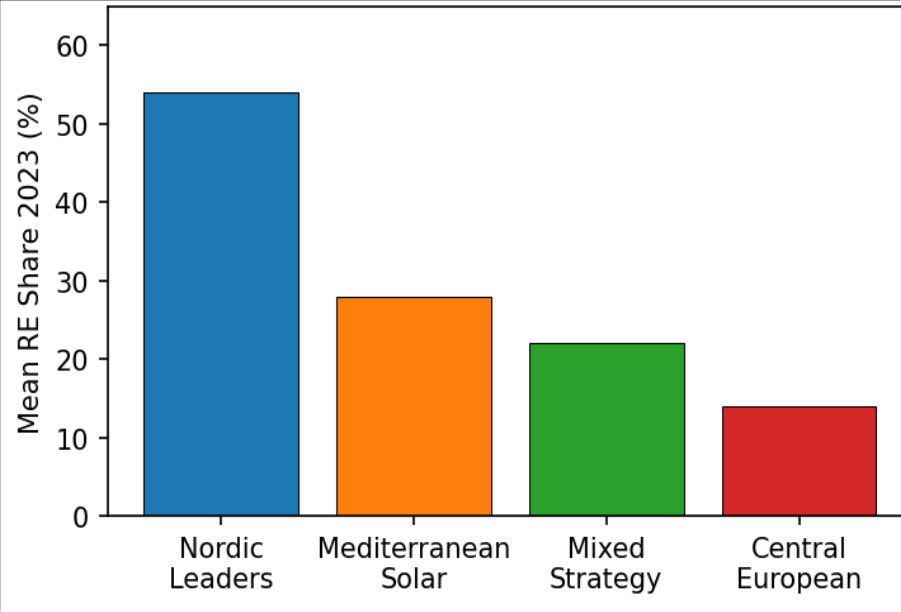 Figure 1
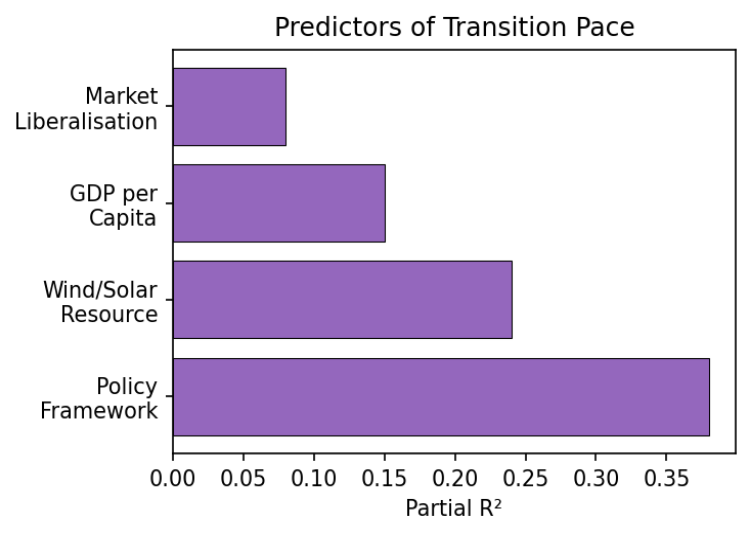 Figure 2
Introduction
The EU has established targets requiring ≥42.5% RE in gross final energy consumption by 2030 [1] . Achievement requires sustained acceleration across all member states, yet current progress varies enormously. Geographic factors-solar irradiance, wind regimes, hydropower potential create different opportunity sets. Beyond resources, industrial structure, policy environment, and proximity to innovative neighbours influence trajectories [2, 3] . Previous research adopted either technology-specific perspectives examining individual technologies or policy-centred perspectives evaluating specific instruments [4,5] . Few adopted integrated geographic approaches examining the full transition spectrum simultaneously and exploring spatial clustering of trajectories across member states [6] . This research fills this gap through comprehensive analysis of the EU-27 for 2010-2023, integrating deployment data, policy frameworks, market conditions, and resource endowments to construct composite indicators, identify spatial clusters, and evaluate the factors driving spatial heterogeneity in transition progress [7,8] . Understanding these geographic patterns has direct policy relevance, as the identification of transition clusters and their drivers can inform the design of differentiated EU support mechanisms that address the specific barriers faced by slower-transitioning states while maintaining momentum in the more advanced groups [9,10] .
Research Area Description
The EU-27 spans from Nordic latitudes (60°N+) to Mediterranean (~35°N), with diverse energy landscapes. Northern states have superior wind and hydropower resources; southern states enjoy higher solar irradiance. Industrial structure ranges from coal-dependent (Poland, Czech Republic) to service-dominated economies. Electricity market liberalisation varies from fully unbundled to largely state-controlled systems. Cross-border interconnection capacity varies from >30% of installed capacity (Nordic) to <10% (Iberian Peninsula) [2,3] .
Material and Methods
Material and Methods
Material
Annual RE capacity, generation, and share data from Eurostat and IRENA for 2010-2023 were disaggregated by technology (onshore/offshore wind, solar PV, CSP, hydro, biomass, biogas, geothermal, marine). Policy data from the RES Legal database recorded support mechanisms by member state. Market data from ACER provided liberalisation indices and wholesale prices. Resource indices from the Global Solar Atlas and Global Wind Atlas quantified natural endowments [1,11] .
Methods
Five composite indicators were constructed: capacity addition CAGR, Shannon diversity of RE portfolio, grid flexibility score (interconnection + storage + demand response), cumulative investment per GDP, and policy comprehensiveness rating. Hierarchical cluster analysis (Ward linkage, Euclidean distance) identified member state groups; optimal cluster count was determined by silhouette coefficient. Multiple regression evaluated predictors of transition pace [7,12] .
Technology Portfolio Diversification Trends
The Shannon diversity index increased across all clusters between 2010 and 2023, reflecting general technology diversification. Nordic leaders maintained the highest diversity (mean 1.72) due to balanced wind, hydro, and biomass contributions. Mediterranean adopters showed the steepest diversity increase (0.85 to 1.38) as rapid solar PV complemented existing hydro. Central European laggards remained least diversified (mean 0.64), with biomass and small hydro dominating a modest RE portfolio [5,6] . Policy framework strength dominates the explanatory power (Figure 2), followed by resource availability and economic capacity. Market liberalisation contributes modestly.
Results
Results
Comprehensive Interpretation
The four clusters reflect the combined influence of resource endowments, policy traditions, economic capacity, and regional interactions. The geographic contiguity of cluster members suggests that neighbourhood effects amplify national-level drivers through policy learning and demonstration effects across borders.
Discussion
Policy framework strength as the dominant predictor (partial R² = 0.38) underscores that governance shapes transition more than resource availability alone [2,4] . The Nordic cluster's early commitment predates EU-wide targets, reflecting shared regional environmental values. The Central European cluster's shared resistance reflects structural coal dependencies and political economy constraints that uniform EU targets alone cannot overcome [5,9] . Sub-national analysis within Germany revealed that internal heterogeneity can rival between-country variation, suggesting that sub-national factors may be as important as national policy [6] . Cross-border interconnection analysis showed lower RE curtailment in well-connected states (Nordic), while the Iberian Peninsula suffered higher curtailment from limited French interconnection. Future research should examine the causal mechanisms of policy diffusion and develop sub-national transition indicators [10,13,14] .
Conclusion
Four distinct transition clusters characterise the EU-27 RE landscape. Policy framework strength is the primary driver of transition pace, followed by resource availability and economic capacity. The geographic clustering suggests that regional demonstration and policy diffusion mechanisms operate alongside national-level factors. Achieving collective targets requires differentiated support that addresses specific barriers in lagging member states. Regional cooperation initiatives that leverage neighbourhood effects could accelerate convergence between faster and slower transitioning states, complementing EU-wide targets with geographically targeted implementation support.
Acknowledgement
Acknowledgements Funding SourcesThis research was supported by departmental research funds from the Department of Geophysics, National Geological Institute of Srinagar. No external grant numbers are associated with this work.
Figures and tables from the paper
| Cluster | Members | Mean RE Share | Dominant Tech. | Policy Score |
|---|---|---|---|---|
| Nordic Leaders | DK, SE, FI, AT | 54% | Hydro, Wind | 8.7/10 |
| Mediterranean Solar | ES, IT, GR, PT | 28% | Solar PV | 6.8/10 |
| Mixed Strategy | DE, FR, NL, BE, IE | 22% | Wind, Solar | 7.2/10 |
| Central European | PL, CZ, HU, BG | 14% | Biomass | 3.9/10 |
Table text extracted from the original PDF; superscript letters are shown inline. The original table image is below.
View original table image
| Predictor | Partial R² | Coefficient | p-value |
|---|---|---|---|
| Policy framework strength | 0.38 | +0.52 | <0.001 |
| Wind/solar resource index | 0.24 | +0.41 | <0.001 |
| GDP per capita | 0.15 | +0.28 | 0.003 |
| Market liberalisation | 0.08 | +0.18 | 0.032 |
Table text extracted from the original PDF; superscript letters are shown inline. The original table image is below.
View original table image
References
18 in the original paper- International Renewable Energy Agency (IRENA). Renewable power generation costs in 2019. Abu Dhabi: International Renewable Energy Agency; 2020.
- Jacobsson S, Lauber V. The politics and policy of energy system transformation. Energy Policy. 2006;34(3):256-276.
- Biesbroek GR, Swart RJ, van der Knaap WGM. The mitigation-adaptation dichotomy and spatial planning. Habitat International. 2009;33(3):230-237.
- Kitzing L, Mitchell C, Morthorst PE. Renewable energy policies in Europe: converging or diverging? Energy Policy. 2012;51:192-201.
- Szulecki K, Fischer S, Gullberg AT, Sartor O. Shaping the energy union: between national positions and governance innovation. Climate Policy. 2016;16(5):548-567.
- Strambo C, Nilsson M, Månsson A. Coherent or inconsistent? Assessing energy security and climate policy interaction. Energy Research and Social Science. 2015;8:1-12.
- Ward JH. Hierarchical grouping to optimize an objective function. Journal of the American Statistical Association. 1963;58(301):236-244.
- Shannon CE. A mathematical theory of communication. Bell System Technical Journal. 1948;27(3):379-423.
- Geels FW. Regime resistance against low-carbon transitions: introducing politics and power into the multi-level perspective. Theory, Culture and Society. 2014;31(5):21-040.
- Pe'er G, Dicks LV, Visconti P, et al. EU agricultural reform fails on biodiversity. Science. 2014;344(6188):1090-1092.
- Solargis. Global Solar Atlas 2.0. Washington (DC): World Bank Group; 2020.
- Kaufman L, Rousseeuw PJ. Finding groups in data: an introduction to cluster analysis. New York: John Wiley and Sons; 1990. p. 342.
- Helm D. The European framework for energy and climate policies. Energy Policy. 2014;64:29-35.
- Lilliestam J, Hanger S. Shades of green: centralisation, decentralisation and controversy among European renewable electricity visions. Energy Research and Social Science. 2016;17:20-29.
- Mazzucato M, Semieniuk G. Public financing of innovation: new questions. Oxford Review of Economic Policy. 2018;34(1):24-048.
- Edenhofer O, Hirth L, Knopf B, et al. On the economics of renewable energy sources. Energy Economics. 2013;40(S1):S12-S23.
- Johnstone N, Hascic I, Popp D. Renewable energy policies and technological innovation. Environmental and Resource Economics. 2010;45(1):133-155.
- Sovacool BK. Conceptualizing the temporal dynamics of energy transitions. Energy Research and Social Science. 2016;13:202-215.