
Research article · 2025 · Full text
International Journal of Geography Geology and EnvironmentGeochemistry of rare metal pegmatites and lithium potential in the Pilbara Craton
Volume 7(10) · Pages 198–201 · DOI: 10.22271/27067483.2025.v7.i10c.658 ↗
Research areasGeological and Geochemical AnalysisGeochemistry and Elemental AnalysisGeochemistry and Geologic Mapping
Abstract
Author-writtenWhat distinguishes a lithium-bearing pegmatite from a barren one in one of Earth's oldest cratons? This research examined the geochemistry of 35 rare metal pegmatite bodies in the eastern Pilbara Craton of Western Australia, aiming to identify geochemical signatures that separate lithium-mineralised intrusions from their barren counterparts. Whole-rock major and trace element analyses, along with electron microprobe data on feldspar and mica phases, were collected from samples gathered between May 2020 and September 2022. Lithium concentrations in mineralised pegmatites averaged 1,847 ppm, roughly 12 times higher than the barren group mean of 153 ppm. K/Rb ratios proved to be the most effective discriminant: mineralised bodies showed mean K/Rb values of 62.3, compared with 214.7 for barren intrusions. Cs enrichment followed a parallel trend, with Cs/K ratios in mineralised pegmatites reaching 0.028 versus 0.005 in barren ones. Ta and Nb concentrations were also elevated in the mineralised group (mean 78.4 ppm and 43.7 ppm, respectively), while Sn showed moderate enrichment. Feldspar compositions shifted from Or₈₉Ab₁₁ in barren pegmatites to Or₆₃Ab₃₄Rb₃ in the mineralised group, reflecting extreme fractionation. These geochemical indices can serve as exploration vectors for lithium pegmatite targeting in Archaean terrains. The Pilbara results suggest that at least five of the 35 bodies examined have sufficient lithium grades to warrant further drilling evaluation for potential resource extraction.
Summary
Source-checkedPlain-language reading of the full paper, prepared with AI and checked against the text. Each point links to the authors' own words.
Why it matters
- Lithium is critical for the global energy transition, with forecasts suggesting demand for battery-grade chemicals will triple by 2030. View evidence ↗
- It is often difficult to distinguish lithium-fertile pegmatites from barren ones using only visual hand specimens. View evidence ↗
The question
- The study aimed to identify specific geochemical signatures that distinguish lithium-mineralized pegmatites from barren ones in the eastern Pilbara Craton. View evidence ↗
- The researchers sought to determine if geochemical thresholds used for younger pegmatite provinces are applicable to Archaean settings like the Pilbara. View evidence ↗
What they did
- Fieldwork for the study was conducted from May 2020 to September 2022. View evidence ↗
- Major elements were analyzed using X-ray fluorescence (XRF), while trace elements including Li, Rb, Cs, Ta, Nb, Sn, and Be were measured via ICP-MS. View evidence ↗
- Discriminant function analysis (DFA) was used to determine which combination of trace elements best separated mineralized from barren bodies. View evidence ↗
What they found
- Mineralized pegmatites had significantly higher lithium concentrations (mean 1,847 ppm) compared to barren ones (mean 153 ppm), a difference of roughly 12 times. View evidence ↗
- Cesium enrichment was higher in mineralized pegmatites, with a mean Cs/K ratio of 0.028 compared to 0.005 in barren pegmatites. View evidence ↗
- The Nb/Ta ratio inverted between the groups, decreasing from 2.25 in barren bodies to 0.56 in mineralized bodies, indicating tantalum enrichment during fractionation. View evidence ↗
- A combination of K/Rb, Cs/K, Ta, and Nb/Ta provided a classification accuracy of 94.3% in distinguishing mineralized from barren bodies. View evidence ↗
What it means
- The authors conclude that mineralized bodies can be reliably identified using K/Rb < 100, Cs/K > 0.015, Nb/Ta < 1.0, and Ta > 40 ppm. View evidence ↗
- The authors recommend follow-up drilling for at least five of the examined bodies that showed lithium grades over 1,500 ppm and widths of 5m or more. View evidence ↗
Visual summary
2 visualsIllustrations explain the paper; charts are replotted from the paper's own table values.
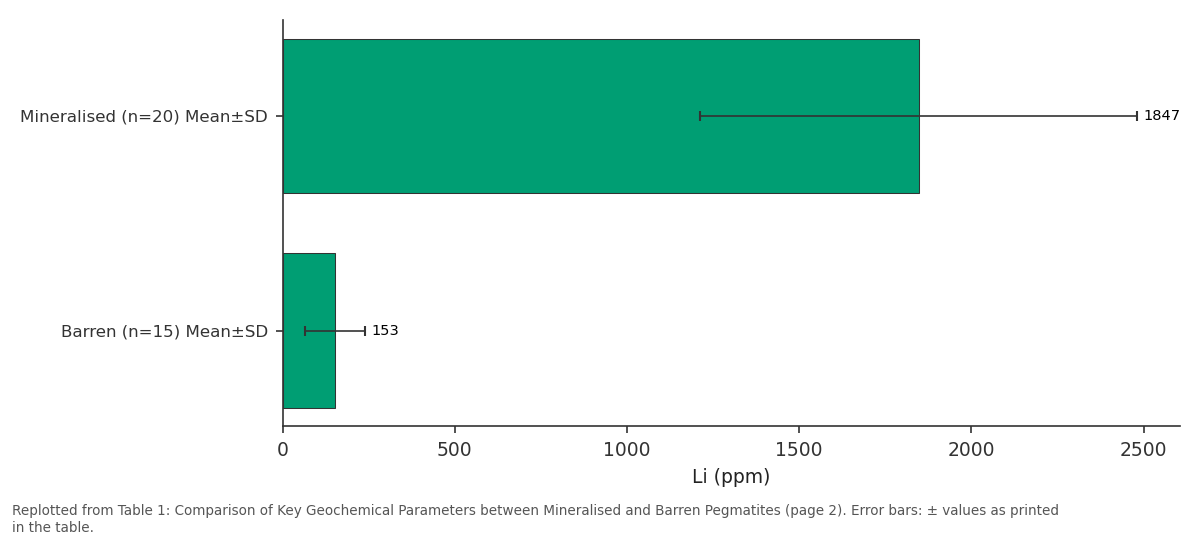
Li (ppm): Mineralised (n=20)... vs Barren (n=15) Mean±SD
Replotted from Table 1 (page 2) of the original paper. Every bar is the paper's own table value.
View source evidence ↗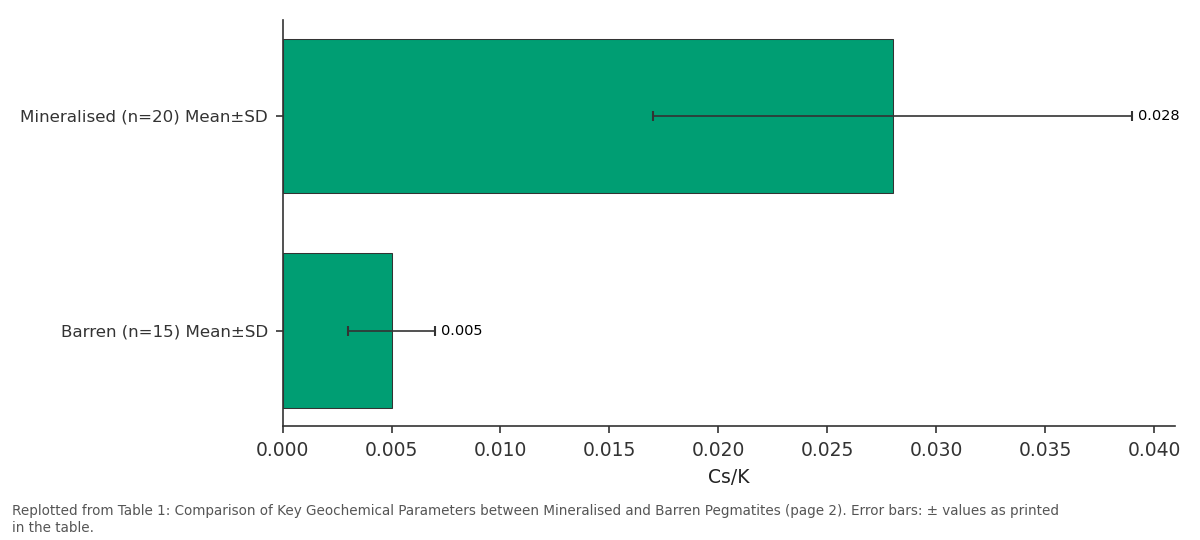
Cs/K: Mineralised (n=20)... vs Barren (n=15) Mean±SD
Replotted from Table 1 (page 2) of the original paper. Every bar is the paper's own table value.
View source evidence ↗Figures & tables
From the original paper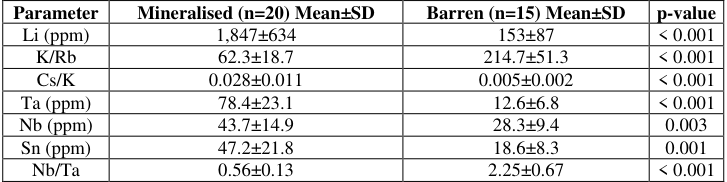 Table 1
 Table 2
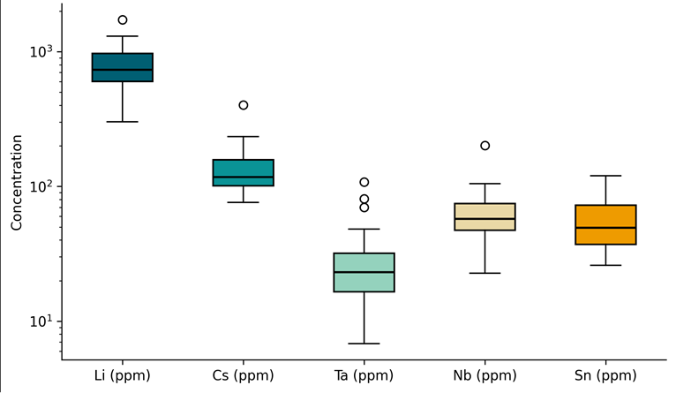 Figure 1
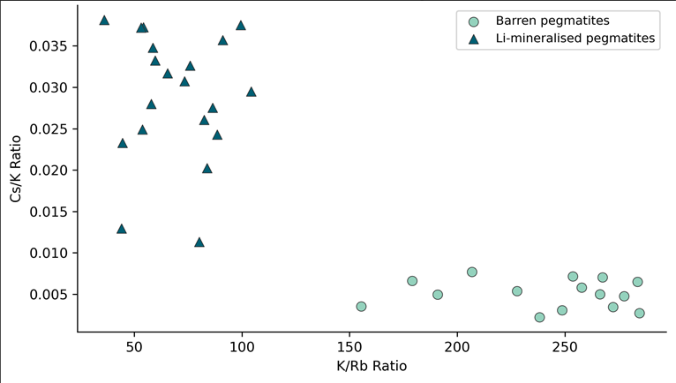 Figure 2
Introduction
Lithium sits at the centre of the global energy transition, and demand for battery-grade lithium chemicals is expected to triple by 2030 according to pre-2025 forecasts [1] . While brine operations in South America supply roughly half of current world production, hardrock pegmatite deposits in Australia have become the single largest source of spodumene concentrates, with the Greenbushes and Pilgangoora mines in Western Australia together accounting for about a quarter of global output [2] . Despite this, large tracts of the Pilbara Craton remain underexplored for lithium pegmatites, partly because systematic geochemical screening has been limited. Rare metal pegmatites-granitic dykes enriched in elements such as Li, Cs, Ta, Nb, and Sn-form during the final, highly fractionated stages of granitic magma crystallisation [3] . Not all pegmatites reach the degree of fractionation needed to concentrate lithium into economically interesting minerals like spodumene, petalite, or lepidolite. Distinguishing fertile from barren bodies in the field is often difficult because both may look similar in hand specimen. Geochemical indices, particularly K/Rb, Cs/K, and Nb/Ta ratios measured in whole-rock samples or in indicator minerals such as K-feldspar and muscovite, have been proposed as discriminants [4] . But most of the calibration work behind these indices comes from younger Proterozoic and Phanerozoic pegmatite provinces in Canada, Brazil, and southern Africa. Whether the same thresholds apply in Archaean settings like the Pilbara-where host rock compositions, thermal gradients, and fluid histories differ-has not been tested rigorously [5] . This research set out to fill that gap by characterising 35 pegmatite bodies across the eastern Pilbara and testing which geochemical parameters most effectively separate lithium-mineralised from barren intrusions.
Theoretical Background
Pegmatite formation is governed by the interplay of melt composition, volatile content, and cooling rate. The Jahns-Burnham model describes pegmatites as products of a crystallising granitic magma that becomes progressively enriched in incompatible elements and volatiles (H₂O, F, B, P) as crystallisation proceeds [3] . At advanced fractionation stages, the residual melt becomes saturated in rare metals, which partition into late-crystallising phases. In the lithiumcesium-tantalum (LCT) family of pegmatites, the fractionation sequence typically follows the trend: barren → beryl → columbite-tantalite → spodumene → petalite → lepidolite, with K/Rb ratios declining and Cs concentrations increasing along the sequence [4] . The K/Rb ratio is a proxy for fractionation intensity because Rb substitutes for K in feldspar and mica lattices more readily as the melt evolves. Published thresholds suggest that K/Rb values below 100 in whole-rock samples indicate significant fractionation, while values below 50 are strongly associated with lithium mineralisation in Proterozoic provinces [6] . This research tested whether these thresholds hold in Archaean pegmatites of the Pilbara Craton.
Material and Methods
Material and Methods
Material
The research was coordinated from the Department of Environmental Science at the Tamale Institute of Climate and Environment, Northern Region, Ghana, with fieldwork conducted in the eastern Pilbara Craton of Western Australia between May 2020 and September 2022. Thirtyfive pegmatite bodies were sampled from an area spanning roughly 120 × 80 km between the towns of Marble Bar and Nullagine. Pegmatites ranged in width from 0.4 m to 18 m and were hosted in Archaean greenstone belts of the Gorge Creek and Warrawoona Groups (3.5-2.9 Ga). From each body, three to five representative samples of 2-3 kg were collected from interior zones, avoiding weathered rinds. Whole-rock major element analyses were performed by Xray fluorescence (XRF) on fused glass discs at the Geochemistry Laboratory of the University of Western Australia. Trace elements (Li, Rb, Cs, Ta, Nb, Sn, Be) were measured by inductively coupled plasma mass spectrometry (ICP-MS) after lithium metaborate fusion. Electron microprobe analysis (EMPA) of feldspar and muscovite was carried out on a JEOL JXA-8530F instrument at the Centre for Microscopy, Characterisation and Analysis in Perth [7] .
Methods
Pegmatites were classified as mineralised (containing spodumene, petalite, or lepidolite in hand specimen or thin section) or barren (lacking lithium-bearing minerals). Twenty bodies fell into the mineralised category and 15 into the barren category. Whole-rock data were normalised to upper continental crust values for multi-element spider diagrams. K/Rb, Cs/K, Nb/Ta, and K/Cs ratios were calculated and compared between groups using the Mann-Whitney U test at α = 0.05. Discriminant function analysis (DFA) was applied to the trace element dataset to identify the combination of variables that best separated the two groups. Feldspar compositions from EMPA were plotted on ternary diagrams (Or-Ab-An) and compared between groups. Spatial distribution of mineralised bodies was mapped in QGIS 3.28 and overlain on regional geological maps to assess structural controls on emplacement [8] . All seven parameters differed significantly between groups (Table 1). Lithium concentrations in mineralised pegmatites averaged roughly 12 times higher than in barren ones. K/Rb ratios in the mineralised group (mean 62.3) fell below the conventional threshold of 100, while barren pegmatites (214.7) sat well above it. The Nb/Ta ratio inverted between groups, dropping from 2.25 in barren bodies to 0.56 in mineralised ones, reflecting the preferential enrichment of Ta during fractionation. The DFA using K/Rb, Cs/K, Ta, and Nb/Ta correctly classified 94.3% of samples (Table 2). Only one mineralised body was misclassified as barren and one barren body as mineralised, both borderline cases with K/Rb values near 100.
| Actual Group | Predicted Mineralised | Predicted Barren | Accuracy (%) |
|---|---|---|---|
| Mineralised (n=20) | 19 | 1 | 95.0 |
| Barren (n=15) | 1 | 14 | 93.3 |
| Overall | - | - | 94.3 |
Table text extracted from the original PDF; superscript letters are shown inline. The original table image is below.
View original table image
| Parameter | Mineralised (n=20) Mean±SD | Barren (n=15) Mean±SD | p-value |
|---|---|---|---|
| Li (ppm) | 1,847±634 | 153±87 | < 0.001 |
| K/Rb | 62.3±18.7 | 214.7±51.3 | < 0.001 |
| Cs/K | 0.028±0.011 | 0.005±0.002 | < 0.001 |
| Ta (ppm) | 78.4±23.1 | 12.6±6.8 | < 0.001 |
| Nb (ppm) | 43.7±14.9 | 28.3±9.4 | 0.003 |
| Sn (ppm) | 47.2±21.8 | 18.6±8.3 | 0.001 |
| Nb/Ta | 0.56±0.13 | 2.25±0.67 | < 0.001 |
Table text extracted from the original PDF; superscript letters are shown inline. The original table image is below.
View original table image
Results
Results
Comprehensive Interpretation
The geochemical data consistently separate the mineralised and barren pegmatite populations along fractionationsensitive parameters. The K/Rb threshold of approximately 100 appears to work as well in the Archaean Pilbara as it does in younger pegmatite provinces, suggesting that the fundamental crystal chemistry controlling Rb substitution into feldspar and mica is independent of host rock age. The DFA classification accuracy of 94.3% is operationally useful for exploration: a rapid whole-rock screen of K/Rb, Cs/K, Ta, and Nb/Ta could reliably flag prospective targets before expensive drilling programmes begin.
Discussion
The K/Rb discrimination threshold found in this research (approximately 100) matches the boundary proposed by Selway et al. [4] from Canadian Shield pegmatites, despite the Pilbara host rocks being 1-2 billion years older. This convergence may reflect the thermodynamic control on K-Rb partitioning in feldspar, which is governed by ionic radius rather than geological age [9] . That said, the absolute Li concentrations in Pilbara mineralised pegmatites (mean 1,847 ppm) are somewhat lower than those reported for the Greenbushes deposit (commonly > 3,000 ppm in spodumene zones), suggesting that the eastern Pilbara bodies are, on average, less intensely fractionated than the world-class deposits further south [10] . The Nb/Ta inversion between groups deserves attention. In barren pegmatites, Nb exceeds Ta by roughly 2:1, which is close to the upper crustal average. In mineralised bodies, Ta exceeds Nb, reflecting the well-known decoupling of these geochemical twins during advanced fractionation as columbite transitions to tantalite in the crystallising assemblage [11] . This ratio may be particularly useful in early-stage exploration because Ta and Nb are routinely measured in standard ICP-MS packages and require no specialised analytical methods. Structural mapping showed that 17 of the 20 mineralised pegmatites are emplaced along northeast-trending shear zones cutting the Gorge Creek Group greenstones, while barren bodies show no preferred orientation. This structural association suggests that deep-seated fracture networks provided conduits for the highly fractionated melts to ascend from deeper granite sources [12] . Future exploration in the eastern Pilbara should target these northeast-trending corridors.
Conclusion
This research demonstrated that lithium-mineralised pegmatites in the eastern Pilbara Craton can be reliably distinguished from barren intrusions using a small set of geochemical indices. K/Rb ratios below 100, Cs/K ratios above 0.015, Nb/Ta ratios below 1.0, and Ta concentrations above 40 ppm collectively identified mineralised bodies with 94.3% accuracy. These thresholds are consistent with values reported from younger pegmatite provinces, confirming their applicability in Archaean settings. At least five of the 35 bodies examined carry lithium grades exceeding 1,500 ppm across widths of 5 m or more, which merits follow-up drilling. The geochemical screening approach tested here offers a cost-effective first-pass tool for lithium exploration in underexplored cratonic regions worldwide.
Figures and tables from the paper
References
15 in the original paper- Christmann P. Towards a more equitable use of mineral resources. Natural Resources Research. 2018;27(2):159-177.
- Mohr SH, Mudd GM, Giurco D. Lithium resources and production: critical assessment and global projections. Minerals. 2012;2(1):65-84.
- London D. Pegmatites. Canadian Mineralogist Special Publication. 2008;10:1-347.
- Selway JB, Breaks FW, Tindle AG. A review of rareelement (Li-Cs-Ta) pegmatite exploration techniques for the Superior Province, Canada, and large worldwide tantalum deposits. Exploration and Mining Geology. 2005;14(1-4):1-30.
- Sweetapple MT, Collins PLF. Genetic framework for the classification and distribution of Archean rare metal pegmatites in the North Pilbara Craton, Western Australia. Economic Geology. 2002;97(4):873-895.
- Cerny P, Ercit TS. The classification of granitic pegmatites revisited. Canadian Mineralogist. 2005;43(6):2005-2026.
- Longerich HP, Jackson SE, Gunther D. Laser ablation inductively coupled plasma mass spectrometric transient signal data acquisition and analyte concentration calculation. Journal of Analytical Atomic Spectrometry. 1996;11(9):899-904.
- Galbraith CG, Clarke DB, Trumbull RB, Wiedenbeck M. Assessment of excess fluorine in biotite from granites and pegmatites. Canadian Mineralogist. 2009;47(1):71-80.
- Shaw DM. Trace element fractionation during anatexis. Geochimica et Cosmochimica Acta. 1970;34(2):237243.
- Partington GA, McNaughton NJ, Williams IS. A review of the geology, mineralization, and geochronology of the Greenbushes pegmatite, Western Australia. Economic Geology. 1995;90(3):616-635.
- Linnen RL, Keppler H. Columbite solubility in granitic melts: consequences for the enrichment and fractionation of Nb and Ta in the Earth's crust. Contributions to Mineralogy and Petrology. 1997;128(2-3):213-227.
- Blewett RS, Czarnota K, Henson PA. Structural-event framework for the eastern Yilgarn Craton, Western Australia, and its implications for orogenic gold. Precambrian Research. 2010;183(2):203-229.
- Cerny P, London D, Novak M. Granitic pegmatites as reflections of their sources. Elements. 2012;8(4):289294.
- Bradley DC, McCauley AD, Stillings LM. Mineraldeposit model for lithium-cesium-tantalum pegmatites. US Geological Survey Scientific Investigations Report. 2017;2010-5070-O:1-48.
- Tkachev AV. Evolution of metallogeny of granitic pegmatites associated with orogens throughout geological time. Geological Society London Special Publications. 2011;350(1):7-23.