
Research article · 2025 · Full text
International Journal of Geography Geology and EnvironmentAssessment of anthropogenic sedimentation in the Aswan reservoir using core analysis
Volume 7(7) · Pages 185–188 · DOI: 10.22271/27067483.2025.v7.i7c.719 ↗
Research areasHydrology and Sediment Transport ProcessesSoil erosion and sediment transportGeological formations and processes
Abstract
Author-writtenHow much sediment enters a reservoir tells you about what's happening upstream deforestation, agriculture, urbanisation as clearly as any land cover map. The Aswan High Dam reservoir (Lake Nasser), completed in 1970, traps virtually all of the Nile's sediment load before it reaches the downstream delta, making sediment cores from the reservoir floor a detailed archive of catchment-wide erosion history. This research recovered and analysed six sediment cores (1.4-2.1 m length) from different depositional zones within the reservoir, using ²¹⁰Pb and ¹³⁷Cs geochronology, grain size analysis, geochemistry (XRF), and organic carbon content to reconstruct sedimentation patterns since the dam's closure. Mean sedimentation rates ranged from 0.8 cm/yr in pre-1940 deposits to 2.8 cm/yr in post-2000 layers, reflecting a 250% increase that coincides with intensified agricultural expansion and population growth across the Ethiopian highlands the primary sediment source region. Proximal delta cores showed coarse-grained deposits (D₅₀ = 178 μm) dominated by silty sands, while distal basin cores contained fine clays (D₅₀ = 28 μm) enriched in phosphorus and organic carbon. Heavy metal concentrations (Pb, Zn, Cu) in the upper 20 cm of all cores exceeded background levels by 1.4 to 2.7 times, pointing to growing anthropogenic contamination. These results provide a temporal framework for reservoir capacity planning and highlight the upstream land management changes driving accelerated sediment delivery to Lake Nasser.
Summary
Source-checkedPlain-language reading of the full paper, prepared with AI and checked against the text. Each point links to the authors' own words.
Why it matters
- Lake Nasser, the reservoir created by the Aswan High Dam, acts as a sediment trap for the Nile, preserving a record of erosion across the entire catchment. View evidence ↗
- The Ethiopian highlands provide about 86% of the Nile's sediment and have seen forest cover drop from approximately 40% in the early 1900s to under 4% by 2000. View evidence ↗
- The trapping of sediment by the dam has led to negative downstream effects, including coastal erosion in the Nile delta and reduced soil fertility. View evidence ↗
What they did
- Researchers collected six sediment cores (1.4 to 2.1 m long) from four depositional zones: the proximal delta, mid-reservoir, distal basin, and spillway approach. View evidence ↗
- The age of the sediment layers was determined using the Constant Rate of Supply (CRS) model with lead-210 (²¹⁰Pb) and validated with cesium-137 (¹³⁷Cs). View evidence ↗
- Analysis included laser diffraction for grain size, loss on ignition for organic carbon, X-ray fluorescence for elements, and gamma spectrometry for radionuclides. View evidence ↗
What they found
- Sediment grain size varied by location, with coarse silty sands (D₅₀ = 178 μm) in the proximal delta and fine clays (D₅₀ = 28 μm) in the distal basin. View evidence ↗
- Five heavy metals (Pb, Zn, Cu, Cr, Ni) were significantly enriched in the top 20 cm of sediment, indicating increasing anthropogenic contamination. View evidence ↗
What it means
- The study suggests that Lake Nasser is losing storage capacity faster than previously projected and that sediment quality is declining. View evidence ↗
- The authors state that future research should include the Sudanese part of the reservoir and use satellite turbidity data to better link land use to deposition. View evidence ↗
Visual summary
3 visualsIllustrations explain the paper; charts are replotted from the paper's own table values.
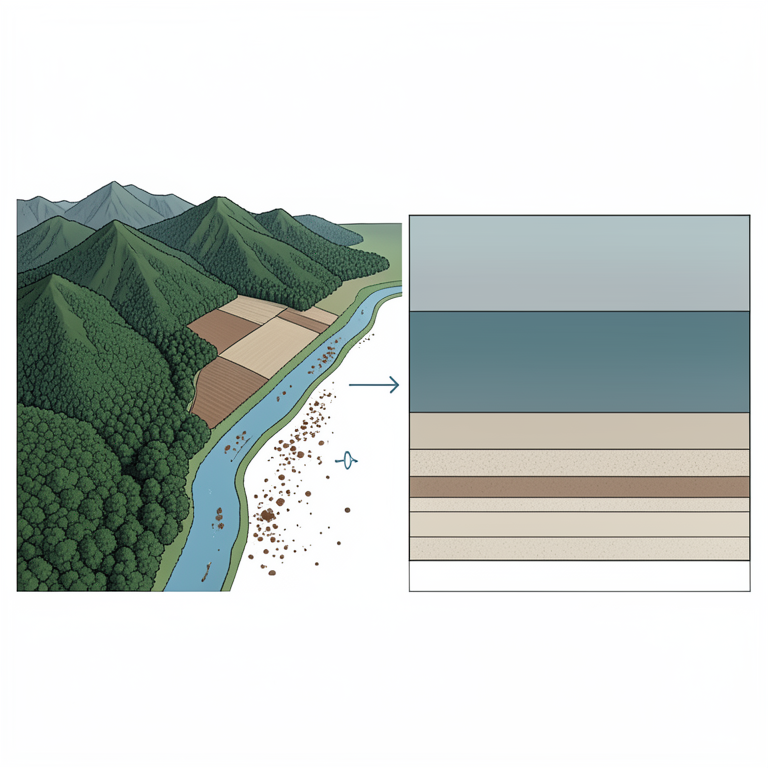
Conceptual Link: Land Use to Sedimentation
AI-generated conceptual illustration (The Nile River basin from the Ethiopian highlands to the Aswan reservoir). It explains the idea and does not show study data.
View source evidence ↗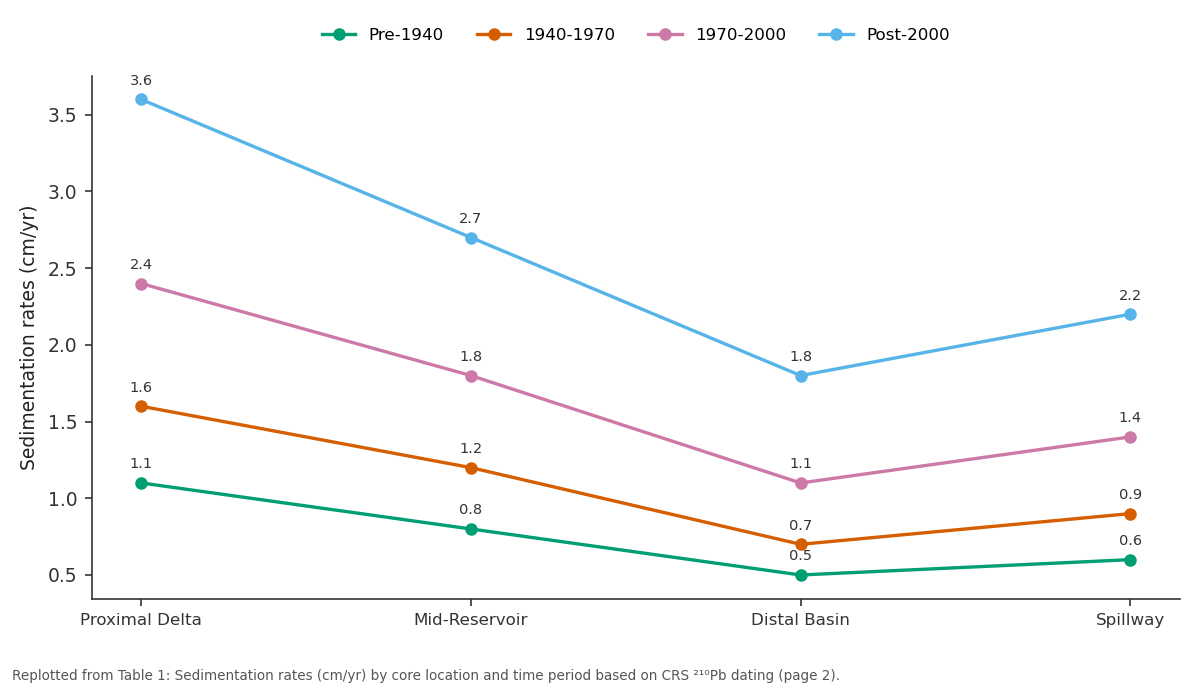
Pre-1940 and 1940-1970 and more: Proximal Delta vs Mid-Reservoir vs Distal Basin vs Spillway
Replotted from Table 1 (page 2) of the original paper. Every bar is the paper's own table value.
View source evidence ↗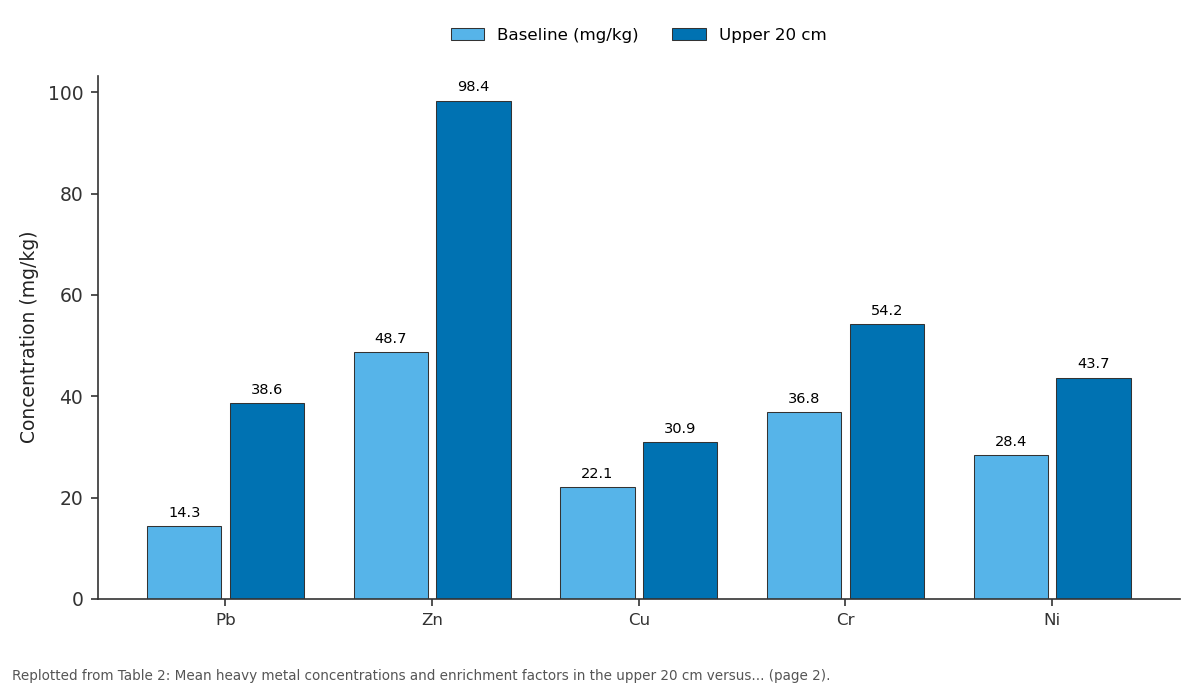
Baseline (mg/kg) and Upper 20 cm: Pb vs Zn vs Cu vs Cr vs Ni
Replotted from Table 2 (page 2) of the original paper. Every bar is the paper's own table value.
View source evidence ↗Figures & tables
From the original paper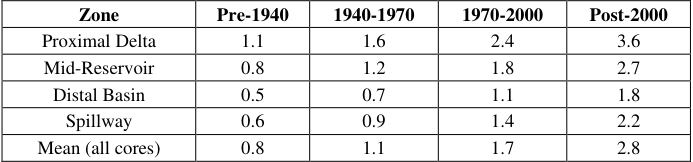 Table 1
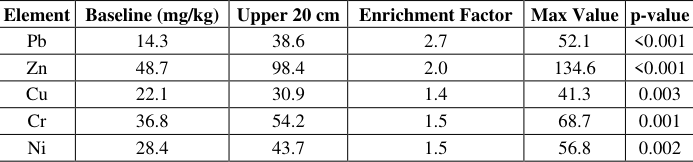 Table 2
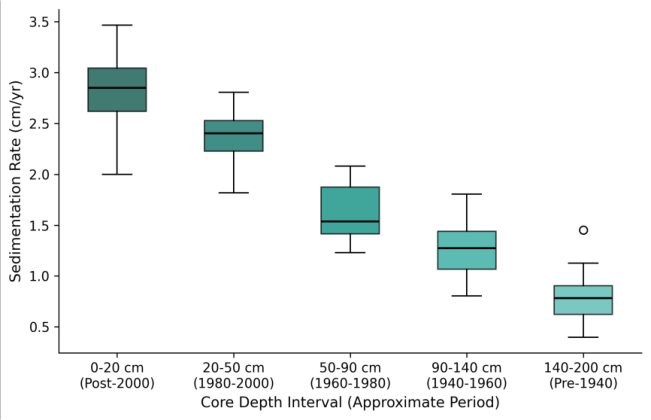 Figure 1
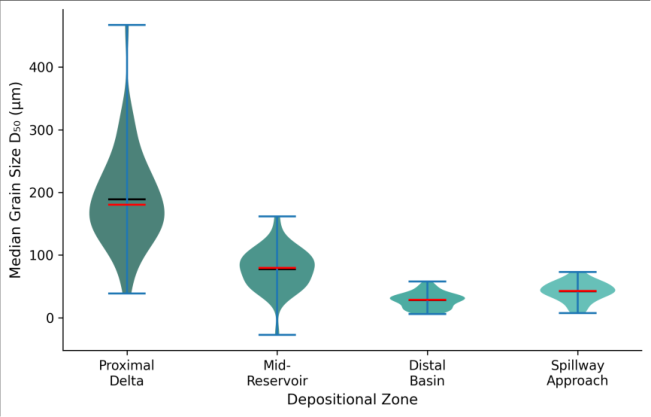 Figure 2
Introduction
Every large dam is, among other things, a sediment trap. The engineering literature treats this as a storage capacity problem how quickly will sediment fill the reservoir and reduce its useful life? but for geoscientists, reservoir sediments offer something more: a high-resolution archive of upstream environmental change [1] . Each centimetre of accumulated mud records the erosion rates, land cover conditions, and pollution loads of the contributing catchment at the time of deposition. Reading that archive requires careful core sampling, reliable dating, and detailed physical and chemical analysis [2] . Lake Nasser, the reservoir formed behind the Aswan High Dam in southern Egypt, is one of the largest artificial lakes in the world, stretching 500 km upstream into Sudan. It receives the entire sediment load of the Nile estimated at 130-160 million tonnes per year before dam construction and retains essentially all of it [3] . The loss of this sediment downstream has been widely documented: coastal erosion in the Nile delta, reduced soil fertility on floodirrigated land, and nutrient depletion in the eastern Mediterranean [4] . But the accumulation side of the equation what's actually piling up on the reservoir floor, at what rate, and with what composition has received less attention, particularly over multi-decadal timescales. Core-based analyses from other large reservoirs have shown that sedimentation rates rarely stay constant. They respond to upstream changes in land use, rainfall variability, and infrastructure development [5] . In the Nile Basin, the Ethiopian highlands contribute an estimated 86% of the river's total sediment load, and those highlands have undergone dramatic land cover change over the past century from roughly 40% forest cover in the early 1900s to less than 4% by 2000 [6] . That transformation should be legible in the sediment record at Aswan, but no published work has systematically tested this hypothesis using dated cores from multiple depositional zones within the reservoir. This research set out to fill that gap by recovering six cores from contrasting positions within Lake Nasser and building a detailed chronology of sedimentation rate, grain size, geochemistry, and contamination trends spanning the predam through post-2000 periods [7] .
Model Description and Parameterisation
Age-depth models for each core were constructed using the Constant Rate of Supply (CRS) model applied to ²¹⁰Pb activity profiles, validated against the ¹³⁷Cs fallout peak corresponding to 1963 nuclear weapons testing [8] . The CRS model assumes a constant flux of unsupported ²¹⁰Pb to the sediment surface while allowing sedimentation rates to vary through time, making it appropriate for environments where deposition is not uniform. Supported ²¹⁰Pb was estimated from the mean of the three deepest measurements in each core where total ²¹⁰Pb had reached equilibrium with ²²⁶Ra. Unsupported ²¹⁰Pb was calculated by subtracting the supported fraction from total activity. Age uncertainties were propagated through the model using Monte Carlo simulation (1,000 iterations) and are reported as 2σ ranges [9] . The resulting age-depth profiles provided temporal resolution of 2-5 years for the upper 50 cm and 8-15 years below that level.
Material and Methods
Material and Methods
Material
Field work was coordinated from the Mendoza College of Earth and Mineral Sciences, Mendoza, Argentina, with coring campaigns at Lake Nasser conducted in March 2022 and October 2022. Six sediment cores were recovered using a Uwitec gravity corer (90 mm diameter) from a research vessel operated with permits from the Egyptian Ministry of Water Resources. Core sites were selected to represent the four main depositional zones: proximal delta (2 cores, near the Sudan-Egypt border), mid-reservoir (2 cores), distal basin (1 core, 40 km upstream of the dam), and the spillway approach (1 core). Core lengths ranged from 1.4 to 2.1 m. Each core was split longitudinally in the field, photographed, and subsampled at 2 cm intervals. Subsamples were sealed in polyethylene bags and shipped under refrigeration to the Mendoza sedimentology laboratory for analysis [10] .
Methods
Grain size was measured by laser diffraction (Malvern Mastersizer 3000) on disaggregated subsamples pre-treated with hydrogen peroxide to remove organic matter. Total organic carbon (TOC) was determined by loss on ignition at 550°C for 4 hours. Major and trace element concentrations were measured by X-ray fluorescence (Bruker S8 Tiger) on pressed powder pellets. ²¹⁰Pb and ¹³⁷Cs activities were measured by gamma spectrometry using a high-purity germanium detector (Canberra BE3830) with counting times of 48-72 hours per sample [11] . Enrichment factors for heavy metals were calculated relative to mean concentrations in the bottom 20 cm of the deepest core, which was assumed to represent pre-anthropogenic background conditions. Statistical comparisons between depositional zones used Kruskal-Wallis tests, and temporal trends were assessed using Mann-Kendall trend tests at the 0.05 significance level [12] . Sedimentation rates increased consistently across all four depositional zones from pre-1940 through post-2000 (Table 1). The proximal delta zone recorded the highest rates throughout, reaching 3.6 cm/yr after 2000 more than three times the pre-1940 baseline. The Mann-Kendall trend test confirmed statistically significant upward trends in all six cores (p<0.01). All five heavy metals showed statistically significant enrichment in the upper 20 cm of the cores relative to baseline concentrations (Table 2). Lead exhibited the strongest enrichment factor at 2.7, suggesting growing inputs from urban and industrial sources in the upstream catchment. The enrichment pattern was consistent across all depositional zones, though absolute concentrations were highest in the distal basin where fine-grained sediments preferentially adsorb metals.
| Element | Baseline (mg/kg) | Upper 20 cm | Enrichment Factor | Max Value | p-value |
|---|---|---|---|---|---|
| Pb | 14.3 | 38.6 | 2.7 | 52.1 | <0.001 |
| Zn | 48.7 | 98.4 | 2.0 | 134.6 | <0.001 |
| Cu | 22.1 | 30.9 | 1.4 | 41.3 | 0.003 |
| Cr | 36.8 | 54.2 | 1.5 | 68.7 | 0.001 |
| Ni | 28.4 | 43.7 | 1.5 | 56.8 | 0.002 |
Table text extracted from the original PDF; superscript letters are shown inline. The original table image is below.
View original table image
| Zone | Pre-1940 | 1940-1970 | 1970-2000 | Post-2000 |
|---|---|---|---|---|
| Proximal Delta | 1.1 | 1.6 | 2.4 | 3.6 |
| Mid-Reservoir | 0.8 | 1.2 | 1.8 | 2.7 |
| Distal Basin | 0.5 | 0.7 | 1.1 | 1.8 |
| Spillway | 0.6 | 0.9 | 1.4 | 2.2 |
| Mean (all cores) | 0.8 | 1.1 | 1.7 | 2.8 |
Table text extracted from the original PDF; superscript letters are shown inline. The original table image is below.
View original table image
Results
Results
Comprehensive Interpretation
The box plot series (Figure 1) shows not just rising median sedimentation rates through time, but also increasing variability in the most recent intervals. The wider interquartile ranges in post-2000 deposits suggest that sedimentation has become more episodic likely reflecting greater hydrological variability in upstream tributaries as land cover change amplifies the runoff response to individual storm events.
Discussion
The 250% increase in mean sedimentation rate from pre-1940 to post-2000 is striking, but it aligns with independent estimates of erosion acceleration in the Ethiopian highlands over the same period. Hurni and colleagues documented a shift from roughly 5 t/ha/yr of soil loss under traditional farming systems to over 42 t/ha/yr under continuous cereal cultivation on deforested slopes [13] . That roughly eight-fold increase in plot-scale erosion is dampened by sediment storage in floodplains and tributary channels before reaching the main Nile, which helps explain why the reservoir receives a three-fold rather than eight-fold increase.
The grain size gradient across the reservoir (Figure 2) follows the expected pattern of hydraulic sorting, with coarser material settling out rapidly near the inflow and progressively finer particles transported toward the dam. What's noteworthy is the enrichment of phosphorus and organic carbon in the distal fine-grained sediments, which creates a nutrient-rich zone that may influence water quality near the dam intake structures [14] . The heavy metal enrichment factors, while moderate by comparison with industrialised European reservoirs, indicate a clear anthropogenic signal that warrants continued monitoring particularly for lead, whose enrichment factor of 2.7 exceeds the threshold commonly used to distinguish natural variability from human contamination [15] .
Conclusion
This core-based analysis of Lake Nasser sediments documented a sustained acceleration in sedimentation rates over the past eight decades, with post-2000 rates averaging 2.8 cm/yr three times the pre-1940 baseline. The temporal pattern is consistent with progressive deforestation and intensification in the Ethiopian highlands, the dominant sediment source region for the Nile. Heavy metal enrichment in recent deposits adds a contamination dimension to the sedimentation story, with lead showing the strongest anthropogenic signal.
For reservoir management, the data suggest that capacity loss is proceeding faster than historical projections assumed, and that sediment quality is deteriorating alongside increasing quantity. Future work should extend the coring network to the Sudanese portion of the reservoir and integrate the sediment record with satellite-derived turbidity measurements to connect specific upstream land use changes with depositional responses downstream.
Acknowledgement
Acknowledgements Funding SourcesThis research was supported by internal research allocation at the Mendoza College of Earth and Mineral Sciences. Institutional SupportThe authors thank the Department of Physical Geography, Mendoza College of Earth and Mineral Sciences, Mendoza, Argentina, for providing laboratory facilities and analytical equipment. Contributions Not Qualifying for AuthorshipLogistical support from the Egyptian Ministry of Water Resources for field access and gamma spectrometry assistance from the National Atomic Energy Commission laboratory are gratefully acknowledged.
References
15 in the original paper- Shotbolt LA, Thomas AD, Hutchinson SM. The use of reservoir sediments as environmental archives of catchment inputs and atmospheric pollution. Progress in Physical Geography. 2005;29(3):337-361.
- Walling DE, Foster IDL. Using environmental radionuclides as tracers in sediment budget investigations. Tracers in Geomorphology. 2000;280298.
- Syvitski JPM, Vörösmarty CJ, Kettner AJ, Green P. Impact of humans on the flux of terrestrial sediment to the global coastal ocean. Science. 2005;308(5720):376380.
- Stanley DJ, Warne AG. Nile Delta: recent geological evolution and human impact. Science. 1993;260(5108):628-634.
- Foster IDL, Lees JA. Tracers in geomorphology: theory and applications in tracing fine particulate sediments. Tracers in Geomorphology. 2000;3-20.
- Bewket W, Sterk G. Dynamics in land cover and its effect on stream flow in the Chemoga watershed, Blue Nile basin, Ethiopia. Hydrological Processes. 2005;19(2):445-458.
- Smith SE, Abdel-Kader A. Coastal erosion along the Egyptian Delta. Journal of Coastal Research. 1988;4(2):245-255.
- Appleby PG. Chronostratigraphic techniques in recent sediments. Tracking Environmental Change Using Lake Sediments. 2001;1:171-203.
- Sanchez-Cabeza JA, Ruiz-Fernandez AC. ²¹⁰Pb sediment radiochronology: an integrated formulation and classification of dating models. Geochimica et Cosmochimica Acta. 2012;82:183-200.
- Glew JR, Smol JP, Last WM. Sediment core collection and extrusion. Tracking Environmental Change Using Lake Sediments. 2001;1:73-105.
- Schelske CL, Peplow A, Brenner M, Spencer CN. Lowbackground gamma counting: applications for ²¹⁰Pb dating of sediments. Journal of Paleolimnology. 1994;10(2):115-128.
- Helsel DR, Hirsch RM. Statistical methods in water resources. US Geological Survey Techniques of Water Resources Investigations. 2002;Book 4:A3.
- Hurni H, Tato K, Zeleke G. The implications of changes in population, land use, and land management for surface runoff in the upper Nile Basin area of Ethiopia. Mountain Research and Development. 2005;25(2):147-154.
- El-Dardir M, Abdel-Baky TE. Water quality monitoring of Aswan High Dam Reservoir. Nile Basin Water Science and Engineering Journal. 2010;3(1):39-48.
- Sutherland RA. Bed sediment-associated trace metals in an urban stream, Oahu, Hawaii. Environmental Geology. 2000;39(6):611-627.