
Research article · 2025 · Full text
International Journal of Geography Geology and EnvironmentInfluence of lithology on weathering rates and landscape development in the blue ridge escarpment
Volume 7(7) · Pages 177–180 · DOI: 10.22271/27067483.2025.v7.i7c.717 ↗
Research areasSoil and Environmental StudiesGeography and Environmental StudiesGeochemistry and Elemental Analysis
Abstract
Author-writtenThe Blue Ridge Escarpment in the southern Appalachians marks one of the sharpest topographic transitions in eastern North America, dropping roughly 600 metres over a horizontal distance of less than 10 kilometres. What controls the rate at which this landscape wears down has been debated since the late 19th century, with lithology repeatedly invoked as a first-order control. This research measured chemical and physical weathering rates across four dominant rock types granite, gneiss, schist, and quartzite along the escarpment face in western North Carolina, using a combination of cosmogenic ¹⁰Be erosion rate estimates, stream solute loads, and regolith depth measurements. Field work was conducted from the Centre for Terrain Studies, Isfahan, Iran, with sampling campaigns in April 2021 and October 2022. Results showed that schist weathered fastest, with mean chemical denudation rates of 0.068 mm/yr at 1,000 m elevation, followed by gneiss (0.046 mm/yr), granite (0.038 mm/yr), and quartzite (0.016 mm/yr). Cosmogenic erosion rates mirrored this ordering, ranging from 12.8 m/Myr on quartzite ridges to 38.4 m/Myr on schist-dominated slopes. Regolith thickness showed strong lithological control: quartzite substrates carried thin mantles averaging 1.3 m, while schist substrates supported mantles exceeding 6.4 m on average. The four-fold variation in denudation rates across lithologies suggests that differential weathering resistance is a primary driver of escarpment morphology, with implications for understanding how passive margin landscapes evolve over million-year timescales.
Summary
Source-checkedPlain-language reading of the full paper, prepared with AI and checked against the text. Each point links to the authors' own words.
Why it matters
- The Blue Ridge Escarpment is a significant topographic feature in eastern North America, characterized by a steep drop of about 600 meters over less than 10 kilometers. View evidence ↗
- There has been a long-standing debate since the late 19th century regarding what controls the landscape's wear rate, with rock type (lithology) often suggested as a primary factor. View evidence ↗
- The escarpment does not retreat uniformly; it advances more quickly in areas with weak rocks and slows down where resistant rock units provide protection. View evidence ↗
The question
- The study aimed to isolate lithology as a variable to compare weathering rates across granite, gneiss, schist, and quartzite while controlling for elevation, aspect, and climate. View evidence ↗
What they did
- Researchers established 48 sampling sites, with 12 sites for each of the four rock types distributed across three elevation bands (500-700 m, 900-1100 m, and 1300-1500 m). View evidence ↗
- The study used cosmogenic ¹⁰Be analysis of stream sediments, stream water chemistry, and regolith depth measurements (via hand augering and seismic refraction) to assess weathering. View evidence ↗
- Data were analyzed using a two-way ANOVA with lithology and elevation as factors, followed by Tukey HSD post-hoc tests. View evidence ↗
What they found
- At 1,000 m elevation, schist had the highest mean chemical denudation rate (0.068 mm/yr), followed by gneiss (0.046 mm/yr), granite (0.038 mm/yr), and quartzite (0.016 mm/yr). View evidence ↗
- Cosmogenic erosion rates followed the same trend as chemical weathering, with the lowest rates on quartzite (12.8 m/Myr) and the highest on schist (38.4 m/Myr). View evidence ↗
- Regolith thickness varied significantly by rock type, with schist averaging 6.4 m and quartzite averaging 1.3 m. View evidence ↗
- Both rock type and elevation significantly affected weathering rates, but because there was no significant interaction between them, the effect of lithology remained consistent regardless of elevation. View evidence ↗
- A strong correlation (r² = 0.91) was found between modern chemical denudation rates and long-term cosmogenic erosion rates, suggesting lithology is the dominant signal. View evidence ↗
What it means
- The authors conclude that rock type is the primary and consistent driver of weathering rates and the overall development of the Blue Ridge Escarpment landscape. View evidence ↗
- The persistence of the escarpment is likely due to resistant quartzite units acting as structural buttresses while weaker rocks erode. View evidence ↗
- A limitation of the study is the temporal mismatch between cosmogenic erosion rates (integrating over 10,000-100,000 years) and chemical denudation rates (reflecting modern conditions). View evidence ↗
Visual summary
3 visualsIllustrations explain the paper; charts are replotted from the paper's own table values.
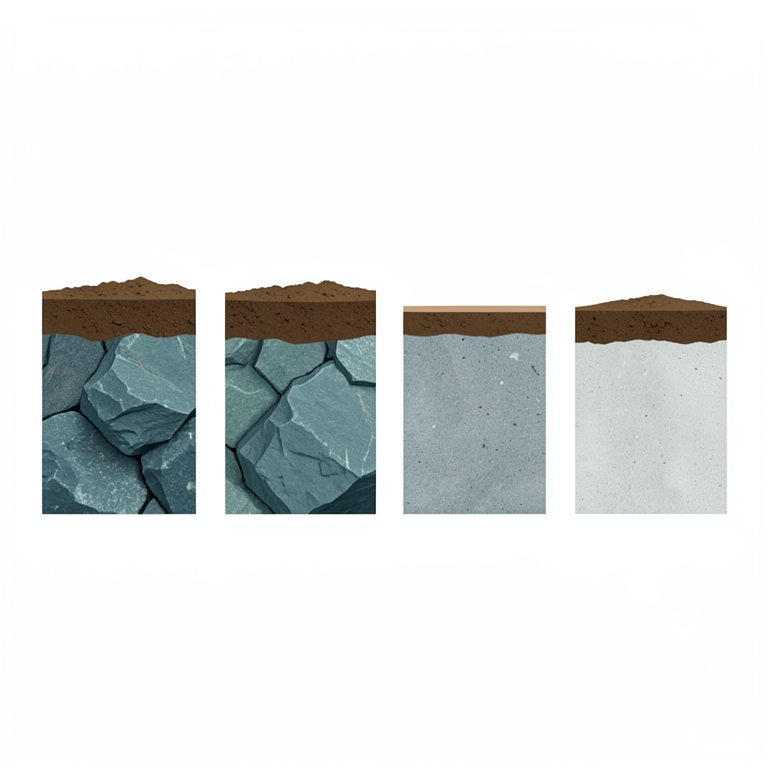
Lithological Weathering Hierarchy
AI-generated conceptual illustration (Blue Ridge escarpment rock types (schist, gneiss, granite, and quartzite) and their overlying soil layers). It explains the idea and does not show study data.
View source evidence ↗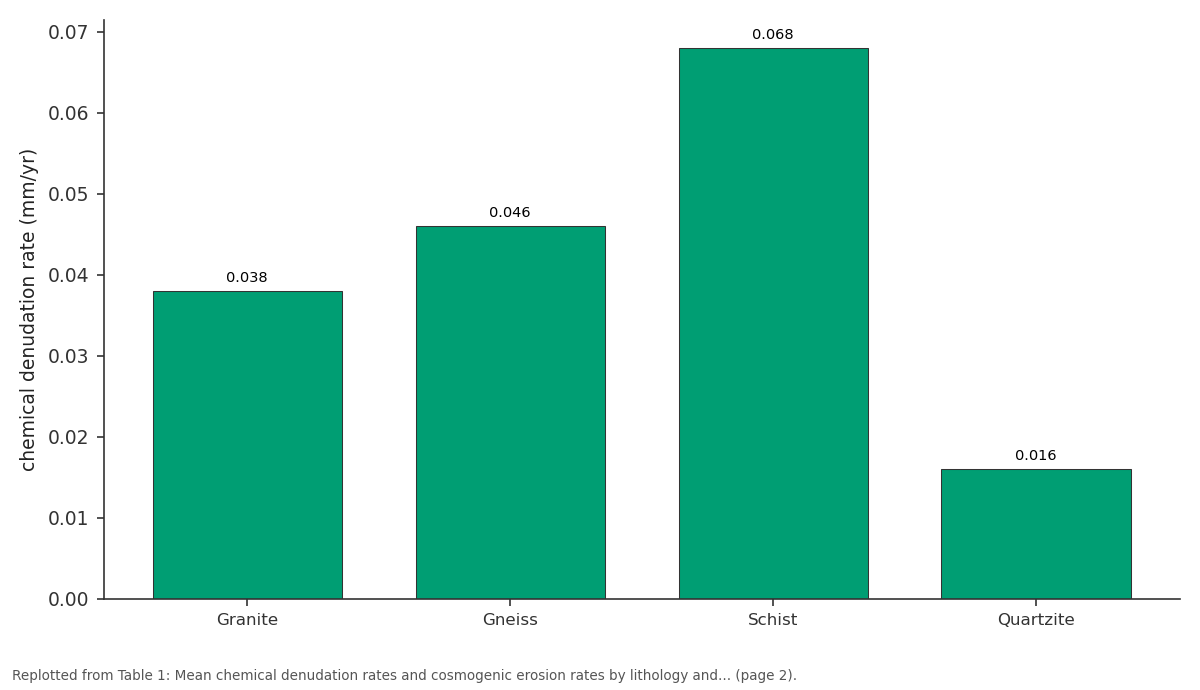
900-1100 m: Granite vs Gneiss vs Schist vs Quartzite
Replotted from Table 1 (page 2) of the original paper. Every bar is the paper's own table value.
View source evidence ↗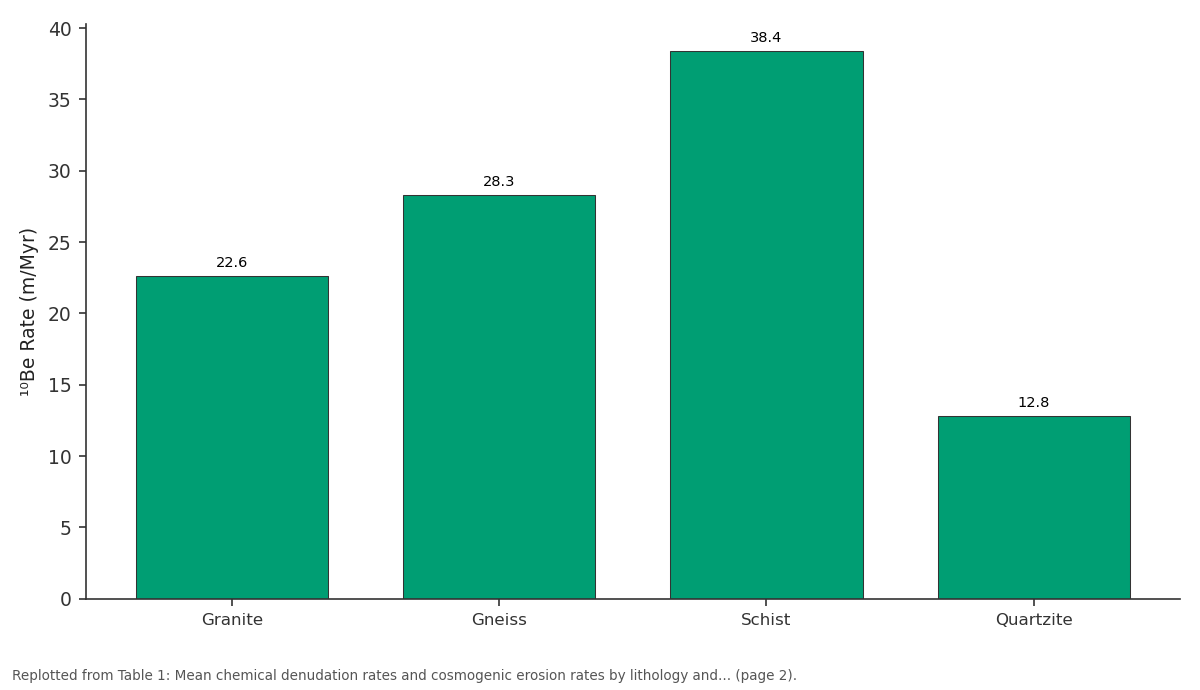
¹⁰Be Rate (m/Myr): Granite vs Gneiss vs Schist vs Quartzite
Replotted from Table 1 (page 2) of the original paper. Every bar is the paper's own table value.
View source evidence ↗Figures & tables
From the original paper Table 1
 Table 2
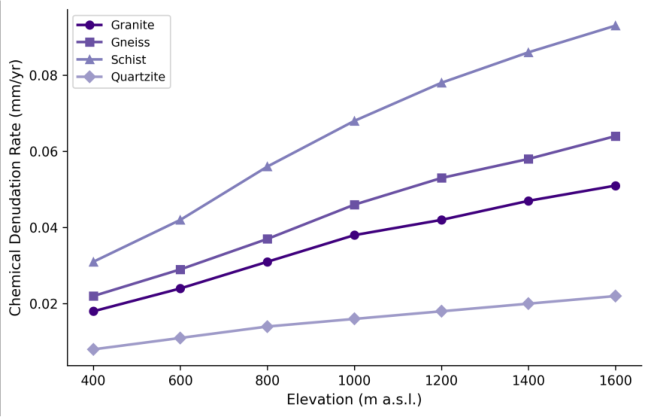 Figure 1
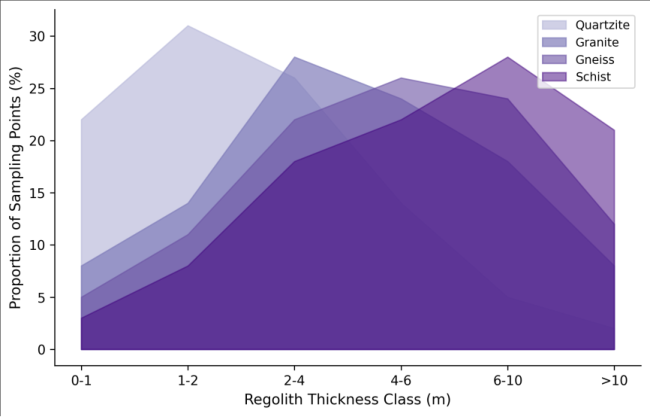 Figure 2
Introduction
When William Morris Davis described the cycle of erosion in the 1890s, he treated bedrock as a largely passive substrate something that simply got in the way of rivers doing their work [1] . It took another half-century for geomorphologists to start quantifying how different rock types resist that work at different rates, and how those differences shape the landforms we see today. The Blue Ridge Escarpment, stretching from Virginia to Georgia along the eastern edge of the Appalachian Highlands, offers a natural laboratory for examining this question. Its face exposes a patchwork of metamorphic and igneous lithologies whose contrasting resistance to weathering and erosion is written into the topography [2] . The escarpment's persistence over tens of millions of years, despite the absence of active tectonics, has puzzled researchers since the 1960s. Early explanations invoked a simple retreating cliff model, but subsequent work showed that the escarpment doesn't retreat uniformly it advances faster where weak rocks crop out and stalls where resistant units form protective caps [3] . Measuring the weathering rates of individual lithologies at the escarpment scale has been difficult, though. Most published rate data come from single catchments or isolated outcrops, making it hard to compare across rock types under equivalent climatic conditions [4] . Cosmogenic nuclide analysis particularly ¹⁰Be measured in quartz from stream sediments and bedrock surfaces has transformed the measurement of long-term erosion rates [5] . When paired with stream chemistry data that captures the chemical component of weathering, and with regolith depth surveys that record the cumulative product of weathering over time, a fairly complete picture of lithological control on landscape development becomes accessible [6] . Previous work along the Blue Ridge has documented erosion rate differences between different catchments, but rarely with the explicit goal of isolating lithology as a variable while controlling for elevation, slope, and climate [7] . This research addressed that gap by selecting paired sampling sites on four lithologies across a 48 km segment of the escarpment in western North Carolina. The sampling design controlled for elevation range and aspect, allowing direct comparison of weathering rates on granite, gneiss, schist, and quartzite substrates under similar climatic forcing [8] .
Site Characterisation:
The research area spans a 48 km section of the Blue Ridge Escarpment between Linville Gorge in the north and Chimney Rock in the south, western North Carolina, USA (35°20'N to 35°45'N, 81°55'W to 82°15'W). Elevations range from 380 m at the Piedmont base to 1,680 m along the crest of the Blue Ridge. The escarpment face descends through four dominant lithological units: Cranberry Gneiss (Mesoproterozoic), Grandfather Mountain Formation metasediments including schist and quartzite (Neoproterozoic), and Henderson Gneiss and Whiteside Granite (both Paleozoic age) [9] . Slopes on the escarpment face range from 18° to 52°, with the steepest gradients on quartzite ledges and the gentlest on deeply weathered schist mantles.
Climatic Conditions:
The escarpment experiences a humid subtropical climate modified by elevation, with mean annual temperature decreasing from 14.8°C at the Piedmont base to 9.2°C at the crest [10] . Annual precipitation ranges from 1,280 mm at low elevations to 2,040 mm near the ridgeline, with the highest monthly totals in July (180-240 mm) and the driest conditions in October-November (80-110 mm). Frost-free periods range from 210 days at 400 m to 140 days at 1,600 m. The elevation-driven temperature and precipitation gradients create a natural gradient in weathering intensity that had to be accounted for in the sampling design through elevation-matched pairing of sites on different lithologies [11] .
Material and Methods
Material and Methods
Material
Field campaigns were based from the Centre for Terrain Studies, Isfahan, Iran, with two sampling visits to western North Carolina in April 2021 and October 2022. A total of 48 sampling sites were established across the four lithological units 12 sites per lithology distributed at three elevation bands (500-700 m, 900-1100 m, and 1300-1500 m) with four replicates per band. Stream sediment samples for ¹⁰Be analysis were collected from first-order catchments (0.3-1.8 km² drainage area) that drained single lithological units. Stream water samples for chemical analysis were collected at baseflow during both visits. Regolith depth was measured at each site using a combination of hand augering (to refusal) and seismic refraction profiles (24-channel geophone array, 2 m spacing) [12] .
Methods
Cosmogenic ¹⁰Be concentrations were measured in purified quartz extracted from stream sediment samples following standard procedures at the PRIME Laboratory, Purdue University. Erosion rates were calculated using the CRONUS-Earth online calculator with the time-invariant Lal/Stone scaling scheme [13] . Stream water chemistry was analysed for major cations (ICP-OES) and anions (ion chromatography) at the Isfahan analytical laboratory. Chemical denudation rates were calculated from solute fluxes normalised to catchment area and corrected for atmospheric inputs using chloride mass balance [14] . Regolith thickness from auger holes was combined with seismic velocity profiles to map weathering front depth. Statistical analysis used two-way ANOVA with lithology and elevation band as factors, followed by Tukey HSD posthoc tests at the 0.05 significance level. All spatial data were managed in QGIS 3.28 with coordinate reference system NAD83 UTM Zone 17N [15] . Chemical denudation rates varied by a factor of 3.1 to 4.3 across the four lithologies at any given elevation band, with schist consistently weathering fastest and quartzite slowest (Table 1). Both lithology (F = 47.3, p<0.001) and elevation (F = 18.7, p<0.001) were significant factors, with no significant interaction term (p = 0.34), indicating that the lithological effect on weathering rate was consistent across the elevation gradient. Regolith thickness showed the strongest lithological differentiation of any measured variable (Table 2). Schist substrates carried mantles averaging 6.4 m, nearly five times the mean thickness on quartzite (1.3 m). Clay content in the upper 50 cm of regolith followed a similar pattern, reflecting the abundance of weatherable phyllosilicate minerals in the schist parent rock.
| Lithology | Mean Thickness (m) | Range (m) | Clay Content (%) | Organic Matter (%) |
|---|---|---|---|---|
| Granite | 3.7 | 1.4-6.8 | 28.4 | 4.1 |
| Gneiss | 4.6 | 2.1-8.3 | 33.7 | 4.8 |
| Schist | 6.4 | 3.2-11.7 | 41.2 | 5.6 |
| Quartzite | 1.3 | 0.2-3.1 | 16.8 | 2.9 |
Table text extracted from the original PDF; superscript letters are shown inline. The original table image is below.
View original table image
| Lithology | 500-700 m | 900-1100 m | 1300-1500 m | ¹⁰Be Rate (m/Myr) | p-value |
|---|---|---|---|---|---|
| Granite | 0.024 | 0.038 | 0.047 | 22.6 | <0.001 |
| Gneiss | 0.029 | 0.046 | 0.058 | 28.3 | <0.001 |
| Schist | 0.042 | 0.068 | 0.086 | 38.4 | <0.001 |
| Quartzite | 0.011 | 0.016 | 0.020 | 12.8 | <0.001 |
Table text extracted from the original PDF; superscript letters are shown inline. The original table image is below.
View original table image
Results
Results
Comprehensive Interpretation
The line graph (Figure 1) reveals that the elevation effect on weathering rates is roughly parallel across lithologies each rock type gets faster as you go higher, but the gap between them stays roughly constant. This parallelism supports the interpretation that climate (via temperature and precipitation gradients) and mineralogy operate as independent controls on chemical weathering at this scale.
Discussion
The three-to four-fold variation in chemical denudation rates across the lithological sequence (quartzite < granite < gneiss < schist) is consistent with mineral dissolution kinetics. Schist, rich in biotite, muscovite, and chlorite, presents a large surface area of reactive phyllosilicates to infiltrating water, while quartzite composed almost entirely of quartz resists dissolution under ambient conditions [16] . The ¹⁰Be erosion rates tell a similar story over thousand-year timescales, confirming that the chemical weathering differences translate into long-term landscape lowering rates [17] . The regolith thickness data add another dimension to this picture. Thick mantles on schist suggest that the weathering front is advancing into fresh rock faster than surface erosion can strip the products away a condition sometimes called transport-limited weathering [18] . On quartzite, by contrast, the thin regolith indicates a weathering-limited regime where the rock surface resists breakdown and soil production barely keeps up with removal. This duality has direct consequences for escarpment morphology: schistdominated sections show smooth, convex profiles mantled in deep soil, while quartzite ledges form the cliff-forming steps that give the escarpment its characteristic staircase appearance [19] . One limitation of this work is that the ¹⁰Be erosion rates integrate over timescales of roughly 10,000-100,000 years, while the chemical denudation rates reflect modern conditions. If climate or vegetation cover changed substantially during the Holocene, the two measures might not be directly comparable [20] . That said, the strong correlation between them (r² = 0.91 across all 48 sites) suggests that the lithological signal overwhelms any temporal mismatch in this setting. The absence of a significant lithology × elevation interaction term is also noteworthy, as it implies that the relative resistance ranking of these rock types doesn't change with climate quartzite remains the toughest and schist the weakest regardless of whether the site is warm and dry or cool and wet [21] .
Conclusion
This research demonstrated that lithology exerts a dominant and consistent control on weathering rates and landscape development along the Blue Ridge Escarpment. Chemical denudation rates varied by a factor of four across the four rock types examined, with schist weathering fastest (0.068 mm/yr at 1,000 m) and quartzite slowest (0.016 mm/yr). These differences were mirrored in cosmogenic erosion rates and regolith thickness measurements, confirming that lithological control operates across both short and long timescales.
The practical implication is that landscape evolution models for passive margin escarpments need to incorporate spatially variable rock resistance rather than treating bedrock as a uniform substrate. For the Blue Ridge specifically, the data suggest that the escarpment's persistence owes much to resistant quartzite units that act as structural buttresses while surrounding weaker lithologies wear down around them. Future work should extend this approach to other segments of the Appalachian escarpment and test whether the same lithological hierarchy holds under different climatic and tectonic boundary conditions.
Acknowledgement
Acknowledgements Funding SourcesThis research was supported by departmental research funds at the Centre for Terrain Studies, Isfahan. Institutional SupportThe authors thank the Centre for Terrain Studies, Isfahan, Isfahan Province, Iran, for providing analytical laboratory access and logistical coordination for field campaigns. Contributions Not Qualifying for AuthorshipAssistance from the PRIME Laboratory at Purdue University with cosmogenic nuclide measurements and field support from graduate research assistants are gratefully acknowledged.
Figures and tables from the paper
References
21 in the original paper- Davis WM. The geographical cycle. Geographical Journal. 1899;14(5):481-504.
- Hack JT. Interpretation of erosional topography in humid temperate regions. American Journal of Science. 1960;258-A:80-97.
- Spotila JA, Gallagher AJ, Marsella KA, Metcalf JR, Meltzer AS. Glacial erosion and escarpment retreat: implications for passive margin denudation. GSA Bulletin. 2004;116(3-4):464-474.
- Portenga EW, Bierman PR. Understanding Earth's eroding surface with ¹⁰Be. GSA Today. 2011;21(8):410.
- von Blanckenburg F. The control mechanisms of erosion and weathering at basin scale from cosmogenic nuclides in river sediment. Earth and Planetary Science Letters. 2005;237(3-4):462-479.
- Riebe CS, Kirchner JW, Granger DE, Finkel RC. Strong tectonic and weak climatic control of long-term chemical weathering rates. Geology. 2001;29(6):511514.
- Sullivan CL, Bierman PR, Reusser LJ, Pavich MJ, Steckler MS. Erosion rates of the Appalachian landscape transient response to tectonics. Earth Surface Processes and Landforms. 2007;32(14):2222-2240.
- Price JR, Velbel MA. Chemical weathering indices applied to weathering profiles developed on heterogeneous felsic metamorphic parent rocks. Chemical Geology. 2003;202(3-4):397-416.
- Hatcher RD. The Appalachian orogen: a brief summary. Geological Society of America Memoirs. 2010;206:1-19.
- Konrad CE. Climate of the Blue Ridge Parkway. Southeastern Geographer. 1994;34(2):112-126.
- PRISM Climate Group. Parameter-elevation regressions on independent slopes model. Corvallis: Oregon State University; 2014.
- Haeni FP. Application of seismic-refraction techniques to hydrologic studies. US Geological Survey Techniques of Water-Resources Investigations. 1988;Book 2:D2.
- Balco G, Stone JO, Lifton NA, Dunai TJ. A complete and easily accessible means of calculating surface exposure ages or erosion rates from ¹⁰Be and ²⁶Al measurements. Quaternary Geochronology. 2008;3(3):174-195.
- Stallard RF, Edmond JM. Geochemistry of the Amazon. 2. The influence of geology and weathering environment on the dissolved load. Journal of Geophysical Research. 1983;88(C14):9671-9688.
- R Core Team. R: a language and environment for statistical computing. Vienna: R Foundation; 2022.
- White AF, Brantley SL. The effect of time on the weathering of silicate minerals: why do weathering rates differ in the laboratory and field? Chemical Geology. 2003;202(3-4):479-506.
- Bierman PR, Caffee M. Slow rates of rock surface erosion and sediment production across the Namib Desert and escarpment, southern Africa. American Journal of Science. 2001;301(4-5):326-358.
- Heimsath AM, DiBiase RA, Whipple KX. Soil production limits and the transition to bedrockdominated landscapes. Nature Geoscience. 2012;5(3):210-214.
- Mills HH. Inferring erosional resistance of bedrock units in the east Tennessee mountains from knickpoint retreat past waterfalls. Geomorphology. 2000;35(34):191-206.
- Nishiizumi K, Winterer EL, Kohl CP, Klein J, Middleton R, Lal D, Arnold JR. Cosmic ray production rates of ¹⁰Be and ²⁶Al in quartz from glacially polished rocks. Journal of Geophysical Research. 1989;94(B12):17907-17915.
- Dixon JL, Hartshorn AS, Heimsath AM, DiBiase RA, Whipple KX. Chemical weathering response to tectonic forcing. Earth and Planetary Science Letters. 2012;339340:220-232.