
Research article · 2025 · Full text
International Journal of Geography Geology and EnvironmentAssessment of groundwater dependent ecosystems and their vulnerability in the Kalahari Basin
Volume 7(12) · Pages 153–155 · DOI: 10.22271/27067483.2025.v7.i12b.665 ↗
Research areasGroundwater and Watershed AnalysisAquatic Ecosystems and BiodiversityWater Quality and Resources Studies
Abstract
Author-written8-4Groundwater dependent ecosystems (GDEs) across the Kalahari Basin face mounting pressure from abstraction, yet baseline data on their extent and vulnerability remain scarce. This research mapped and classified GDEs across a 34,000 km² transect in the central Kalahari of Botswana and assessed their sensitivity to projected water table decline. Three GDE categories were identified—riparian woodland, phreatophyte savanna, and seasonal wetland—using Landsat-8 NDVI time series, geological mapping, and piezometric monitoring from 26 boreholes (January 2019 to July 2023). Water table depths ranged from 1.4 m beneath wetlands to 12.8 m under phreatophyte savanna during the dry season. Consistent deepening averaged 0.43 m/year across all types. NDVI analysis showed vegetation vigour declines of 24-34% over five years. A composite vulnerability index classified 41% of mapped GDEs as highly vulnerable. Scenario modelling projected that continued abstraction would push water tables beyond root-zone access for 62% of riparian woodlands within 15 years.
Summary
Source-checkedPlain-language reading of the full paper, prepared with AI and checked against the text. Each point links to the authors' own words.
Why it matters
- In arid regions, groundwater dependent ecosystems (GDEs) are critical for sustaining biodiversity, providing grazing, and regulating the microclimate when surface water is unavailable. View evidence ↗
- Water abstraction for mining, cattle ranching, and municipal use has increased since the 1990s, while policies have generally overlooked the water requirements of terrestrial ecosystems. View evidence ↗
- Comprehensive mapping of GDEs in southern Africa has been scarce, with previous efforts limited to localized areas like the Okavango Delta fringe. View evidence ↗
The question
- The study aimed to map GDEs across a 34,000 km² area in central Botswana, measure water table trends, and evaluate their vulnerability to future water level declines. View evidence ↗
What they did
- The researchers monitored 26 boreholes monthly from January 2019 to July 2023 across a 34,000 km² transect in central Botswana. View evidence ↗
- GDEs were mapped by calculating annual NDVI from Landsat-8 imagery, identifying pixels with dry-season NDVI above 0.25 over five years, and verifying these with geological maps and borehole data. View evidence ↗
- The study classified GDEs into three distinct categories: riparian woodland, phreatophyte savanna, and seasonal wetland. View evidence ↗
- Vulnerability was measured using a GDE Vulnerability Index (GVI) that combined water table decline rates, the ratio of water table depth to root reach, and rainfall dependence. View evidence ↗
What they found
- The study mapped 6,780 km² of GDEs, which represents approximately 20% of the total research area. View evidence ↗
- Seasonal wetlands were the most vulnerable ecosystem type, with a GVI of 0.72 and the most significant vegetation vigour decline (33.9% NDVI loss). View evidence ↗
- Using the composite vulnerability index, 41% of the mapped GDEs were categorized as highly vulnerable. View evidence ↗
- Under the most conservative abstraction scenario (Scenario A), 38.4% of riparian woodlands and 67.2% of wetlands are projected to lose groundwater access by 2038. View evidence ↗
- Under the most aggressive abstraction scenario (Scenario C), the projected loss of groundwater access increases to 84.7% for riparian woodlands and 97.1% for wetlands. View evidence ↗
What it means
- The authors recommend integrating GDE water requirements into allocation frameworks by using sentinel boreholes to set monitoring triggers and adaptive limits on water abstraction. View evidence ↗
- The authors state that future research needs to improve the accuracy of root-depth measurements and include climate projections in the vulnerability model. View evidence ↗
Visual summary
2 visualsIllustrations explain the paper; charts are replotted from the paper's own table values.
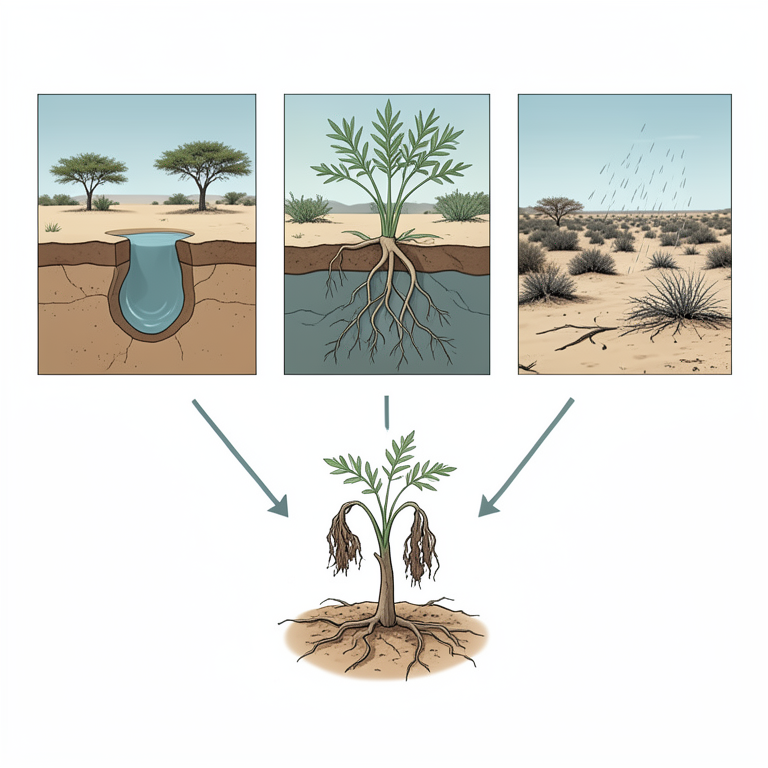
GVI Model Components
AI-generated conceptual illustration (Kalahari Basin groundwater dependent vegetation). It explains the idea and does not show study data.
View source evidence ↗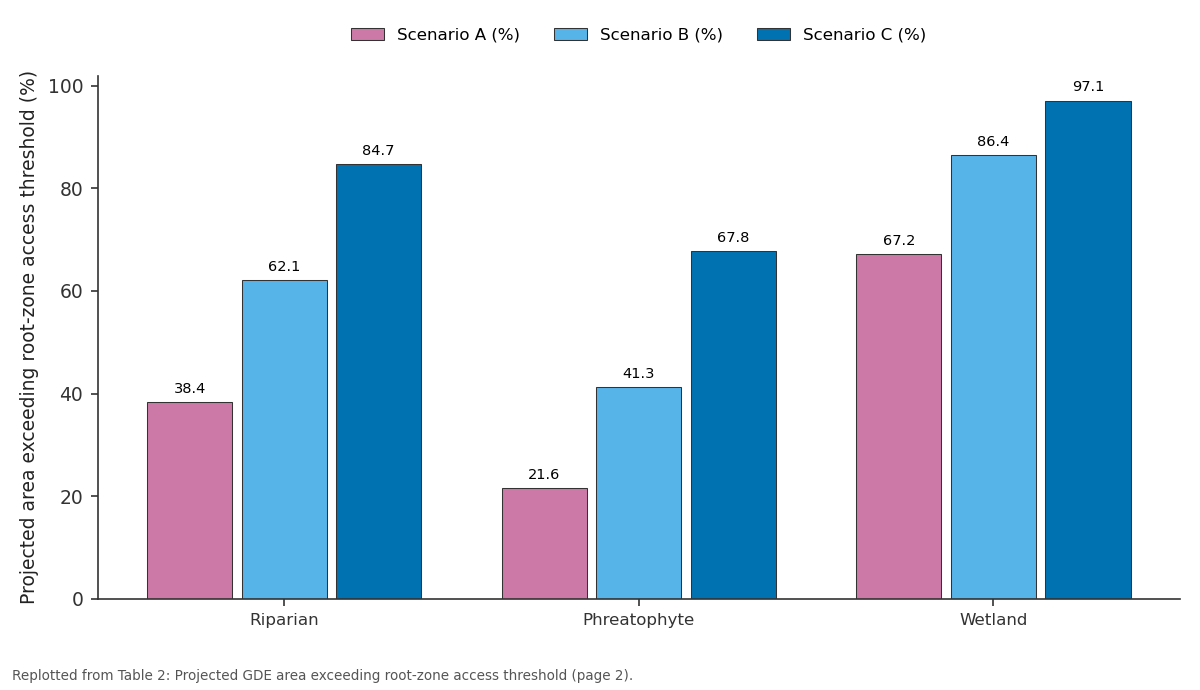
Scenario A (%) and Scenario B (%) and more: Riparian vs Phreatophyte vs Wetland
Replotted from Table 2 (page 2) of the original paper. Every bar is the paper's own table value.
View source evidence ↗Figures & tables
From the original paper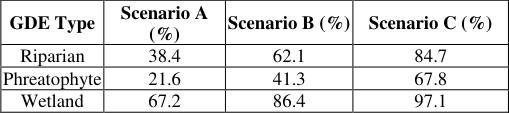 Table 2
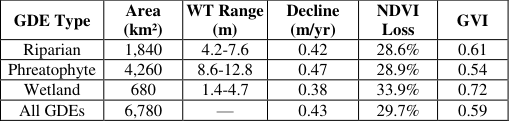 Table 1
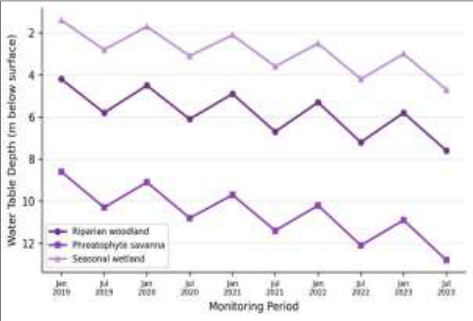 Figure 1
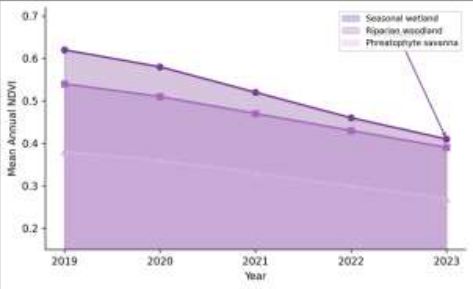 Figure 2
Introduction
Long before hydrologists began drilling monitoring boreholes in the Kalahari, the San people navigated this landscape by reading the distribution of trees that betrayed shallow groundwater beneath the sand. That indigenous knowledge rested on an ecological reality modern science has been slow to formalise: in water-scarce environments, vegetation communities are tightly coupled to water table position [1] . These groundwater dependent ecosystems sustain biodiversity, provide grazing, and regulate microclimate where surface water is absent most of the year [2] . The Kalahari Basin extends across roughly 2.5 million km² of southern Africa. Beneath the sand, the Stampriet artesian aquifer supports scattered but ecologically significant vegetation [3] . Since the 1990s, abstraction has risen sharply, driven by mining, cattle ranches, and growing municipal demand [4] . But environmental allocation policies have largely ignored terrestrial ecosystem water needs. Eamus et al. [5] proposed a GDE classification system, and Murray et al. [6] mapped GDEs across Australia using remote sensing and hydrogeological inference. In southern Africa, however, GDE mapping has been limited to localised assessments around the Okavango Delta fringe [7] . Hatton and Evans [8] demonstrated that phreatophytic vegetation responds non-linearly to water table drawdown, with sharp die-back thresholds. This research set out to map GDEs across a 34,000 km² transect in central Botswana, quantify water table trends, and assess vulnerability to projected future drawdown [9] .
Model Description and Parameterisation
Vulnerability was quantified using a composite GDE Vulnerability Index (GVI) combining three sub-indices: water table decline rate normalised against rooting depth (WTR), the ratio of dry-season water table depth to estimated maximum root reach (RDR), and a rainfall dependence factor (RDF). Each was scaled from 0 to 1 and weighted equally. The model was parameterised using measured piezometric data, published root-depth profiles for Kalahari woody species [10] , and rainfall-NDVI lag correlations. GVI thresholds: <0.33 (low), 0.33-0.66 (moderate), >0.66 (high vulnerability).
Scenario Development
Three abstraction scenarios were defined for the 15-year projection period (2024-2038). Scenario A assumed continuation of 2023 rates. Scenario B assumed 3.2% annual increase consistent with national projections. Scenario C assumed 6.1% annual increase reflecting accelerated mining and urbanisation. Water table trajectories were estimated by extrapolating measured decline rates adjusted for projected volumes using Stampriet aquifer transmissivity values [11] .
Material and Methods Material
The research was coordinated from the National Geological Institute of Bariloche, Río Negro, Argentina. The transect covered roughly 34,000 km² in central Botswana. Piezometric data from 26 monitoring boreholes were recorded monthly from January 2019 to July 2023. Landsat-8 OLI imagery (paths 173-174, rows 76-77) yielded 108 cloud-free composites after atmospheric correction [12] . Methods GDE mapping followed three steps: NDVI computation from Landsat-8 bands averaged into annual composites; flagging pixels with dry-season NDVI above 0.25 across all five years as probable GDE candidates; and crossreferencing with borehole data and geological maps. Each confirmed GDE was classified as riparian woodland, phreatophyte savanna, or seasonal wetland based on NDVI amplitude, drainage proximity, and field verification at 38 ground-truth points [13] . Vulnerability was computed using the GVI model. A total of 6,780 km² of GDEs were mapped (roughly 20% of the research area). Seasonal wetlands showed the highest vulnerability (GVI = 0.72) and steepest NDVI decline (33.9%) [14] . Under Scenario C, these rose to 84.7% and 97.1% [15] . Seasonal wetlands showed the steepest NDVI decline (0.62 to 0.41, 34% reduction). This vegetation stress preceded visible canopy loss, suggesting NDVI monitoring can serve as an early warning indicator [16] .
Results
Results
Discussion
These results provide the first spatially explicit evidence that Kalahari GDEs are undergoing measurable degradation linked to declining water tables. The average drawdown of 0.43 m/year exceeds the natural recharge rate (0.5-3.0 mm/year) [17] , confirming unsustainable abstraction patterns. The high wetland vulnerability (GVI = 0.72) and rapid 34% NDVI decline suggest limited buffering capacity against even moderate drawdown, contrasting with deeper-rooted phreatophyte species like Boscia albitrunca that tolerate several metres of lowering [18] . Even the most conservative scenario projects loss of groundwater access for a third of riparian woodlands and two-thirds of wetlands within 15 years. These projections carry uncertainties around future rainfall but the direction is consistent across all scenarios [19] . Botswana's current Water Act doesn't explicitly recognise ecological water requirements for terrestrial GDEs [20] . Integrating GDE needs into allocation frameworks would require monitoring trigger levels at sentinel boreholes coupled with adaptive abstraction limits.
Conclusion
This research mapped 6,780 km² of GDEs across the central Kalahari and documented declining water tables and vegetation vigour across all categories. Seasonal wetlands were most vulnerable (GVI = 0.72, 34% NDVI decline). Scenario modelling indicated 62-97% of GDE area could lose groundwater access within 15 years. These findings underscore the need for explicit ecological water requirements in Kalahari groundwater policy. NDVI-based early warning systems at sentinel sites could provide costeffective management triggers. Future work should refine root-depth measurements and incorporate climate projections into the vulnerability framework [21] .
Acknowledgement
Acknowledgements Funding SourcesThis research was supported by internal institutional research funding. Institutional SupportThe authors thank the National Geological Institute of Bariloche for analytical and computational support. Contributions Not Qualifying for AuthorshipStaff from the Botswana Department of Water Affairs assisted with borehole access and data provision.
Figures and tables from the paper
| GDE Type | Scenario A (%) | Scenario B (%) | Scenario C (%) |
|---|---|---|---|
| Riparian | 38.4 | 62.1 | 84.7 |
| Phreatophyte | 21.6 | 41.3 | 67.8 |
| Wetland | 67.2 | 86.4 | 97.1 |
Table text extracted from the original PDF; superscript letters are shown inline. The original table image is below.
View original table image
References
18 in the original paper- Le Maitre DC, Scott DF, Colvin C. Interactions between vegetation and groundwater. Water SA. 1999;25(2):137-152.
- Eamus D, Froend R. Groundwater-dependent ecosystems: the where, what and why. Aust J Bot. 2006;54(2):91-96.
- De Vries JJ, Selaolo ET, Beekman HE. Groundwater recharge in the Kalahari. J Hydrol. 2000;238(1-2):110123.
- Altchenko Y, Villholth KG. Mapping irrigation potential from renewable groundwater in Africa. Hydrol Earth Syst Sci. 2015;19(2):889-904.
- Eamus D, Froend R, Loomes R, Hose GC, Murray BR. Functional methodology for determining groundwater regime for GDE health. Aust J Bot. 2006;54(2):97-114.
- Murray BR, Hose GC, Eamus D, Licari D. Valuation of groundwater-dependent ecosystems. Aust J Bot. 2006;54(2):221-229.
- Hatton T, Evans R. Dependence of Ecosystems on Groundwater and its Significance to Australia. LWRRDC Occasional Paper No. 12/98; 1998.
- Castanier S, Le Métayer-Levrel G, Perthuisot JP. Cacarbonates precipitation and limestone genesis. Sediment Geol. 1999;126(1-4):9-23.
- Canadell J, Jackson RB, Ehleringer JR, Mooney HA, Sala OE, Schulze ED. Maximum rooting depth at the global scale. Oecologia. 1996;108(4):583-595.
- Vermote EF, Justice CO, Claverie M, Franch B. Performance of the Landsat 8/OLI land surface reflectance product. Remote Sens Environ. 2016;185:46-56.
- Tucker CJ, Sellers PJ. Satellite remote sensing of primary production. Int J Remote Sens. 1986;7(11):1395-1416.
- Barron OV, Emelyanova I, Van Niel TG, Pollock D, Hodgson G. Mapping groundwater-dependent ecosystems using remote sensing. Hydrol Process. 2014;28(2):372-385.
- Orellana F, Verma P, Loheide SP, Daly E. Monitoring water-vegetation interactions in groundwater-dependent ecosystems. Rev Geophys. 2012;50(3):RG3003.
- Contreras S, Jobbágy EG, Villagra PE, Nosetto MD, Puigdefábregas J. Supplementary water consumption by arid ecosystems of Argentina. J Hydrol. 2011;397(12):10-22.
- Vogel JC, Van Urk H. Isotopic composition of groundwater in semi-arid southern Africa. J Hydrol. 1975;25(1-2):23-36.
- February EC, Higgins SI, Bond WJ, Swemmer L. Competition and rainfall manipulation on savanna tree growth. Ecology. 2013;94(5):1155-1164.
- Thomas DSG, Knight M, Wiggs GFS. Remobilization of southern African desert dune systems. Nature. 2005;435(7046):1218-1221.
- Kløve B, Ala-Aho P, Bertrand G, Gurdak JJ, Kupfersberger H, Kvaerner J. Climate change impacts on groundwater and dependent ecosystems. J Hydrol. 2014;518:250-266.