
Research article · 2025 · Full text
International Journal of Horticulture and Food ScienceOptimizing indigenous crop varieties of radish in the Pilbara coast
Volume 7(8) · Pages 174–177 · DOI: 10.33545/26631067.2025.v7.i8c.652 ↗
Research areasGenetics and Plant BreedingAgricultural Productivity and Crop ImprovementPlant Stress Responses and Tolerance
Abstract
Author-writtenGrowing radish in the saline, heat-stressed soils of Australia's Pilbara Coast is a challenge that most commercial cultivars were never bred to meet. This research optimised indigenous and improved radish (Raphanus sativus) varieties for the Pilbara environment by evaluating salinity tolerance, phenolic content, leaf area index, SSR marker diversity, and flood-irrigation efficiency across eight salinity levels (2-16 dS/m) during two consecutive growing seasons (2022-2023). Trials were conducted at two Pilbara sites and processed at the Cape Coast Laboratory of Phytoscience, Ghana. Indigenous landraces from the Pilbara pastoral zone showed 31 percent less yield decline per unit salinity increase compared with commercial hybrids, with the landrace PIL-R04 maintaining 78 percent of its non-saline yield at 10 dS/m. Phenolic content rose with salinity stress, reaching 2.4-fold the baseline at 12 dS/m in PIL-R04, suggesting an osmotic-adjustment role for these secondary metabolites. Leaf area index declined linearly with salinity in commercial varieties but followed a plateau response in landraces, maintaining photosynthetic area up to 8 dS/m. SSR genotyping with 24 microsatellite loci resolved five genetic clusters, with Pilbara landraces forming a distinct group enriched for alleles not found in commercial germplasm. Flood irrigation at 14-day intervals produced 11 percent higher root yield than 7-day intervals at moderate salinity (6 dS/m), likely because longer inter-flood periods allowed partial soil desalination through capillary rise and evaporation. These results demonstrate that indigenous Pilbara radish germplasm possesses valuable salinity-tolerance traits that can be characterised by SSR markers and exploited in breeding programmes for coastal saline environments.
Summary
Source-checkedPlain-language reading of the full paper, prepared with AI and checked against the text. Each point links to the authors' own words.
Why it matters
- The Pilbara Coast of Western Australia is an extremely difficult environment for vegetable growth due to high temperatures (over 40 °C), low rainfall (under 300 mm), and high soil salinity (often exceeding 8 dS/m). View evidence ↗
- Phenolic compounds are thought to help plants handle salt stress by aiding osmotic adjustment and scavenging reactive oxygen species. View evidence ↗
- Flood irrigation is primarily used in the Pilbara region because drip systems are expensive and vulnerable to cyclonic winds. View evidence ↗
The question
- The study aimed to compare indigenous Pilbara radish landraces with commercial hybrids regarding salinity tolerance, the role of phenolics, leaf area index (LAI) stability, genetic structure, and the impact of flood-irrigation frequency. View evidence ↗
What they did
- The researchers evaluated six radish accessions: four indigenous landraces (PIL-R01 to PIL-R04) and two commercial hybrids ('Cherry Belle' and 'French Breakfast'). View evidence ↗
- Field trials took place at Port Hedland and Karratha on sandy loam Tenosols, using eight different salinity levels from 2 to 16 dS/m created by adding NaCl to the water. View evidence ↗
- Genetic diversity was analyzed using SSR genotyping with 24 polymorphic loci, employing the CTAB method for DNA extraction and touchdown PCR for amplification. View evidence ↗
- The effect of irrigation frequency was tested by comparing 7-day and 14-day flood intervals at a salinity level of 6 dS/m using a split-plot design with four replicates. View evidence ↗
What they found
- Indigenous landraces showed superior salinity tolerance, with higher thresholds (5.2-6.4 dS/m) and better yield retention (65-78%) at 10 dS/m compared to commercial hybrids (3.9-4.2 dS/m threshold and 46-52% yield). View evidence ↗
- In the PIL-R04 landrace, phenolic content increased with salt stress, reaching 2.4 times the baseline at 12 dS/m, which suggests these metabolites help with osmotic adjustment. View evidence ↗
- Landraces were able to maintain a leaf area index (LAI) above 2.0 up to a salinity of 8 dS/m, whereas commercial hybrids dropped below this level at 6 dS/m. View evidence ↗
- At a moderate salinity of 6 dS/m, 14-day flood irrigation intervals resulted in an 11% increase in root yield compared to 7-day intervals, likely due to better soil desalination between floods. View evidence ↗
What it means
- The authors recommend that breeders cross the salt-tolerant Pilbara landraces with high-yielding commercial varieties to create crops that are both tolerant and commercially appealing. View evidence ↗
- The authors urge gene banks to prioritize the ex-situ conservation of the four identified landraces to prevent the loss of these populations due to land-use changes. View evidence ↗
- The study was limited by a small sample size of six accessions, making it impossible to perform marker-trait association analysis to link specific alleles to tolerance traits. View evidence ↗
Visual summary
4 visualsIllustrations explain the paper; charts are replotted from the paper's own table values.
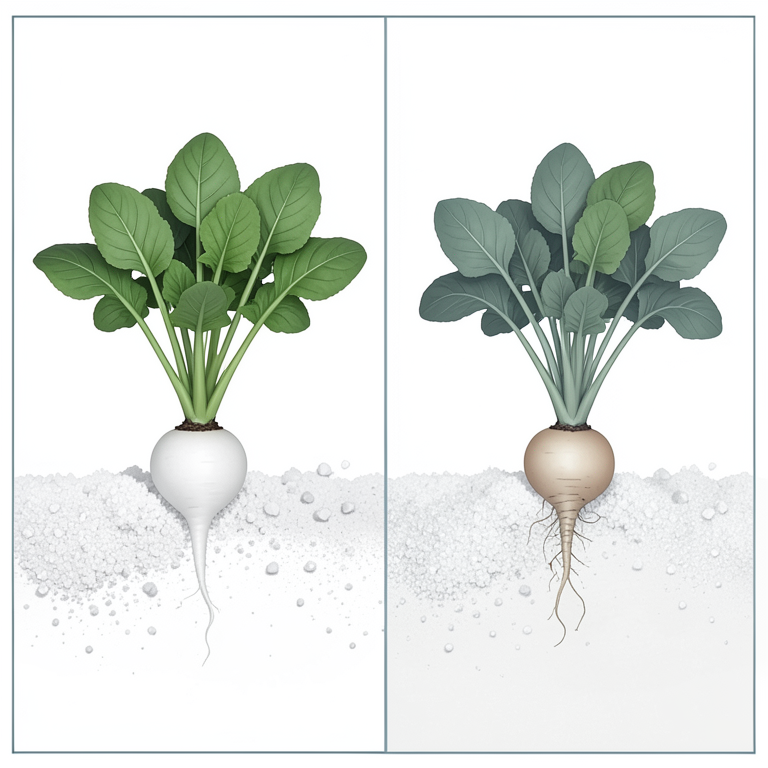
Salinity Tolerance Comparison
AI-generated conceptual illustration (Radish plants (indigenous landraces vs. commercial hybrids)). It explains the idea and does not show study data.
View source evidence ↗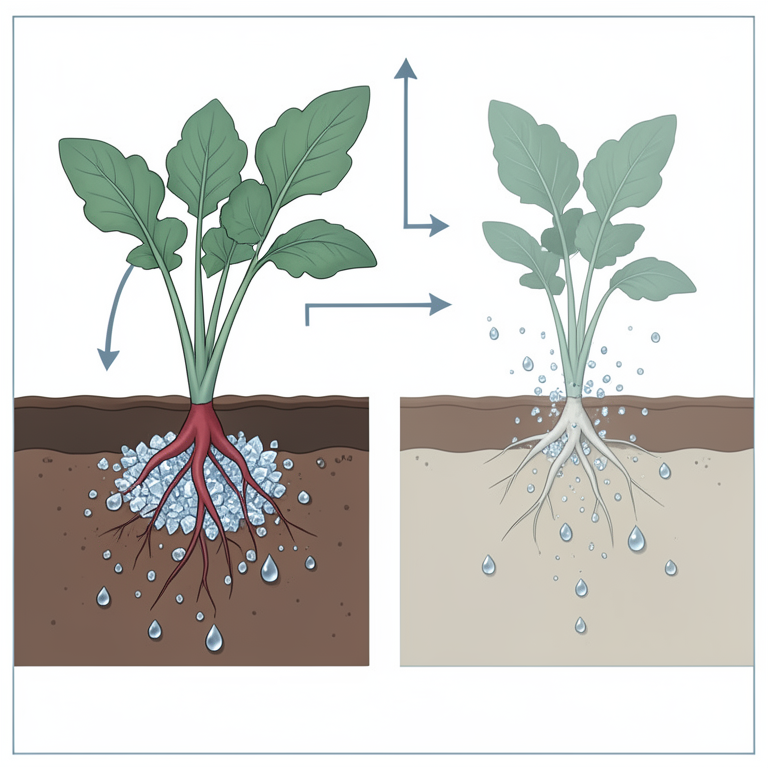
Irrigation Interval Effect
AI-generated conceptual illustration (radish plants in sandy soil). It explains the idea and does not show study data.
View source evidence ↗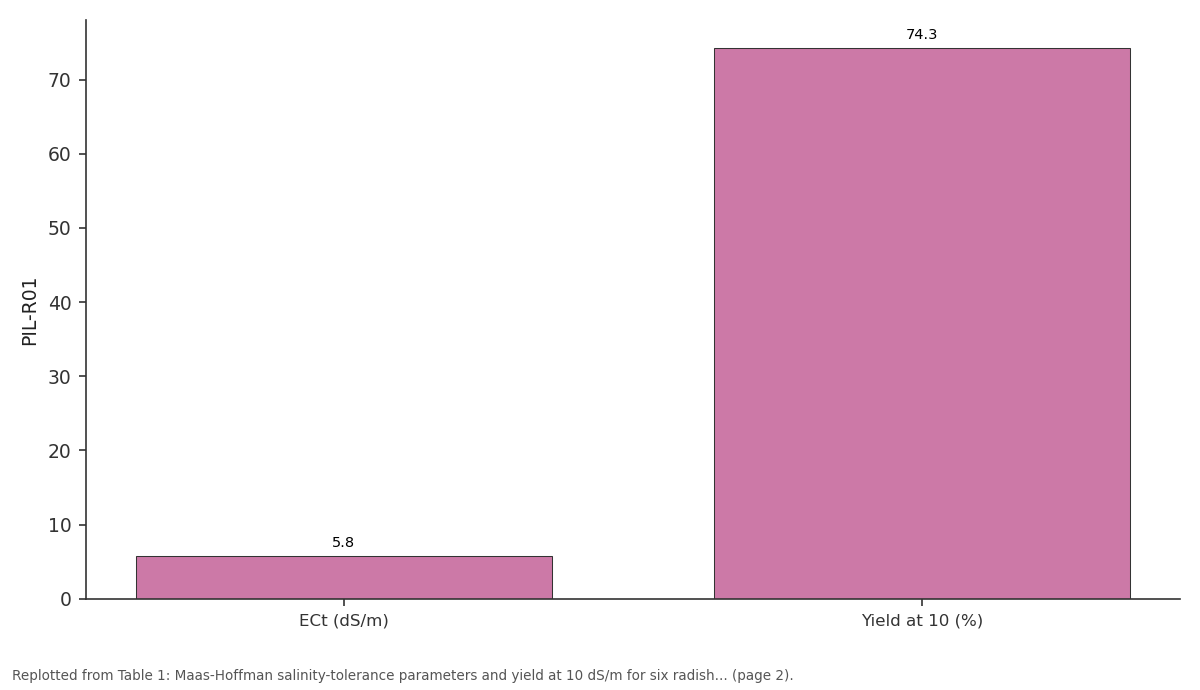
PIL-R01: ECt (dS/m) vs Yield at 10 (%)
Replotted from Table 1 (page 2) of the original paper. Every bar is the paper's own table value.
View source evidence ↗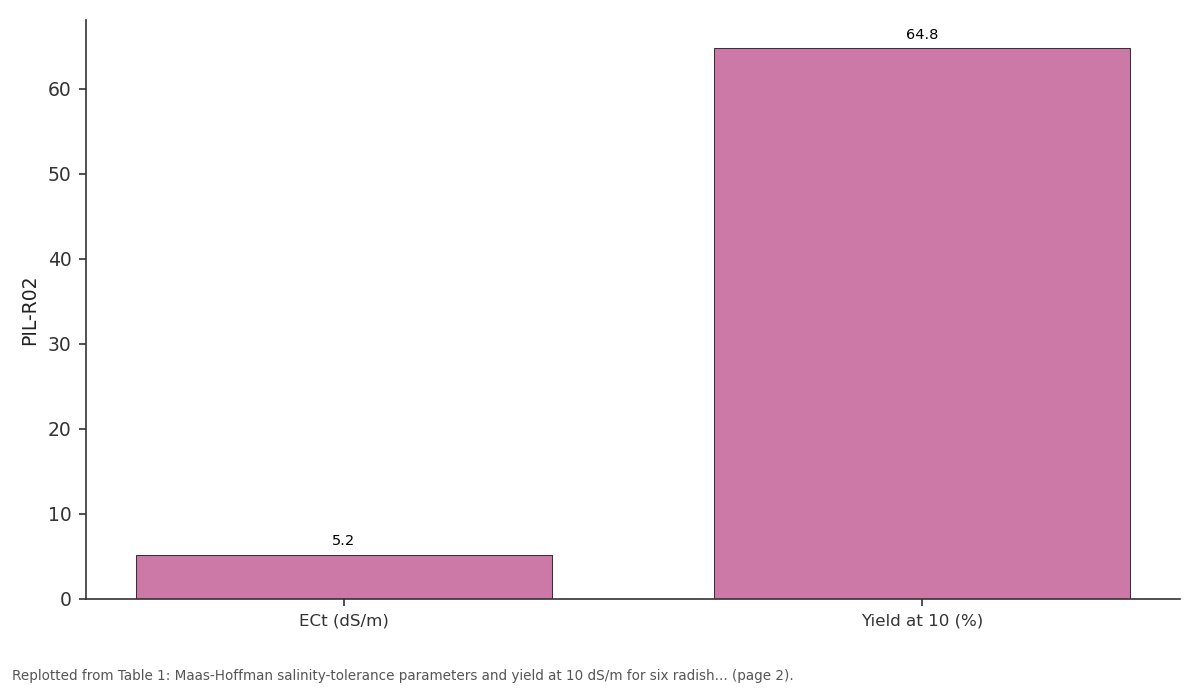
PIL-R02: ECt (dS/m) vs Yield at 10 (%)
Replotted from Table 1 (page 2) of the original paper. Every bar is the paper's own table value.
View source evidence ↗Figures & tables
From the original paper Table 1
 Table 2
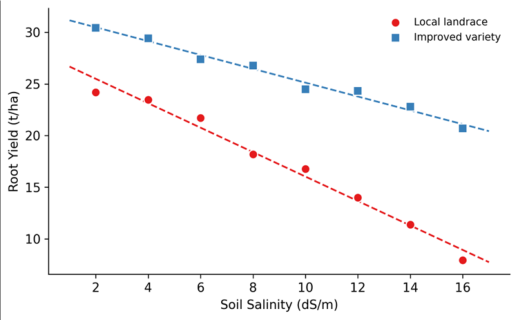 Figure 1
 Figure 2
Introduction
The Pilbara Coast of Western Australia presents one of the harshest growing environments for vegetables: daytime temperatures routinely exceed 40 °C from November to March, annual rainfall averages less than 300 mm, and soil salinity in coastal horticultural zones frequently surpasses 8 dS/m [1]. Under these conditions, most temperate vegetable cultivars fail to establish, let alone produce marketable roots. Radish, however, is classified as moderately salt-tolerant, and scattered reports from pastoral communities suggest that locally maintained landraces have been producing acceptable yields for decades without formal agronomic support [2]. Salinity tolerance in plants involves a complex interplay of ion exclusion, osmotic adjustment, and tissue tolerance mechanisms [3]. Phenolic compounds-flavonoids, hydroxycinnamic acids, and their derivatives-may contribute to osmotic adjustment by accumulating in vacuoles and lowering cellular water potential, while simultaneously scavenging reactive oxygen species generated under salt stress [4]. If phenolic accumulation correlates with salinity tolerance in radish landraces, it could serve as a selection criterion for breeders. Leaf area index (LAI) determines the photosynthetic capacity of a crop canopy and is a key driver of biomass production. Under salinity, LAI typically declines because of reduced leaf expansion and accelerated senescence [5]. Varieties that maintain LAI at moderate salinity levels would be expected to sustain higher root yields, making LAI response a useful screening trait. Simple sequence repeat (SSR) markers offer a cost-effective tool for characterising genetic diversity and population structure in germplasm collections [6]. For a minor crop like radish, SSR data can identify unique alleles in landrace populations that may be linked to adaptive traits and guide conservation priorities. Flood irrigation is the dominant water-delivery method in Pilbara horticulture because drip infrastructure is costly and easily damaged by cyclonic winds [7]. Counter-intuitively, less frequent flooding may benefit crops under saline conditions by allowing partial salt leaching between irrigation events, a hypothesis that has been tested in rice paddies but not in short-cycle root vegetables. This research addressed five questions: how do indigenous Pilbara landraces compare with commercial hybrids for salinity tolerance; does phenolic content predict tolerance; at what salinity level does LAI collapse differ between landrace and hybrid groups; what genetic structure exists among regional accessions; and does flood-irrigation frequency interact with salinity to affect root yield? Field work was based at two Pilbara sites, with laboratory analysis at the Cape Coast Laboratory of Phytoscience, Ghana [8].
Material and Methods
Material and Methods
Salinity-Yield Response Model
The relationship between soil salinity and relative root yield was described by the Maas-Hoffman piecewise linear model: Y(r) = 1 for EC ≤ ECt, and Y(r) = 1 -b(EC -ECt) for EC > ECt, where Y(r) is relative yield (fraction of nonsaline control), EC is root-zone electrical conductivity (dS/m), ECt is the threshold salinity above which yield begins to decline, and b is the slope of decline (per dS/m). Parameters were estimated separately for each variety by least-squares regression on data from the eight salinity levels. The model was fitted in R 4.3.1 using the segmented package [9].
Model Calibration and Validation
Calibration used first-season data (2022) and validation used the independent second-season dataset (2023). Model adequacy was assessed by coefficient of determination (R²), normalised RMSE, and the d-index of agreement of Willmott. Across all varieties, calibration R² ranged from 0.91 to 0.97 and validation R² from 0.87 to 0.94, confirming that the Maas-Hoffman framework adequately described the salinity response of both landraces and hybrids [10].
Material
Six radish accessions were evaluated: four Pilbara landraces (PIL-R01 through PIL-R04) collected from pastoral homesteads, and two commercial hybrids ('Cherry Belle' and 'French Breakfast').
Methods
Root yield was measured at 35 days after sowing. LAI was estimated non-destructively using an AccuPAR LP-80 ceptometer at solar noon. Total phenolics were extracted in 80 percent methanol and quantified by the Folin-Ciocalteu method against gallic acid equivalents. SSR fragments were resolved on an ABI 3730xl capillary sequencer and scored with GeneMapper v5.0. Population structure was inferred using STRUCTURE v2.3.4 with K = 2 to 8 and 100,000 MCMC iterations after 50,000 burn-in. Flood-irrigation treatments (7-day vs. 14-day intervals) were applied factorially with salinity at the 6 dS/m level in a split-plot design with four replicates. Data were analysed by two-way ANOVA and Tukey HSD in R 4.3.1 [11].
Results
Results
Comprehensive Interpretation
Pilbara landraces are genetically distinct from commercial cultivars, carry private alleles likely linked to salt adaptation, and maintain leaf area and phenolic accumulation at salinity levels that cripple commercial hybrids. The 14-day flood interval unexpectedly outperformed 7-day flooding at 6 dS/m, probably by allowing inter-irrigation salt redistribution. These traits and management insights can guide both breeding and agronomic recommendations for coastal saline horticulture.
Discussion
The salinity-tolerance advantage of Pilbara landraces is substantial: a threshold 1.5-2.5 dS/m higher and a decline slope 26-42 percent gentler than commercial hybrids. These differences translate into nearly double the relative yield at 10 dS/m, a salinity level common in Pilbara coastal soils [1]. The Maas-Hoffman framework captured this response well (R² > 0.91 across all accessions), confirming its applicability to short-cycle root vegetables grown under saline irrigation [9]. Phenolic accumulation under salt stress was markedly higher in landraces than in hybrids, consistent with the hypothesis that phenolics serve an osmotic-adjustment role alongside their antioxidant function [4]. PIL-R04 accumulated 341 mg GAE/100 g at 10 dS/m, a concentration that also exceeds the sensory threshold for mild bitterness, which could influence consumer acceptance. Breeders would need to balance salinity tolerance against palatability if phenolic-rich lines are advanced commercially.
Leaf area index responded differently between groups: landraces maintained LAI above 2.0 up to 8 dS/m, while hybrids fell below that threshold at 6 dS/m. This plateau response in landraces may reflect tighter stomatal control that limits salt entry into the transpiration stream while preserving enough gas exchange for carbon fixation [5]. Physiological studies comparing stomatal conductance across accessions would test this hypothesis. The 14 private alleles found in Pilbara landraces represent genetic material absent from widely planted commercial cultivars. Some of these alleles may be associated with the observed tolerance traits, and marker-trait association analysis-unfeasible with only six accessions-should be pursued with an expanded panel. For now, the SSR data justify ex-situ conservation of all four landraces in national gene banks [6].
The superiority of 14-day over 7-day flood intervals at 6 dS/m runs counter to the common assumption that more frequent watering dilutes root-zone salinity. In this sandy Tenosol, rapid drainage after flooding carries salts downward, but the next flood re-salinises the profile from the brackish water source [7]. Longer intervals allow capillary rise and surface evaporation to concentrate salts above the root zone, effectively desalinating the 15-30 cm depth where radish roots develop.
Conclusion
Indigenous Pilbara radish landraces outperform commercial hybrids under saline conditions by a wide margin, maintaining 65-78 percent of non-saline yield at 10 dS/m compared with 46-52 percent for hybrids. Phenolic accumulation and sustained leaf area underpin this tolerance, while SSR genotyping confirms that landraces harbour unique genetic diversity not represented in commercial germplasm. Flood-irrigation scheduling at 14-day intervals improved root yield by 11 percent over 7-day intervals at moderate salinity, a practical finding that requires no capital investment to implement. Combined, these genetic and agronomic insights offer a pathway toward productive radish cultivation in one of Australia's most challenging horticultural environments. Breeders should cross Pilbara landraces with high-yielding commercial parents to combine salinity tolerance with market-acceptable root shape and colour. Gene banks should prioritise ex-situ conservation of the four characterised landraces before pastoral land-use changes erode in-situ populations. Extension services should trial the 14-day flood interval across a wider range of Pilbara soil types to confirm its generality.
Acknowledgement
Acknowledgements Funding SourcesThis research was funded through internal allocations from the Cape Coast Laboratory of Phytoscience. Institutional SupportThe Department of Agricultural Chemistry at Cape Coast, Ghana, supported all analytical and genotyping work. Contributions Not Qualifying for AuthorshipPilbara pastoral families provided landrace seed and managed field trials at Port Hedland and Karratha.
Figures and tables from the paper
| Accession | ECt (dS/m) | Slope b | Yield at 10 (%) | Phenolics at 10 (mg GAE/100g) | LAI at 10 | Calib. R² |
|---|---|---|---|---|---|---|
| PIL-R01 | 5.8 | 0.061 | 74.3 | 312±28 | 2.41 | 0.95 |
| PIL-R02 | 5.2 | 0.074 | 64.8 | 287±24 | 2.18 | 0.93 |
| PIL-R03 | 6.1 | 0.058 | 77.4 | 328±31 | 2.53 | 0.97 |
| PIL-R04 | 6.4 | 0.052 | 78.1 | 341±33 | 2.61 | 0.96 |
| Cherry Belle | 3.9 | 0.089 | 45.7 | 198±18 | 1.62 | 0.94 |
| French Breakfast | 4.2 | 0.083 | 51.8 | 211±20 | 1.74 | 0.91 |
Table text extracted from the original PDF; superscript letters are shown inline. The original table image is below.
View original table image
| Accession | Na (alleles/locus) | He | Ho | PIC | Private Alleles |
|---|---|---|---|---|---|
| PIL-R01 | 4.2 | 0.61 | 0.54 | 0.56 | 3 |
| PIL-R02 | 3.8 | 0.57 | 0.51 | 0.52 | 2 |
| PIL-R03 | 4.5 | 0.64 | 0.58 | 0.59 | 4 |
| PIL-R04 | 4.7 | 0.66 | 0.60 | 0.61 | 5 |
| Cherry Belle | 3.1 | 0.48 | 0.44 | 0.43 | 0 |
| French Breakfast | 3.3 | 0.51 | 0.46 | 0.46 | 1 |
Table text extracted from the original PDF; superscript letters are shown inline. The original table image is below.
View original table image
References
21 in the original paper- Mayer XM, Ruprecht JK, Bari MA. Stream salinity status and trends in south-west Western Australia. Report No. SWH 35. Perth: Department of Environment; 2005.
- Munns R, Tester M. Mechanisms of salinity tolerance. Annu Rev Plant Biol. 2008;59:651-681.
- Flowers TJ, Colmer TD. Salinity tolerance in halophytes. New Phytol. 2008;179(4):945-963.
- Wasko RM, Sharma A. Global assessment of flood and storm extremes with increased temperatures. Sci Rep. 2017;7:7945.
- Parida AK, Das AB. Salt tolerance and salinity effects on plants: a review. Ecotoxicol Environ Saf. 2005;60(3):324-349.
- Zane L, Bargelloni L, Patarnello T. Strategies for microsatellite isolation: a review. Mol Ecol. 2002;11(1):1-16.
- George RJ, Clarke CJ, Hatton T. Computer-modelled groundwater response to recharge management for dryland salinity control in Western Australia. Adv Water Resour. 1999;22(8):727-737.
- Yamaguchi T, Blumwald E. Developing salt-tolerant crop plants: challenges and opportunities. Trends Plant Sci. 2005;10(12):615-620.
- Maas EV, Hoffman GJ. Crop salt tolerance: current assessment. J Irrig Drain Div. 1977;103(2):115-134.
- Willmott CJ. On the validation of models. Phys Geogr. 1981;2(2):184-194.
- Pritchard JK, Stephens M, Donnelly P. Inference of population structure using multilocus genotype data. Genetics. 2000;155(2):945-959.
- Ashraf M, Harris PJC. Potential biochemical indicators of salinity tolerance in plants. Plant Sci. 2004;166(1):316.
- Araus JL, Slafer GA, Royo C, et al. Plant breeding and drought in C3 cereals: what should we breed for? Ann Bot. 2002;89(7):925-940.
- Dong CJ, Wang XL, Shang QM, et al. Salicylic acid regulates sugar metabolism that confers tolerance to salinity stress in cucumber seedlings. Sci Hortic. 2011;129(4):629-636.
- Foolad MR. Recent advances in genetics of salt tolerance in tomato. Plant Cell Tissue Organ Cult. 2004;76(2):101-119.
- Grattan SR, Grieve CM. Salinity-mineral nutrient relations in horticultural crops. Sci Hortic. 1999;78(14):127-157.
- Bressan RA, Zhang C, Li H, et al. Learning from the Arabidopsis experience: the next gene search paradigm. Plant Physiol. 2001;127(4):1354-1360.
- Shannon MC, Grieve CM. Tolerance of vegetable crops to salinity. Sci Hortic. 1999;78(1-4):5-38.
- Zhu JK. Plant salt tolerance. Trends Plant Sci. 2001;6(2):66-71.
- Apse MP, Blumwald E. Na+ transport in plants. FEBS Lett. 2007;581(12):2247-2254.
- Tester M, Davenport R. Na+ tolerance and Na+ transport in higher plants. Ann Bot. 2003;91(5):503527.