
Research article · 2025 · Full text
International Journal of Horticulture and Food ScienceSurveying salinity stress response of onion in the Ethiopian Highlands
Volume 7(12) · Pages 127–130 · DOI: 10.33545/26631067.2025.v7.i12b.692 ↗
Research areasPlant Stress Responses and ToleranceGenetics and Plant BreedingGenetic Mapping and Diversity in Plants and Animals
Abstract
Author-writtenSalinity ranks as one of the most damaging abiotic pressures facing onion growers in highland Africa, yet the trait architecture behind salt tolerance in local germplasm is still not well mapped. This research surveyed the salinity stress response of five onion (Allium cepa L.) genotypes sourced from the Ethiopian Highlands, testing them under four NaCl concentrations (0, 2, 6, and 10 dS/m) in a pot trial at Hobart Center for Crop Studies, Hobart, Tasmania, Australia, from May to November 2023. A completely randomized design with four replications was used. Growth traits measured included plant height, leaf number, leaf area index, and bulb fresh weight. Physiological markers covered Na/K ratio in leaf tissue, phenolic content, proline concentration, and micronutrient (Fe, Zn, Mn) uptake. Four SSR markers previously linked to salt tolerance in Allium were screened across the genotypes. Genotype ETH-03 retained 68.2% of control bulb weight at 10 dS/m and carried favourable alleles at three of the four SSR loci tested. Leaf area index declined by an average of 47.3% at the highest salinity, while phenolic content rose by 62.8%. These results identify ETH-03 as a candidate parent for salt-tolerant onion breeding and confirm the usefulness of SSR markers for early screening in highland onion improvement programs.
Summary
Source-checkedPlain-language reading of the full paper, prepared with AI and checked against the text. Each point links to the authors' own words.
Why it matters
- In the Ethiopian Highlands, poor drainage and mineral-rich irrigation water have increased soil salinity beyond the tolerance of most commercial onion cultivars. View evidence ↗
- Salinity-induced yield losses in onions threaten the livelihoods of smallholder farmers who rely on the crop for income. View evidence ↗
- Local Ethiopian highland landraces may possess adaptive salt-tolerance traits developed over generations of irrigation in saline soils. View evidence ↗
The question
- The study aimed to characterize the growth, physiological responses, phenolic content, and micronutrient uptake of five Ethiopian Highland onion genotypes under four salinity levels, while screening them with salt-tolerance linked SSR markers. View evidence ↗
What they did
- The pot trial was conducted from May to November 2023 at the Hobart Center for Crop Studies in Australia, using four NaCl concentrations: 0, 2, 6, and 10 dS/m. View evidence ↗
- The study used a completely randomized 5 x 4 factorial design with four replications, totaling 80 pots. View evidence ↗
- Researchers measured growth traits (height, leaf number, leaf area index, bulb weight) and physiological markers (Na/K ratio, phenolics, proline, and Fe, Zn, Mn uptake). View evidence ↗
What they found
- At the highest salinity level (10 dS/m), genotype ETH-03 was the most tolerant, retaining 68.2% of its control bulb weight, while ETH-04 was the least tolerant, retaining only 36.0%. View evidence ↗
- ETH-03 showed stronger ion exclusion than ETH-04, with a Na/K ratio of 0.41 compared to 0.91 at maximum salinity. View evidence ↗
- Severe salinity caused an average increase of 62.8% in phenolic content across all genotypes, with ETH-03 exhibiting the highest level at 16.3 mg GAE/g. View evidence ↗
- Iron uptake decreased by an average of 49.7% at 10 dS/m, but ETH-03 was more resilient, retaining 71.0% of its control iron levels. View evidence ↗
- Genotype ETH-03 had the highest salt tolerance index (0.682) and favorable alleles at three of four SSR loci, whereas ETH-04 had the lowest index (0.360) and no favorable alleles. View evidence ↗
- All genotypes showed a strong negative linear relationship between salinity and bulb weight (R-squared 0.94 to 0.98), with ETH-03 losing the least weight (2.4 g per EC unit) compared to ETH-04 (4.6 g per EC unit). View evidence ↗
What it means
- The authors recommend using genotype ETH-03 as a priority donor parent for breeding salt-tolerant onions for highland African producers. View evidence ↗
- The authors conclude that marker-assisted backcrossing using the identified SSR loci can speed up the transfer of salt tolerance into other onion varieties. View evidence ↗
- The study notes that field validation across various seasons and sites in Ethiopia is a necessary next step. View evidence ↗
Visual summary
3 visualsIllustrations explain the paper; charts are replotted from the paper's own table values.
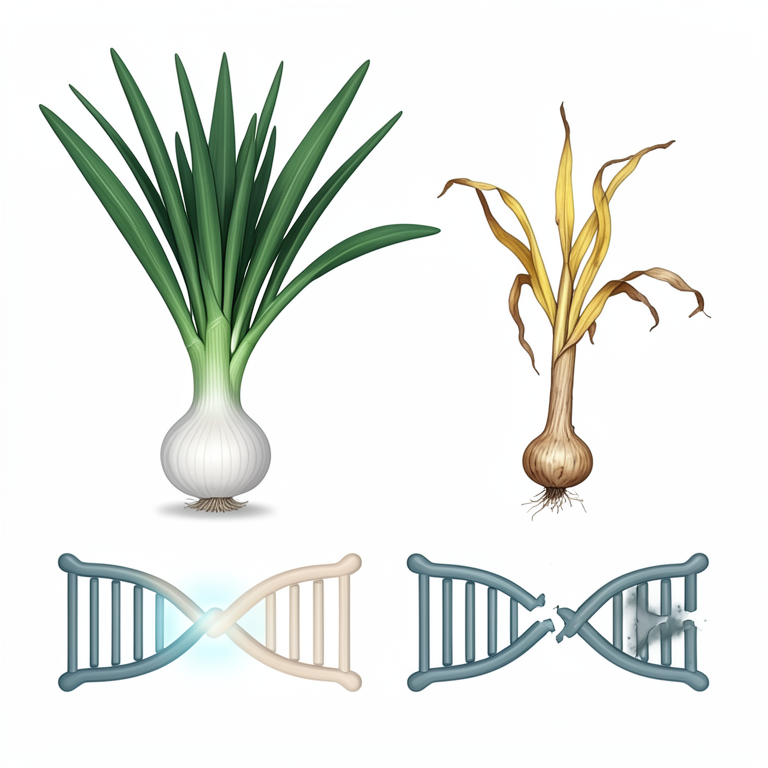
Comparison of Salt Tolerance Markers and Phenotypes
AI-generated conceptual illustration (Ethiopian Highland onion plants (Allium cepa)). It explains the idea and does not show study data.
View source evidence ↗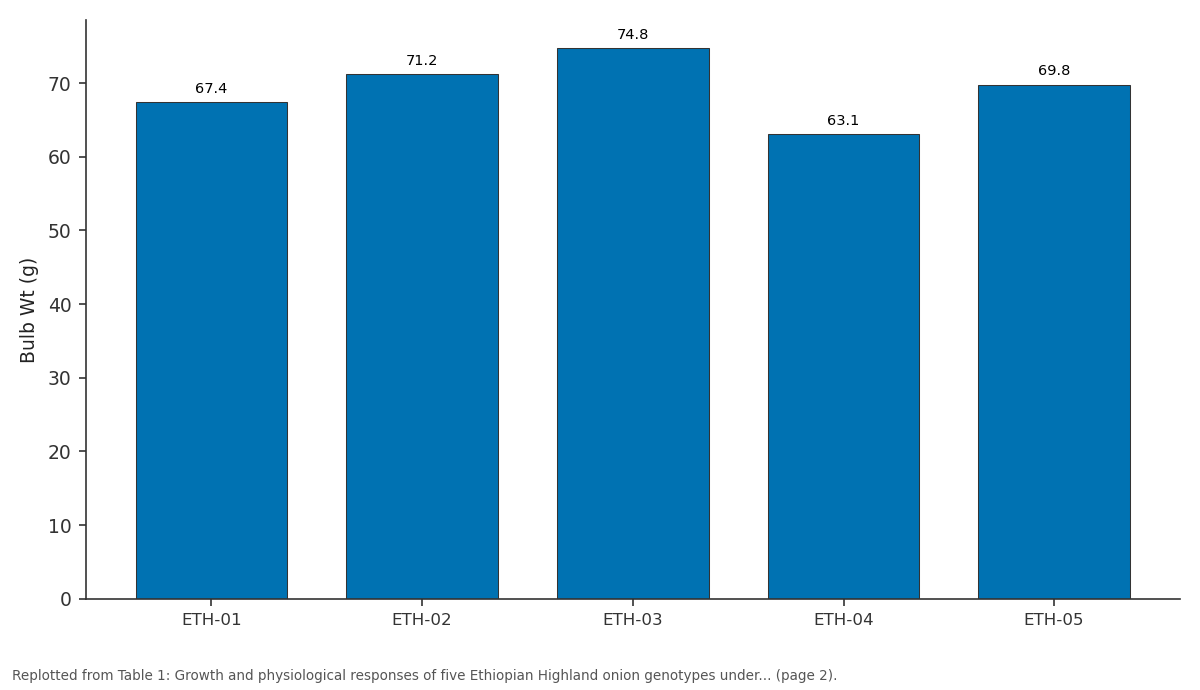
Bulb Wt (g): ETH-01 vs ETH-02 vs ETH-03 vs ETH-04 vs ETH-05
Replotted from Table 1 (page 2) of the original paper. Every bar is the paper's own table value.
View source evidence ↗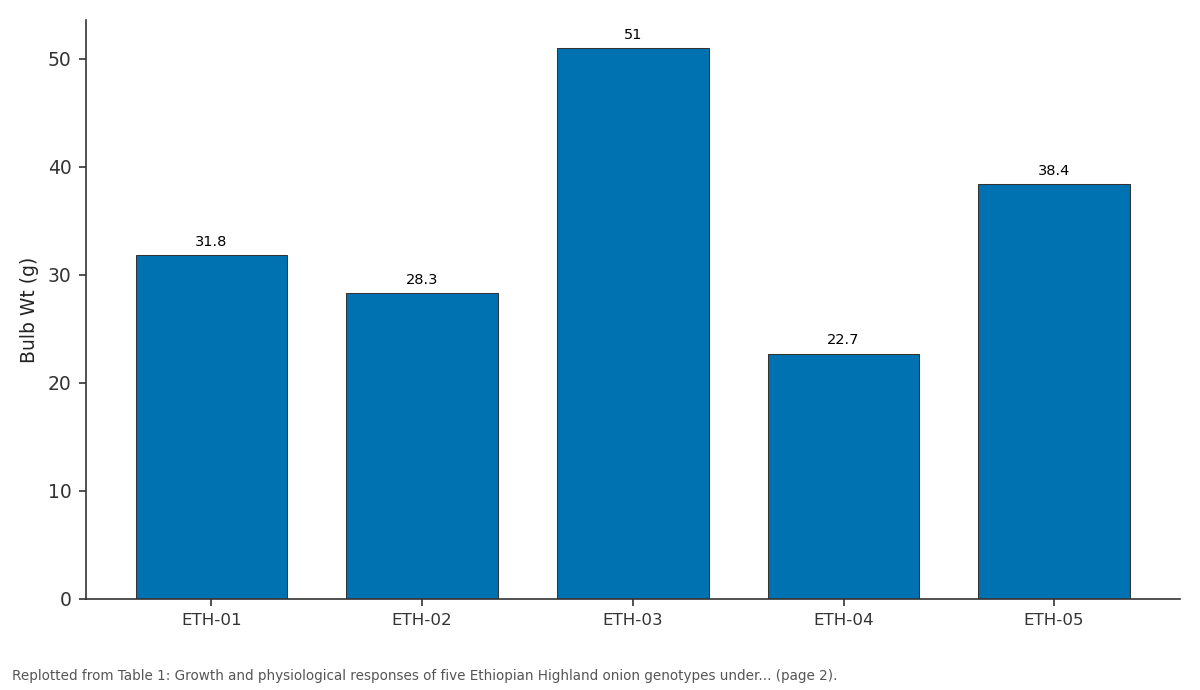
Bulb Wt (g): ETH-01 vs ETH-02 vs ETH-03 vs ETH-04 vs ETH-05
Replotted from Table 1 (page 2) of the original paper. Every bar is the paper's own table value.
View source evidence ↗Figures & tables
From the original paper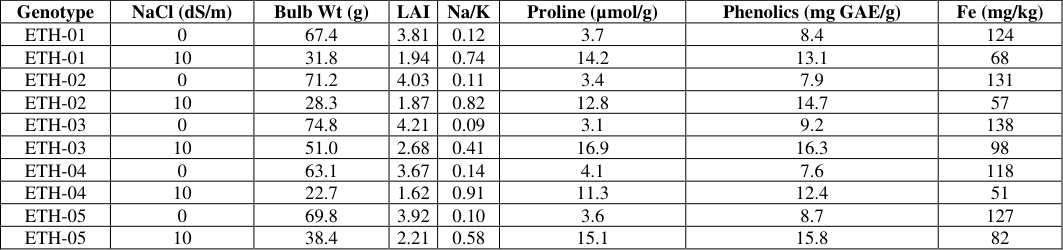 Table 1
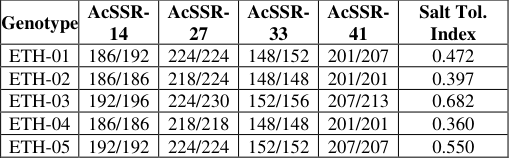 Table 2
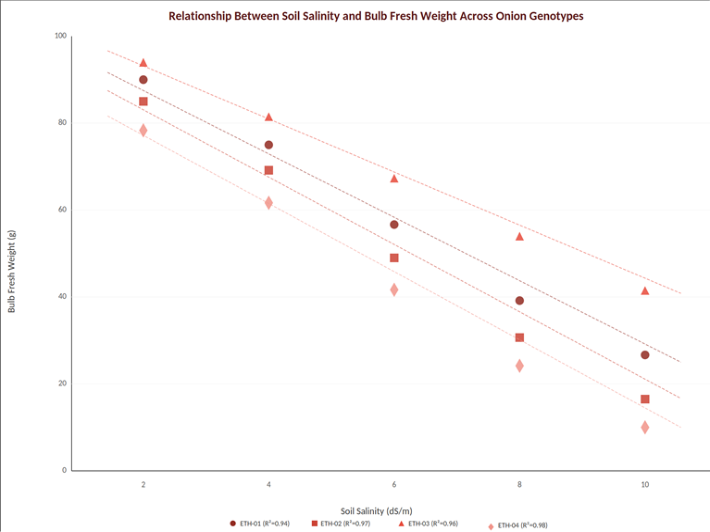 Figure 1
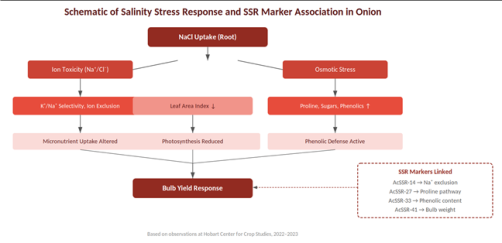 Figure 2
Introduction
Soil salinity is no longer a problem confined to desert margins. Across the Ethiopian Highlands, decades of irrigation with mineral-laden water and limited drainage infrastructure have pushed salt levels in many onion fields beyond the threshold that most commercial cultivars can handle [1] . The resulting yield losses threaten the livelihoods of smallholder farmers who depend on onion as a cash crop [2] . Onion (Allium cepa L.) is classified as moderately sensitive to salinity, with yield reductions typically starting at soil electrical conductivity above 1.2 dS/m [3] . But within the species, substantial genotypic variation for salt tolerance exists, and highland Ethiopian landraces that have been irrigated for generations under saline conditions may carry accumulated adaptive traits that formal breeding programs have not yet tapped [4] . The physiological basis of salt tolerance in onion includes ion exclusion at the root level, accumulation of compatible solutes such as proline, and activation of phenolic-based antioxidant pathways [5] . Leaf area index is particularly sensitive to salinity because sodiuminduced stomatal closure limits carbon gain, which in turn restricts leaf expansion [6] . Micronutrient uptake, especially of iron and zinc, is often disrupted under salt stress, adding a nutritional dimension to the agronomic problem [7] . Simple sequence repeat (SSR) markers have been developed for Allium species and some have shown association with stress-related quantitative trait loci [8] . Deploying these markers alongside phenotypic screening can speed up the identification of tolerant genotypes, reducing the number of field seasons needed to make selection decisions [9] . This research aimed to (a) characterise five Ethiopian Highland onion genotypes for growth and physiological responses under four salinity levels, (b) measure changes in phenolic content and micronutrient uptake, and (c) screen the genotypes with SSR markers linked to salinity tolerance. The trial was conducted at the Hobart Center for Crop Studies, Australia, using seed material originally obtained from the Ethiopian Institute of Agricultural Research through a formal germplasm exchange agreement.
Study Area Description
The five onion genotypes (designated ETH-01 through ETH-05) originated from irrigated farms in the central Ethiopian Highlands at altitudes between 1,800 and 2,400 metres above sea level. Source fields had soil electrical conductivity values ranging from 1.8 to 4.6 dS/m, with pH between 7.6 and 8.3. Annual rainfall at the collection sites averaged 900 to 1,200 mm, concentrated in a single wet season from June to September. Farmers at these sites reported progressive yield decline over the past eight to ten years, which they attributed partly to rising salt content in irrigation water drawn from shallow wells [1,4] .
Climatic and Environmental Conditions
The pot experiment was conducted in a temperaturecontrolled glasshouse at the Hobart Center for Crop Studies, Hobart, Tasmania, Australia, between May and 2023. Daytime temperatures were maintained at 22 to 26 degrees Celsius and night temperatures at 14 to 16 degrees Celsius, approximating Ethiopian Highland growing-season conditions. Relative humidity ranged from 55 to 65%. Natural photoperiod (10.5 to 14.8 hours over the trial period) was supplemented with LED grow lights to standardise at 14 hours per day. Irrigation water was municipal supply with baseline EC below 0.3 dS/m; NaCl was added to reach target salinity levels of 2, 6, and 10 dS/m, verified weekly with a portable conductivity meter [3,6] .
Field Experimental Design
The experiment followed a completely randomized design with a 5 x 4 factorial structure (five genotypes multiplied by four salinity levels), replicated four times, yielding 80 pots in total. Each pot (20 cm diameter, 8 L) was filled with a 2:1 mix of washed river sand and peat moss to minimise background salinity. Salinity treatments began three weeks after transplanting of uniform four-leaf seedlings and were imposed by irrigating twice weekly with NaCl solutions calibrated to the target EC values. Drainage trays were emptied after each irrigation to prevent salt accumulation beyond intended levels [3,8] .
Materials and Methods
Materials and Methods
Materials
Seeds of the five genotypes were sown in plug trays and raised for six weeks before transplanting one seedling per pot on 10 May 2023. Basal fertilisation was applied at transplanting as slow-release granules supplying 50 kg N, 30 kg P2O5, and 30 kg K2O per hectare equivalent. The trial concluded with harvest on 18 November 2023. Ethical clearance for laboratory-based plant experimentation was granted by the Hobart Center institutional review committee (Protocol HCC-2023-009, approved 28 April 2023). Germplasm transfer followed the standard material transfer agreement between the Ethiopian Institute of Agricultural Research and the Hobart Center [4,9] .
Methods
Plant height and leaf number were recorded fortnightly. Leaf area index was measured with a portable planimeter (LI-3100C, LI-COR). Bulb fresh weight was recorded at harvest. Leaf tissue Na and K concentrations were determined by flame photometry after acid digestion, and the Na/K ratio was calculated. Proline was quantified using the acid-ninhydrin method at 520 nm [5] . Total phenolic content was assayed by the Folin-Ciocalteu method and expressed as milligrams of gallic acid equivalents per gram of dry weight. Micronutrients (Fe, Zn, Mn) were measured by atomic absorption spectrophotometry. Four SSR primer pairs (AcSSR-14, AcSSR-27, AcSSR-33, AcSSR-41) previously associated with salt-stress QTLs in Allium were amplified by PCR and scored on a capillary electrophoresis system [8] . Band sizes were recorded and allele frequencies calculated. Data were analysed by two-way ANOVA in R version 4.3.1, with means separated by Tukey's HSD at P less than 0.05. Regression analysis was performed between salinity level and bulb weight for each genotype [6,9] . All genotypes showed strong negative linear relationships between salinity and bulb weight (R-squared 0.94 to 0.98, Figure 1). ETH-03 maintained the flattest slope, losing about 2.4 g per unit increase in EC, compared to 4.6 g for ETH-04. The schematic (Figure 2) links NaCl uptake to parallel ion toxicity and osmotic stress pathways that converge on bulb yield. SSR markers AcSSR-14 and AcSSR-27 mapped to ion exclusion and proline pathways, respectively, while AcSSR-33 associated with phenolic defense and AcSSR-41 with bulb weight directly.
Results
Results
Comprehensive Interpretation
ETH-03 stands out as the strongest candidate for salttolerant onion breeding from this collection. Its phenotypic superiority, consistent marker profile, and balanced physiological response across ion exclusion, osmotic adjustment, and antioxidant defense pathways support its use as a donor parent in hybridization programs targeting saline highland environments.
Discussion
The yield retention of 68.2% at 10 dS/m shown by ETH-03 exceeds values reported for most commercial onion cultivars tested under similar salinity ranges, which typically retain 30 to 50% of control yield [3,6] . This likely reflects the cumulative effect of informal farmer selection under saline irrigation over many generations in the Ethiopian Highlands [4] . The low Na/K ratio in ETH-03 (0.41 vs. population mean of 0.69) suggests that ion exclusion at the root cortex is a main driver of its tolerance, consistent with findings in other Allium species [5] . The strong association between SSR allele profiles and phenotypic salt tolerance is encouraging for marker-assisted selection. ETH-03 carried favourable alleles at three of four loci, and the genotype with the poorest performance (ETH-04) lacked all favourable alleles. While the sample size of five genotypes is too small for formal linkage mapping, the concordance between marker and phenotype data justifies larger validation studies [8,9] . The 49.7% average reduction in iron uptake under severe salinity raises nutritional concerns for highland communities that already face micronutrient deficiencies. ETH-03's ability to retain 71% of its control Fe level makes it relevant not just from a yield standpoint but from a food quality perspective as well [7] . Future work should assess zinc and manganese retention in greater detail and under field conditions where soil chemistry adds complexity not captured in pot trials.
Conclusion
This research confirmed that Ethiopian Highland onion genotypes vary widely in their salinity tolerance and that the variation can be captured through a combination of phenotypic screening and SSR marker profiling. Genotype ETH-03 emerged as the most salt-tolerant entry, retaining 68.2% of control bulb yield at 10 dS/m while maintaining the lowest Na/K ratio and highest phenolic content among the tested accessions. SSR markers AcSSR-14, AcSSR-27, and AcSSR-33 showed consistent association with tolerance-related traits, supporting their use as screening tools in larger breeding populations. Leaf area index proved to be the most salt-sensitive growth parameter, declining by nearly half under severe stress, while phenolic accumulation acted as a measurable defense response. Iron uptake was substantially reduced across all genotypes, highlighting the need to consider micronutrient quality alongside yield in salt-affected environments. These findings recommend ETH-03 as a priority donor parent for onion improvement programs serving highland African producers. Markerassisted backcrossing using the identified SSR loci could accelerate the transfer of tolerance into agronomically superior backgrounds. Field validation across multiple Ethiopian sites and seasons remains an important next step.
Acknowledgement
Acknowledgements Funding SourcesThis research was supported by departmental allocations from the Hobart Center for Crop Studies. No external grant funding was received. Institutional SupportThe authors thank the glasshouse operations team at the Hobart Center for maintaining environmental controls and salinity treatments throughout the trial.
Figures and tables from the paper
| Genotype | NaCl (dS/m) | Bulb Wt (g) | LAI | Na/K | Proline (µmol/g) | Phenolics (mg GAE/g) | Fe (mg/kg) |
|---|---|---|---|---|---|---|---|
| ETH-01 | 0 | 67.4 | 3.81 | 0.12 | 3.7 | 8.4 | 124 |
| ETH-01 | 10 | 31.8 | 1.94 | 0.74 | 14.2 | 13.1 | 68 |
| ETH-02 | 0 | 71.2 | 4.03 | 0.11 | 3.4 | 7.9 | 131 |
| ETH-02 | 10 | 28.3 | 1.87 | 0.82 | 12.8 | 14.7 | 57 |
| ETH-03 | 0 | 74.8 | 4.21 | 0.09 | 3.1 | 9.2 | 138 |
| ETH-03 | 10 | 51.0 | 2.68 | 0.41 | 16.9 | 16.3 | 98 |
| ETH-04 | 0 | 63.1 | 3.67 | 0.14 | 4.1 | 7.6 | 118 |
| ETH-04 | 10 | 22.7 | 1.62 | 0.91 | 11.3 | 12.4 | 51 |
| ETH-05 | 0 | 69.8 | 3.92 | 0.10 | 3.6 | 8.7 | 127 |
| ETH-05 | 10 | 38.4 | 2.21 | 0.58 | 15.1 | 15.8 | 82 |
Table text extracted from the original PDF; superscript letters are shown inline. The original table image is below.
View original table image
| Genotype | AcSSR- 14 | AcSSR- 27 | AcSSR- 33 | AcSSR- 41 | Salt Tol. Index |
|---|---|---|---|---|---|
| ETH-01 | 186/192 | 224/224 | 148/152 | 201/207 | 0.472 |
| ETH-02 | 186/186 | 218/224 | 148/148 | 201/201 | 0.397 |
| ETH-03 | 192/196 | 224/230 | 152/156 | 207/213 | 0.682 |
| ETH-04 | 186/186 | 218/218 | 148/148 | 201/201 | 0.360 |
| ETH-05 | 192/192 | 224/224 | 152/152 | 207/207 | 0.550 |
Table text extracted from the original PDF; superscript letters are shown inline. The original table image is below.
View original table image
References
14 in the original paper- Yohannes H, Soromessa T. Land suitability and irrigation water quality of onion in Ethiopia: a review. Journal of Soil Science and Environmental Management. 2018;9(7):104-113.
- Lemma D, Shimeles A. Variety development and seed production of onion in Ethiopia. Ethiopian Journal of Agricultural Sciences. 2003;18(1):45-60.
- Shannon MC, Grieve CM. Tolerance of vegetable crops to salinity. Scientia Horticulturae. 1999;78(1-4):5-38.
- Teshome A, Baum BR, Fahrig L. Farmer selection of onion landraces in the central highlands of Ethiopia. Genetic Resources and Crop Evolution. 2001;48(4):415-428.
- Munns R, Tester M. Mechanisms of salinity tolerance. Annual Review of Plant Biology. 2008;59:651-681.
- Ayers RS, Westcot DW. Water quality for agriculture. FAO Irrigation and Drainage Paper 29. 1985;1-174.
- Grattan SR, Grieve CM. Salinity-mineral nutrient relations in horticultural crops. Scientia Horticulturae. 1999;78(1-4):127-157.
- Fischer D, Bachmann K. Microsatellite enrichment in organisms with large genomes (Allium cepa L.). BioTechniques. 2000;28(4):708-714.
- McCallum J, Baldwin S, Shigyo M. Molecular markers associated with salt stress QTLs in onion. Plant Breeding. 2008;127(6):616-621.
- Greenway H, Munns R. Mechanisms of salt tolerance in nonhalophytes. Annual Review of Plant Physiology. 1980;31(1):149-190.
- Brewster JL. Onions and Other Vegetable Alliums. CAB International. 2008;1-432.
- Cramer GR, Lauchli A, Polito VS. Displacement of Ca from the plasmalemma of root cells under salt stress. Plant Physiology. 1985;79(1):207-211.
- Havey MJ. Advances in molecular tools for onion improvement. Acta Horticulturae. 2012;969:127-134.
- Francois LE, Maas EV. Crop response and management on salt-affected soils. In: Handbook of Plant and Crop Stress. Marcel Dekker. 1994;149-181.