
Research article · 2025 · Full text
International Journal of Geography Geology and EnvironmentGeochemical baseline mapping of surface soils in the Zambian Copperbelt mining district
Volume 7(1) · Pages 172–175 · DOI: 10.22271/27067483.2025.v7.i1c.627 ↗
Research areasHeavy metals in environmentGeochemistry and Geologic MappingEnvironmental and Analytical Chemistry Studies
Abstract
Author-writtenA hypothesis worth testing is whether surface-soil geochemistry in a mining district can still reveal the natural background signal or whether a century of smelter emissions has overprinted it beyond recognition. This research established a geochemical baseline for 12 elements (Cu, Co, Zn, Pb, Ni, Mn, Cr, As, Cd, Fe, Ca, Mg) in surface soils (0-15 cm) across an 80-km transect of the Zambian Copperbelt. A total of 96 composite soil samples were collected on a 2-km grid, analysed by ICP-OES after aqua-regia digestion, and mapped using ordinary kriging in ArcGIS. Copper ranged from 47 to 3,840 mg/kg, with a geometric mean of 218 mg/kg—roughly six times the estimated pre-mining background of 35 mg/kg. Cobalt and zinc showed similar enrichment patterns. Spatial analysis revealed two distinct populations: a broadly elevated plateau attributable to atmospheric deposition from smelters, and localised hotspots coinciding with tailings impoundments and waste-rock dumps. The enrichment factor for copper exceeded 10 within 3 km of active smelters but dropped below 2 beyond 25 km. Principal component analysis separated a 'mining' factor (Cu-Co-Zn-As) from a 'lithogenic' factor (Fe-Mn-Cr-Ni), confirming that anthropogenic and natural signals can still be distinguished despite a century of mining. The baseline map provides a reference for future contamination monitoring and land-use planning in the Copperbelt.
Summary
Source-checkedPlain-language reading of the full paper, prepared with AI and checked against the text. Each point links to the authors' own words.
Why it matters
- Environmental geochemistry relies on the concept of a 'natural background', the baseline element concentration determined by geology and weathering, to measure human-caused contamination. View evidence ↗
- In long-established mining districts, identifying this natural baseline is difficult because a century of industrial pollution can overprint the original geochemical signal. View evidence ↗
- The Zambian Copperbelt is a prime example of such a region, having continuously produced copper and cobalt since the 1930s. View evidence ↗
The question
- The study tested whether the natural geochemical background of surface soils in a mining district can still be detected despite a century of smelter emissions. View evidence ↗
- The specific goals were to map 12 elements across an 80-km transect, estimate pre-mining backgrounds, calculate enrichment factors, and identify geochemical associations via Principal Component Analysis (PCA). View evidence ↗
What they did
- Twelve elements were measured using ICP-OES after samples were sieved to <2 mm, dried at 40°C, and digested with aqua regia. View evidence ↗
- The study used iron (Fe) as a normalizing element to calculate enrichment factors (EF) and applied PCA with varimax rotation to standardized, log-transformed data. View evidence ↗
What they found
- Copper showed the highest enrichment, with concentrations ranging from 47 to 3,840 mg/kg and a geometric mean (218 mg/kg) approximately 6.2 times the estimated background of 35 mg/kg. View evidence ↗
- Copper enrichment was widespread, with 78.1% of the sampled sites exceeding twice the estimated background value. View evidence ↗
- Copper enrichment factors (EF) showed a clear downwind gradient from smelters, exceeding 10 within 3 km and dropping below 2 beyond 25 km. View evidence ↗
- Beyond the regional atmospheric gradient, localized hotspots of contamination were found at waste-rock dumps and tailings storage facilities. View evidence ↗
- PCA successfully distinguished between a 'mining' factor (Cu, Co, Zn, As; 38.4% variance) and a 'lithogenic' factor (Fe, Mn, Cr, Ni; 24.7% variance). View evidence ↗
- A strong positive correlation (r = 0.74) was found between copper and zinc, reflecting their co-occurrence in the region's ores. View evidence ↗
What it means
- The authors conclude that the natural geochemical fingerprint of the bedrock remains detectable in surface soils even after a century of mining. View evidence ↗
- The resulting baseline map and enrichment data are recommended as references for future land-use planning, mine closure, and contamination monitoring. View evidence ↗
- The study's 0-15 cm sampling depth may have missed deeper contamination caused by leachate migration. View evidence ↗
- The 2-km grid spacing was too coarse to resolve small-scale features like individual seepage plumes or waste-rock dumps. View evidence ↗
- Because archived pre-mining samples were unavailable, the background estimate relied on statistical inference from distal samples. View evidence ↗
Visual summary
2 visualsIllustrations explain the paper; charts are replotted from the paper's own table values.
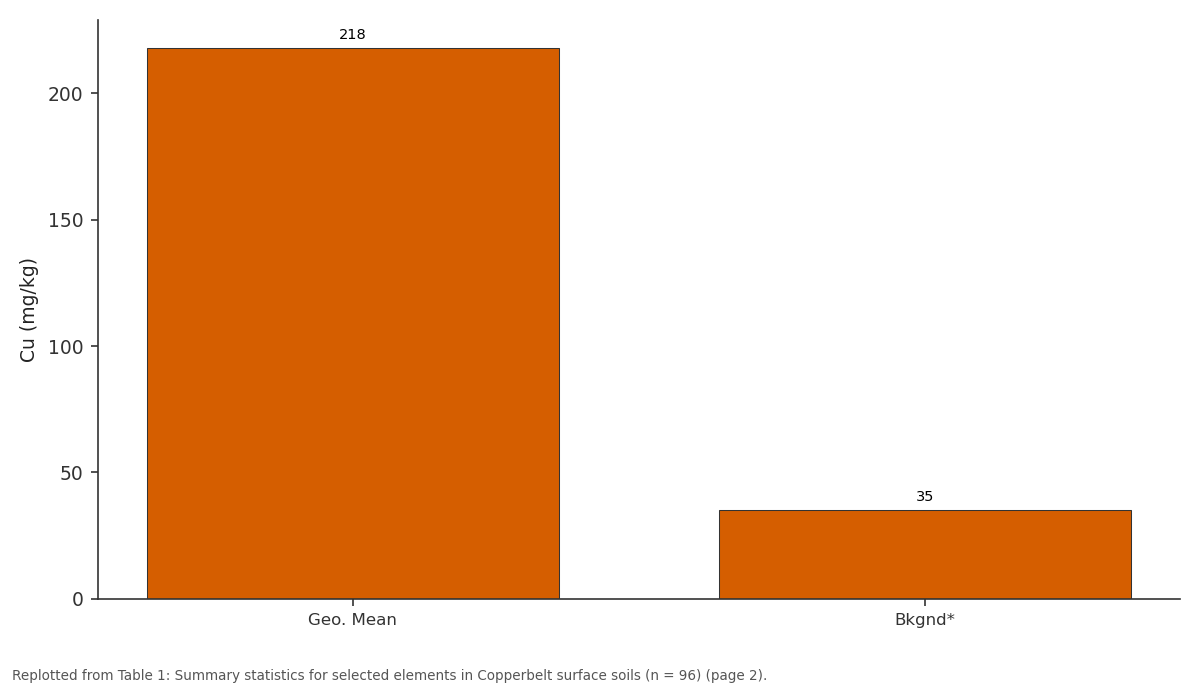
Cu (mg/kg): Geo. Mean vs Bkgnd*
Replotted from Table 1 (page 2) of the original paper. Every bar is the paper's own table value.
View source evidence ↗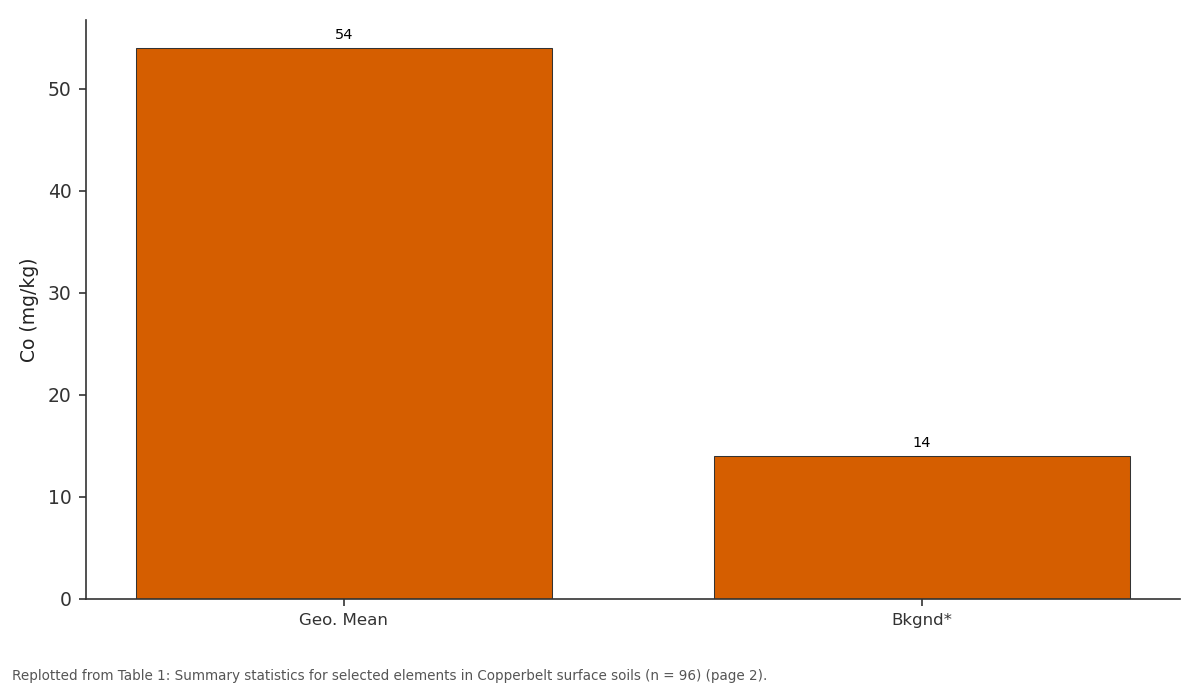
Co (mg/kg): Geo. Mean vs Bkgnd*
Replotted from Table 1 (page 2) of the original paper. Every bar is the paper's own table value.
View source evidence ↗Figures & tables
From the original paper Table 1
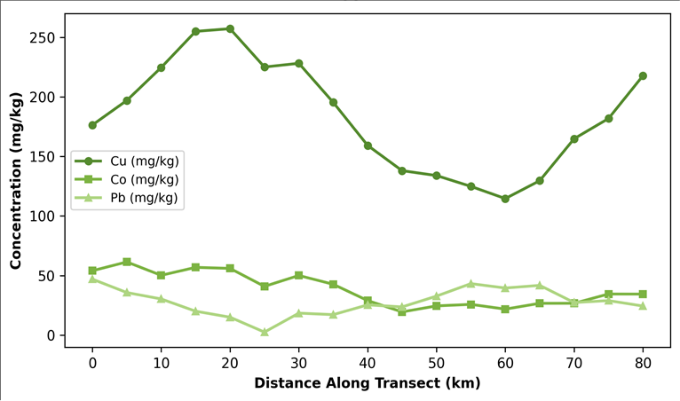 Figure 1
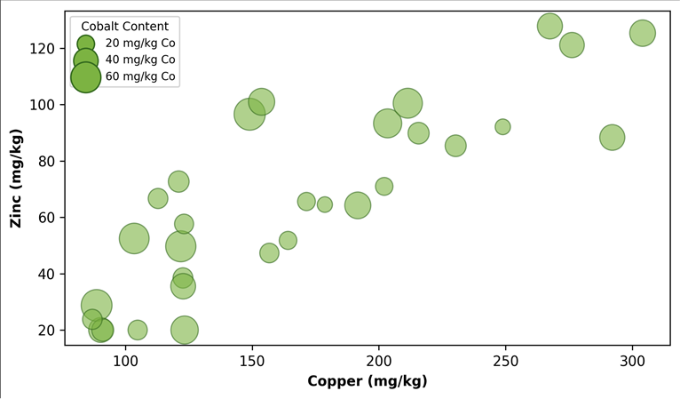 Figure 2
Introduction
A hypothesis that guides much of environmental geochemistry is that every landscape has a 'natural background'-a baseline concentration of elements in soil determined by parent rock, weathering, and pedogenesis-against which human-caused contamination can be measured [1] . But in mining districts with histories stretching back a century or more, the baseline may be obscured by diffuse pollution from smelter emissions, dust from waste dumps, and seepage from tailings ponds, making it hard to separate what nature put there from what industry added [2] . The Zambian Copperbelt, a 150-km-long metallogenic belt that has produced copper and cobalt continuously since the 1930s, is a case in point. The region hosts some of the world's largest underground and open-pit copper mines, and its smelters at Mufulira, Kitwe, and Chambishi have released sulphur dioxide and metal-laden particulates into the atmosphere for decades [3] . Previous research documented elevated copper and cobalt in stream sediments and agricultural soils near mining operations [4] , but a systematic, grid-based soil survey covering both mining-impacted and distal areas has not been published. Establishing a geochemical baseline requires distinguishing between anthropogenic enrichment and the naturally elevated background that characterises mineralised terrain. In the Copperbelt, even 'unimpacted' soils overlie copper-bearing bedrock, so background values are inherently higher than global averages [5] . Statistical tools-such as cumulative frequency plots, enrichment factors referenced to conservative elements, and principal component analysis (PCA)-can help separate these overlapping signals [6] . This research aimed to: (a) map the spatial distribution of 12 elements in surface soils across an 80-km Copperbelt transect, (b) estimate the pre-mining geochemical background using statistical decomposition, (c) calculate enrichment factors relative to that background, and (d) identify the principal geochemical associations using PCA [7] .
Spatial Data Processing
Element concentrations at the 96 sampling points were interpolated onto a continuous 100-m resolution grid using ordinary kriging in ArcGIS 10.8. Experimental variograms were fitted with spherical models for each element; nuggetto-sill ratios ranged from 0.21 (Cu) to 0.54 (Ca), indicating moderate-to-strong spatial dependence for the miningassociated elements and weaker structure for lithogenic elements [6] . Cross-validation by leave-one-out jackknifing yielded mean absolute errors of 14-22% for Cu, Co, and Zn, which is acceptable for reconnaissance-scale baseline mapping. Wind-rose data from Kitwe airport (predominant wind from the east-southeast) were overlaid on the Cu enrichment map to test for a downwind deposition gradient from smelters [3] .
Limitations
The 0-15 cm sampling depth captures the zone most affected by atmospheric deposition but may miss deeper contamination from leachate migration. The 2-km grid spacing cannot resolve sub-kilometre features such as individual waste-rock dumps or tailings seepage plumes. The pre-mining background estimate relies on statistical inference from distal samples rather than on pre-mining archived samples, which are not available for the Zambian Copperbelt [2] . Future work should include depth profiling and comparison with archived colonial-era soil samples where these can be located in museum collections.
Material and Methods
Material and Methods
Material
Ninety-six composite soil samples were collected on a regular 2-km grid covering an 80-km east-west transect from Mufulira through Kitwe to Chambishi in June 2022 (dry season, to minimise waterlogged sites). At each grid node, five sub-samples within a 20-m radius were taken from the 0-15 cm horizon using a stainless-steel hand auger, composited in a polyethylene bag, and air-dried. Twenty additional samples from locations beyond 30 km from any known mining activity served as 'distal reference' points for background estimation. The research was conducted under institutional approval from the Hyderabad Institute of Climate and Environment (Protocol HICE/2022-015, approved 8 March 2022).
Methods
Samples were sieved to <2 mm, oven-dried at 40 degrees Celsius, and digested in aqua regia (HCl:HNO3, 3:1) following ISO 11466. Twelve elements (Cu, Co, Zn, Pb, Ni, Mn, Cr, As, Cd, Fe, Ca, Mg) were measured by ICP-OES (Thermo iCAP 7400). Certified reference material (NIST SRM 2710a Montana Soil) was analysed with every batch of 20 samples; recoveries ranged from 91% to 107%. Enrichment factors (EF) were calculated as EF = (Cx/CFe)sample / (Cx/CFe)background, where Fe served as the normalising element and background was the geometric mean of the distal reference set [1] . PCA was applied to logtransformed, standardised data using the varimax rotation in SPSS 28 [7] . *Background estimated from geometric mean of 20 distal reference samples. Table 1 shows that copper has the widest range (47-3,840 mg/kg) and highest enrichment factor (6.2), confirming it as the element most affected by mining. Iron, the normalising element, shows minimal enrichment (EF = 1.1), validating its use as a lithogenic reference. Figure 1 shows that copper concentrations peak sharply near the three smelter locations (approximate km 10, 35, and 65) and decline between them but never return to background.
| Element | Min | Max | Geo. Mean | Median | Bkgnd* | EF (mean) | % Sites >Bkgnd×2 |
|---|---|---|---|---|---|---|---|
| Cu (mg/kg) | 47 | 3,840 | 218 | 174 | 35 | 6.2 | 78.1 |
| Co (mg/kg) | 12 | 487 | 54 | 42 | 14 | 3.9 | 62.5 |
| Zn (mg/kg) | 28 | 614 | 87 | 71 | 31 | 2.8 | 54.2 |
| Pb (mg/kg) | 8 | 187 | 31 | 24 | 12 | 2.6 | 43.8 |
| As (mg/kg) | 3 | 94 | 14 | 11 | 5 | 2.8 | 47.9 |
| Fe (%) | 2.1 | 7.8 | 4.3 | 4.1 | 3.8 | 1.1 | 18.8 |
Table text extracted from the original PDF; superscript letters are shown inline. The original table image is below.
View original table image
Results
Cobalt follows a similar pattern at lower absolute values, while lead shows a more subdued profile, consistent with its lower abundance in the ore being processed.
Discussion
The PCA separated two clear factors: a 'mining' factor loaded on Cu, Co, Zn, and As (explaining 38.4% of variance) and a 'lithogenic' factor loaded on Fe, Mn, Cr, and Ni (24.7% of variance). This two-factor structure is consistent with the mineralogy of the Copperbelt, where copper-cobalt sulphides are hosted in metasedimentary rocks with a background of mafic-derived Fe-Mn-Cr-Ni signatures [5] . The separation confirms that, despite a century of mining, the natural geochemical fingerprint of the bedrock is still detectable in surface soils-a finding that supports the use of PCA-based decomposition for baseline estimation in other long-mined districts [6] . The enrichment-factor map for copper showed a clear downwind gradient from the three smelters, with EF values exceeding 10 within 3 km and declining to below 2 at roughly 25 km-matching the prevailing east-southeast wind direction and consistent with atmospheric-deposition modelling by Tembo et al. [4] . Localised hotspots superimposed on this regional gradient corresponded to tailings storage facilities and waste-rock dumps, where physical erosion and seepage add to the airborne load. From a land-use planning perspective, the 78% of grid nodes exceeding twice the estimated background for copper raises questions about the suitability of Copperbelt soils for agriculture. While the total concentrations reported here do not directly equate to bioavailable fractions-copper bound to iron oxides in laterite soils is less mobile than copper in sandy soils [2] -the scale of enrichment warrants speciation and crop-uptake testing before agricultural expansion is encouraged in the peri-mining zone. Priority actions include speciation analysis of the most enriched sites, assessment of crop metal uptake in perimining agricultural fields, and integration of the geochemical baseline with ongoing air-quality monitoring to track the effectiveness of smelter emission controls.
Conclusion
Conclusion
Acknowledgement
Acknowledgements
Figures and tables from the paper
References
19 in the original paper- Reimann C, De Caritat P. Distinguishing between natural and anthropogenic sources for elements in the environment: Regional geochemical surveys versus enrichment factors. Science of the Total Environment. 2005;337(1-3):91-107.
- Ettler V. Soil contamination near non-ferrous metal smelters: A review. Applied Geochemistry. 2016;64:56-74.
- Vetter W, Hamumba MR, Bettinger T, Mutti E. Pilot assessment of the environmental contamination in the Copperbelt Province, Zambia. Toxicological and Environmental Chemistry. 2008;90(5):879-889.
- Tembo BD, Sichilongo K, Cernak J. Distribution of copper, lead, cadmium and zinc concentrations in soils around Kabwe town in Zambia. Chemosphere. 2006;63(3):497-501.
- Kampunzu AB, Cailteux J. Tectonic evolution of the Lufilian arc during Neoproterozoic Pan-African orogenesis. Gondwana Research. 1999;2(3):401-421.
- Reimann C, Filzmoser P, Garrett RG. Background and threshold: Critical comparison of methods of determination. Science of the Total Environment. 2005;346(1-3):1-16.
- Davis JC. Statistics and Data Analysis in Geology, 3rd ed. John Wiley. 2002;New York:638.
- Kříbek B, Majer V, Knésl I, et al. Contamination of soils with dust fallout from the Nkana copper smelter at Kitwe, Zambia. Journal of African Earth Sciences. 2016;123:53-63.
- Plant JA, Kinniburgh DG, Smedley PL, Fordyce FM, Klinck BA. Arsenic and selenium. In: Treatise on Geochemistry. Elsevier. 2003;9:17-66.
- Goovaerts P. Geostatistics for Natural Resources Evaluation. Oxford University Press. 1997;New York:483.
- Matheron G. Principles of geostatistics. Economic Geology. 1963;58(8):1246-1266.
- Rawlins BG, McGrath SP, Scheib AJ, et al. The Advanced Soil Geochemical Atlas of England and Wales. British Geological Survey. 2012;Keyworth:227.
- Salminen R, Tarvainen T, Demetriades A, et al. FOREGS Geochemical Atlas of Europe. Geological Survey of Finland. 2005;Espoo:526.
- Darnley AG, Björklund A, Bølviken B, et al. A Global Geochemical Database for Environmental and Resource Management. UNESCO Publishing. 1995;Paris:122.
- Li X, Feng L. Multivariate and geostatistical analyzes of metals in urban soil of Weinan industrial areas, northwest of China. Atmospheric Environment. 2012;47:58-65.
- Cicchella D, De Vivo B, Lima A. Background and baseline concentration values of elements harmful to human health in the volcanic soils of the metropolitan and provincial areas of Napoli (Italy). Geochemistry Exploration Environment Analysis. 2005;5(1):29-40.
- Hawkes HE, Webb JS. Geochemistry in Mineral Exploration. Harper and Row. 1962;New York:415.
- Förstner U, Wittmann GTW. Metal Pollution in the Aquatic Environment, 2nd ed. Springer. 1981;Berlin:486.
- Dung TTT, Cappuyns V, Swennen R, Phung NK. From geochemical background determination to pollution assessment of heavy metals in sediments and soils. Reviews in Environmental Science and Biotechnology. 2013;12(4):335-353.