
Research article · 2025 · Full text
International Journal of Geography Geology and EnvironmentMapping of soil organic matter quality using spectroscopic techniques in Brazilian Oxisols
Volume 7(11) · Pages 170–173 · DOI: 10.22271/27067483.2025.v7.i11c.701 ↗
Research areasSoil Geostatistics and MappingSoil Carbon and Nitrogen DynamicsSpectroscopy and Chemometric Analyses
Abstract
Author-writtenSoil organic matter quality determines fertility, structure, and carbon storage capacity, yet conventional characterisation methods are time-consuming and costly. This research evaluates vis-NIR (350–2500 nm) and MIR (4000–400 cm⁻¹) spectroscopy for predicting SOM quality parameters in Cerrado Oxisols across four representative landscapes in Goiás, Minas Gerais, and São Paulo. From 412 samples, MIR yielded R² > 0.85 for TOC, particulate organic matter (POM), and humic acid content. Vis-NIR performed well for TOC (R² = 0.87) but showed reduced accuracy for chemically defined humic fractions (R² = 0.68 for humic acid). TOC declined 35% from native cerrado (28.4 g/kg) to established soybean-maize rotation (18.6 g/kg), with POM declining 52% versus only 24% for mineral-associated organic matter, indicating preferential loss of labile fractions under cultivation. Spectroscopic mapping revealed systematic spatial variation related to land use history and distance from remnant vegetation, with TOC declining approximately 2.4 g/kg per 100 m from natural vegetation boundaries. The results demonstrate that spectroscopic methods enable rapid, cost-effective assessment of SOM quality at landscape scale, supporting monitoring of soil health under changing management.
Summary
Source-checkedPlain-language reading of the full paper, prepared with AI and checked against the text. Each point links to the authors' own words.
Why it matters
- Soil organic matter (SOM) quality is critical for soil fertility, structure, and carbon storage, but traditional methods to measure it are expensive and slow. View evidence ↗
- About 50% of the Brazilian Cerrado has been converted to agriculture in the last 50 years, which significantly alters soil organic matter dynamics. View evidence ↗
- Measuring the ratio of persistent mineral-associated organic matter (MAOM) to more labile particulate organic matter (POM) provides better insight into carbon vulnerability than total organic carbon (TOC) alone. View evidence ↗
The question
- The study aims to evaluate if vis-NIR and MIR spectroscopy can accurately predict SOM quality parameters in Cerrado Oxisols and be used for landscape-scale mapping. View evidence ↗
What they did
- Samples were collected from four landscape types in Goiás, Minas Gerais, and São Paulo: native reserves, recently converted areas (<5 years), established soybean-maize rotations (>15 years), and integrated crop-livestock-forestry (CLF) systems. View evidence ↗
- The researchers analyzed 412 soil samples collected from a 100 m grid at a depth of 20 cm. View evidence ↗
- Vis-NIR and MIR spectra were measured using an ASD FieldSpec 4 and a Bruker Tensor 27 FTIR, respectively, with data analyzed via PLS regression. View evidence ↗
What they found
- MIR spectroscopy showed high accuracy for predicting total organic carbon (TOC) with an R² of 0.92, slightly outperforming vis-NIR (R² = 0.87). View evidence ↗
- While TOC declined by 35% under cultivation, the labile particulate organic matter (POM) declined more severely (52%) than the mineral-associated organic matter (MAOM), which declined by 24%. View evidence ↗
- TOC levels declined by approximately 2.4 g/kg for every 100 meters of distance from natural vegetation boundaries. View evidence ↗
What it means
- The authors conclude that both spectroscopic methods are effective, but MIR is superior for predicting chemical fractions due to its ability to detect specific organic functional groups. View evidence ↗
- The authors suggest that future work should expand calibration to more soil types and management systems and use repeated surveys to track temporal changes. View evidence ↗
Visual summary
3 visualsIllustrations explain the paper; charts are replotted from the paper's own table values.
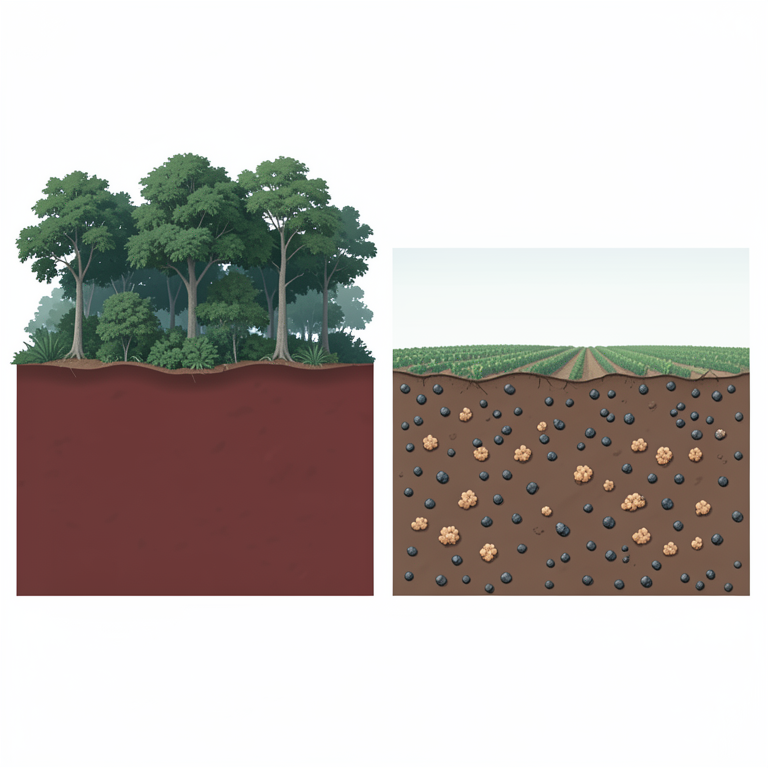
Differential Carbon Loss
AI-generated conceptual illustration (Brazilian Oxisol soil profiles under native vegetation and cultivated cropland). It explains the idea and does not show study data.
View source evidence ↗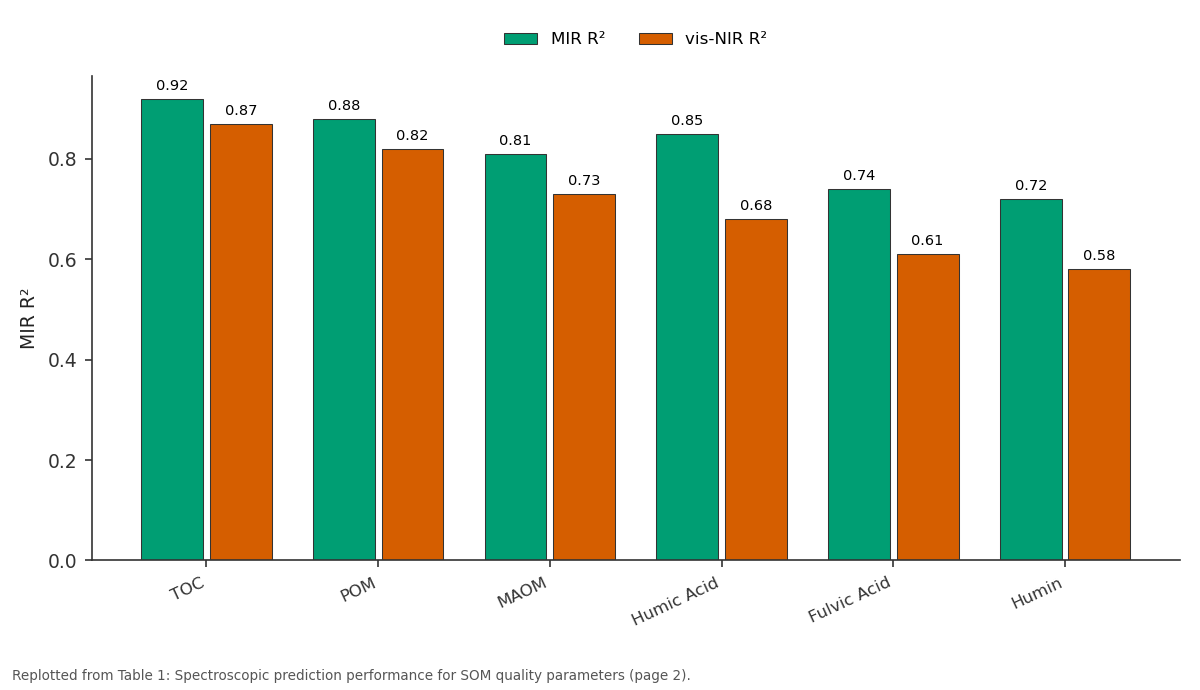
MIR R² and vis-NIR R²: TOC vs POM vs MAOM vs Humic Acid vs Fulvic Acid
Replotted from Table 1 (page 2) of the original paper. Every bar is the paper's own table value.
View source evidence ↗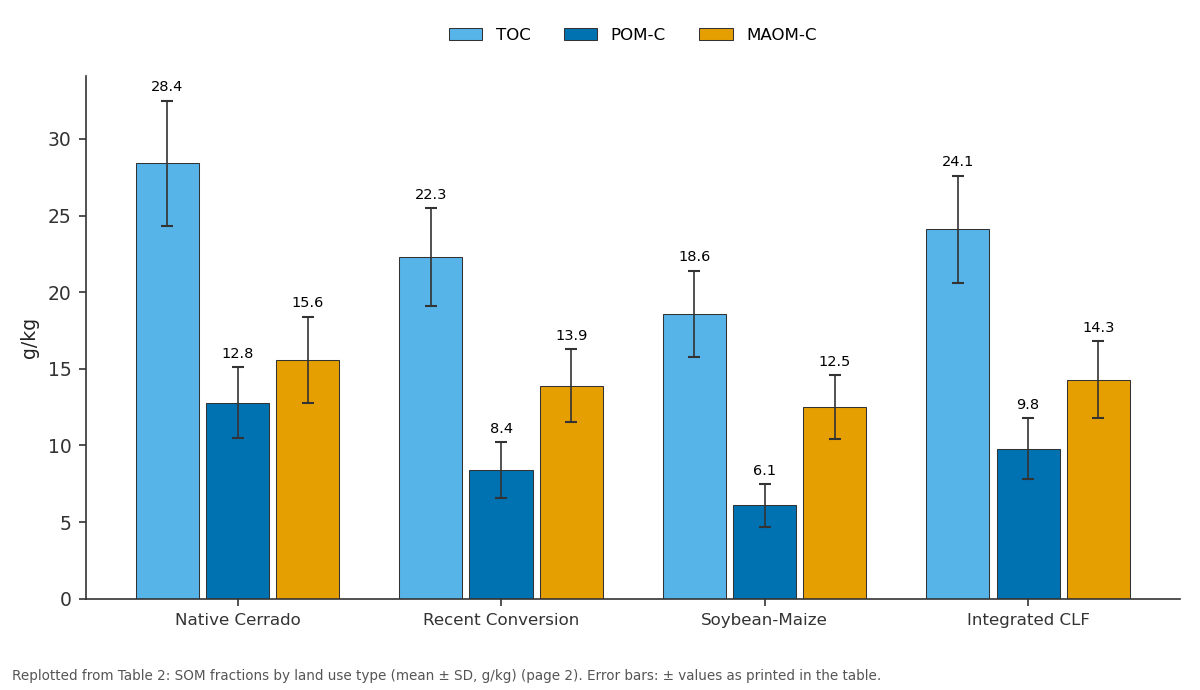
TOC and POM-C and more: Native Cerrado vs Recent Conversion vs Soybean-Maize vs Integrated CLF
Replotted from Table 2 (page 2) of the original paper. Every bar is the paper's own table value.
View source evidence ↗Figures & tables
From the original paper Table 1
 Table 2
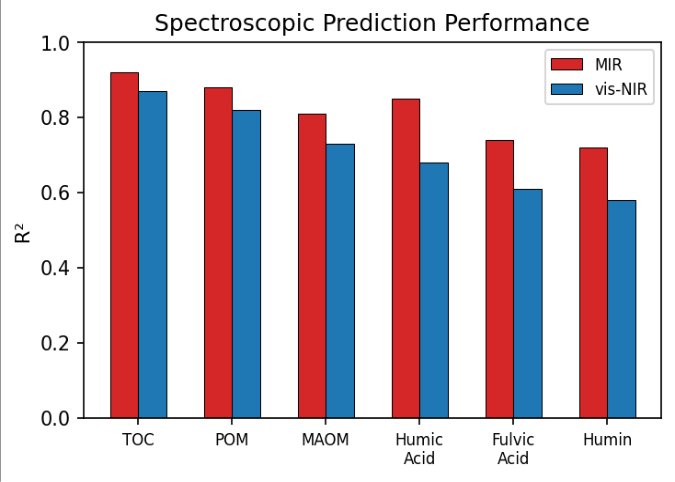 Figure 1
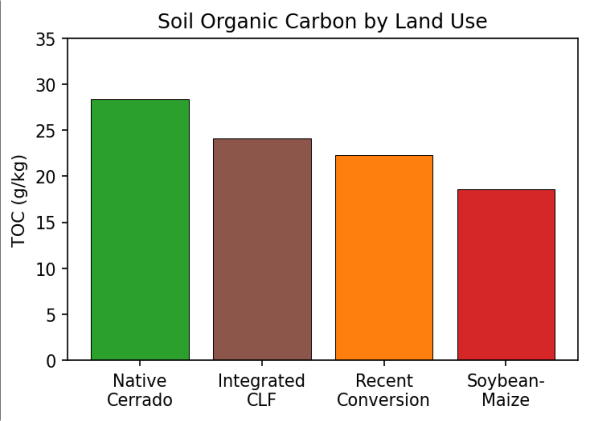 Figure 2
Introduction
The Brazilian Cerrado, the world's most species-rich tropical savanna, has experienced approximately 50% conversion to agriculture over the past five decades [1] . This transformation profoundly affects SOM dynamics as deep-rooted native vegetation is replaced with annual crops, altering the balance between organic inputs and decomposition [2] . Understanding SOM quantity and quality is essential for assessing soil health and predicting carbon trajectories. Oxisols, dominated by kaolinite and Fe/Al oxides, interact distinctively with organic matter. Mineral-associated organic matter (MAOM), stabilised through adsorption onto clay and oxide surfaces, is more persistent than particulate organic matter (POM) consisting of partially decomposed residues [3] . Their relative proportions indicate the vulnerability of stored carbon to loss under changed management, making them more informative than TOC alone [4,5] . Spectroscopic methods-vis-NIR and MIR diffuse reflectance-offer rapid, non-destructive alternatives to wet chemistry at approximately one-tenth the cost per sample [6] . While TOC prediction from soil spectra is well established, prediction of SOM quality parameters including physical and chemical fractions has received less attention and represents an important frontier [7,8] . This research evaluates both spectral regions for predicting a comprehensive suite of SOM quality parameters in Cerrado Oxisols and demonstrates application for landscape-scale mapping of organic matter quality variation related to land use and management [9,10] .
Research Area Description
Four representative Cerrado landscapes were sampled in Goiás, Minas Gerais, and São Paulo: native cerrado reserve, recently converted agricultural area (<5 years), established soybean-maize rotation (>15 years), and an integrated crop-livestock-forestry (CLF) system. Annual precipitation averages 1,400-1,700 mm with distinct dry season. Soils are predominantly Red Latosols (Oxisols) with 35-65% clay content [1] .
Material and Methods Material
Samples (n = 412) were collected on a 100 m grid to 20 cm depth, air-dried, sieved to <2 mm. TOC was determined by LECO TruMac combustion. Physical fractionation separated POM (>53 μm after dispersion) and MAOM (<53 μm) [3] . Chemical fractionation isolated humic acid, fulvic acid, and humin following the IHSS protocol. All fraction carbon contents were determined by dry combustion [4,11] .
Methods
Vis-NIR spectra (ASD FieldSpec 4 with contact probe, 3-10 nm resolution) and MIR spectra (Bruker Tensor 27 FTIR with diffuse reflectance accessory, 4 cm⁻¹ resolution) were measured under standardised conditions. PLS regression with leave-one-out cross-validation determined optimal latent variables. Performance was assessed by R², RMSECV, and ratio of performance to deviation (RPD). Cross-landscape model transferability was tested by applying models calibrated on each landscape to the other three [6,12] . Spectral Feature Attribution MIR spectra showed distinct absorptions at 2920 cm⁻¹ (aliphatic C-H), 1630 cm⁻¹ (aromatic C=C and carboxylate), and 1030 cm⁻¹ (C-O polysaccharide). The aromatic/aliphatic peak ratio discriminated native cerrado soils (higher aromatic) from cultivated soils (more aliphatic), reflecting selective preservation of recalcitrant compounds under cultivation. These feature attributions explain MIR's superior prediction of chemically defined fractions compared to vis-NIR [7,8] . MIR consistently outperformed vis-NIR (Figure 1), with the greatest advantage for chemically defined fractions where specific mid-infrared absorption features provide direct spectral signatures for organic functional groups. The 35% TOC decline from native cerrado to soybeanmaize (Figure 2) masks differential fraction losses: POM declined 52% while MAOM declined only 24%, indicating preferential loss of the labile pool under cultivation.
Results
Results
Comprehensive Interpretation
The convergence of spectroscopic, physical fractionation, and chemical fractionation data demonstrates that total carbon alone underestimates the functional degradation of SOM under cultivation. The integrated CLF system showed intermediate values, suggesting partial SOM quality recovery under diversified management practices.
Discussion
The MIR prediction performance (R² = 0.92 for TOC) meets or exceeds published benchmarks for tropical soils [6,7] . The one-tenth cost enables order-of-magnitude increases in sampling density for the same budget, essential for detecting management-induced changes at farm and landscape scales [8] . Cross-landscape model transferability was reduced when native cerrado models were applied to cultivated sites due to mineralogical matrix changes under cultivation, suggesting that robust monitoring systems need calibration spanning the full management range [9,12] . The distance-dependent TOC gradient from remnant vegetation boundaries (-2.4 g/kg per 100 m) suggests that landscape-level management of remnant vegetation placement could influence adjacent soil carbon patterns [10] . The integrated CLF system's intermediate TOC values are encouraging for carbon recovery potential under diversified management. Carbon accumulation rates from published chronosequence data suggest that conversion to CLF systems could restore approximately 60% of the native cerrado TOC within 15-20 years of implementation [5,13,14] .
Conclusion
MIR and vis-NIR spectroscopy effectively predict SOM quality parameters in Cerrado Oxisols. MIR provides superior accuracy for chemically defined fractions due to specific organic functional group absorptions in the midinfrared region. The preferential loss of labile POM under cultivation indicates that TOC alone underestimates SOM functional degradation. Spectroscopic mapping at landscape scale reveals management-related spatial patterns that provide actionable information for sustainable soil planning. Future research should expand calibration across a wider range of Cerrado soil types and management systems and evaluate temporal changes through repeated spectroscopic surveys to assess the effectiveness of conservation practices in restoring SOM quality.
Acknowledgement
Acknowledgements Funding SourcesThis research was supported by departmental research funds from the Department of Mineral Resources, Nakuru Centre for Geological Research. No external grant numbers are associated with this work.
Figures and tables from the paper
| Parameter | MIR R² | MIR RPD | vis-NIR R² | vis-NIR RPD |
|---|---|---|---|---|
| TOC | 0.92 | 3.5 | 0.87 | 2.8 |
| POM | 0.88 | 2.9 | 0.82 | 2.4 |
| MAOM | 0.81 | 2.3 | 0.73 | 1.9 |
| Humic Acid | 0.85 | 2.6 | 0.68 | 1.8 |
| Fulvic Acid | 0.74 | 2.0 | 0.61 | 1.6 |
| Humin | 0.72 | 1.9 | 0.58 | 1.5 |
Table text extracted from the original PDF; superscript letters are shown inline. The original table image is below.
View original table image
| Land Use | TOC | POM-C | MAOM-C | Humic Acid-C |
|---|---|---|---|---|
| Native Cerrado | 28.4 ± 4.1 | 12.8 ± 2.3 | 15.6 ± 2.8 | 8.4 ± 1.6 |
| Recent Conversion | 22.3 ± 3.2 | 8.4 ± 1.8 | 13.9 ± 2.4 | 6.1 ± 1.2 |
| Soybean-Maize | 18.6 ± 2.8 | 6.1 ± 1.4 | 12.5 ± 2.1 | 4.8 ± 0.9 |
| Integrated CLF | 24.1 ± 3.5 | 9.8 ± 2.0 | 14.3 ± 2.5 | 7.2 ± 1.4 |
Table text extracted from the original PDF; superscript letters are shown inline. The original table image is below.
View original table image
References
16 in the original paper- Klink CA, Machado RB. Conservation of the Brazilian Cerrado. Conserv Biol. 2005;19(3):707-713.
- Lal R. Soil carbon sequestration impacts on global climate change and food security. Science. 2004;304(5677):1623-1627.
- Cambardella CA, Elliott ET. Particulate soil organic matter changes across a grassland cultivation sequence. Soil Sci Soc Am J. 1992;56(3):777-783.
- Six J, Conant RT, Paul EA, Paustian K. Stabilization mechanisms of soil organic matter. Ecosystems. 2002;5(7):672-687.
- Marchão RL, Becquer T, Brunet D, et al. Carbon and nitrogen stocks in a Brazilian clayey Oxisol. Agric Ecosyst Environ. 2009;129(1-3):1-8.
- Viscarra Rossel RA, et al. Visible, near infrared, mid infrared spectroscopy for soil assessment. Geoderma. 2006;131(1-2):59-75.
- Soriano-Disla JM, Janik LJ, Viscarra Rossel RA, et al. The performance of visible, near-, and mid-infrared reflectance spectroscopy. Appl Spectrosc Rev. 2014;49(2):139-186.
- Stenberg B, Viscarra Rossel RA, Mouazen AM, Wetterlind J. Visible and near infrared spectroscopy in soil science. Adv Agron. 2010;107:163-215.
- Bellon-Maurel V, McBratney A. Near-infrared (NIR) and mid-infrared (MIR) spectroscopic techniques for soil carbon assessment. In: Soil carbon science, management and policy. 2011. p. 105-122.
- Vasques GM, Grunwald S, Sickman JO. Comparison of multivariate methods for inferential modeling of soil carbon. Geoderma. 2008;146(1-2):14-25.
- Stevenson FJ. Humus chemistry: genesis, composition, reactions. New York: John Wiley and Sons; 1994. 496 p.
- Wold S, Sjöström M, Eriksson L. PLS-regression: a basic tool of chemometrics. Chemometr Intell Lab Syst. 2001;58(2):109-130.
- Bayer C, Martin-Neto L, Mielniczuk J, et al. Carbon sequestration in two Brazilian Cerrado soils under notill. Soil Tillage Res. 2006;86(2):237-245.
- Maia SMF, Ogle SM, Cerri CEP, Cerri CC. Effect of grassland management on soil carbon sequestration in Rondônia, Brazil. Glob Change Biol. 2009;15(1):163174.
- Demattê JAM, Bellinaso H, Araujo SR, et al. Soil analytical quality control by spectroscopy. Geoderma. 2019;338:53-63.
- Nocita M, Stevens A, van Wesemael B, et al. Soil spectroscopy: an alternative to wet chemistry. Adv Agron. 2015;132:139-159.