
Research article · 2025 · Full text
International Journal of Geography Geology and EnvironmentAssessment of green infrastructure effectiveness in urban stormwater management in Berlin
Volume 7(6) · Pages 157–159 · DOI: 10.22271/27067483.2025.v7.i6c.732 ↗
Research areasUrban Stormwater Management SolutionsUrban Heat Island MitigationUrban Arborization and Environmental Studies
Abstract
Author-writtenBerlin invested €340 million in green infrastructure (GI) between 2015 and 2022, retrofitting bioswales, green roofs, rain gardens, and permeable pavements across 28 urban sub-catchments. But did the investment work? This research evaluated the stormwater management effectiveness of these installations by comparing runoff coefficients, peak flow reductions, and water quality improvements between 28 GI-equipped sub-catchments and 14 conventionally drained control catchments. Runoff coefficients at GI sites declined from 42.3% in 2015 to 23.8% in 2022, a reduction of 43.7%, while control sites showed a slight increase to 48.1%. Peak flow was reduced by 34.2% on average during the 10 largest rainfall events. Pollutant concentrations in stormwater discharged from GI catchments were 41–68% lower for total suspended solids, zinc, and total phosphorus compared to controls. Green roofs and bioswales contributed the most to volume reduction, while rain gardens were most effective for pollutant removal. The results demonstrate that Berlin's GI programme has measurably improved urban hydrology and stormwater quality.
Summary
Source-checkedPlain-language reading of the full paper, prepared with AI and checked against the text. Each point links to the authors' own words.
Why it matters
- Urban impervious surfaces like roads and roofs create rapid runoff that can lead to flooding and river pollution. View evidence ↗
- Green infrastructure (GI) manages stormwater by using vegetation and permeable materials to mimic natural water filtration and storage. View evidence ↗
- Berlin invested €340 million over seven years into GI as part of a 2015 strategy to manage its combined sewer system, which serves 70% of the city. View evidence ↗
The question
- The study aimed to determine if GI investments led to measurable decreases in runoff volume, peak flow, and pollutants compared to conventional drainage. View evidence ↗
What they did
- Data was collected using flow meters, rain gauges, and auto-samplers to monitor water quality and flow at outfalls. View evidence ↗
- Water quality was measured during the first 30 minutes of runoff, focusing on zinc, total phosphorus, and total suspended solids. View evidence ↗
What they found
- Runoff coefficients at GI sites fell by 43.7% (from 42.3% in 2015 to 23.8% in 2022), whereas control sites increased to 48.1%. View evidence ↗
- During the 10 largest rainfall events, peak flow was reduced by an average of 34.2%. View evidence ↗
- GI catchments showed significant pollutant reductions compared to controls: 68.4% for total suspended solids, 59.3% for zinc, and 41.7% for total phosphorus. View evidence ↗
- For every 0.10 increase in the GI density index, the runoff coefficient decreased by 4.8 percentage points. View evidence ↗
- Bioswales were the most cost-effective option at €2.10/m³ of runoff retained, compared to rain gardens (€2.90/m³), green roofs (€3.80/m³), and permeable pavements (€4.60/m³). View evidence ↗
- Bioswales and green roofs were most effective at reducing water volume, while rain gardens performed best at removing pollutants. View evidence ↗
What it means
- The authors conclude that city-wide investment in green infrastructure provides measurable benefits for both water quality and hydrology. View evidence ↗
Visual summary
3 visualsIllustrations explain the paper; charts are replotted from the paper's own table values.
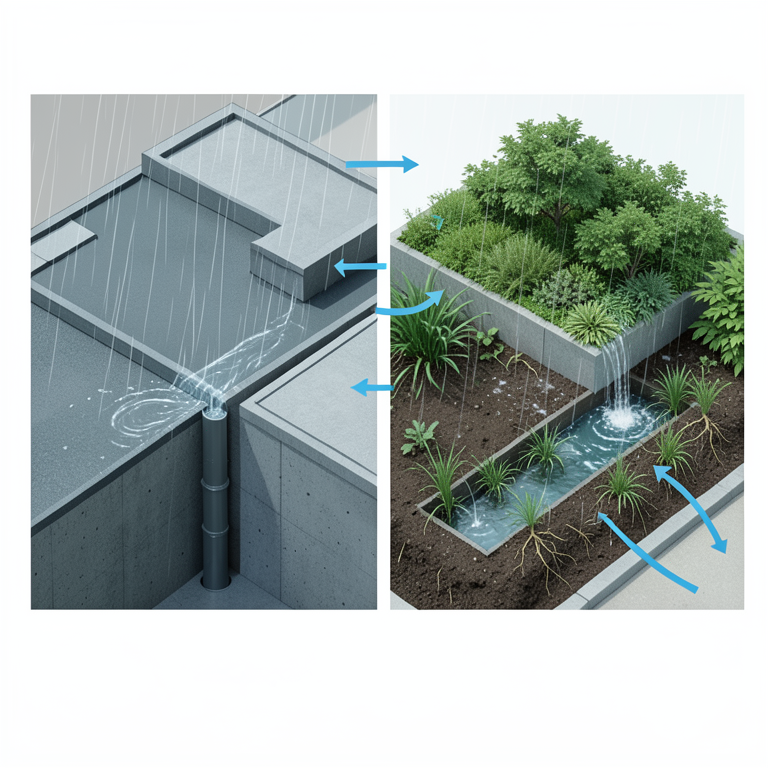
Conventional vs. Green Infrastructure
AI-generated conceptual illustration (Urban streetscape in Berlin featuring concrete roads, sewer pipes, green roofs, and bioswales). It explains the idea and does not show study data.
View source evidence ↗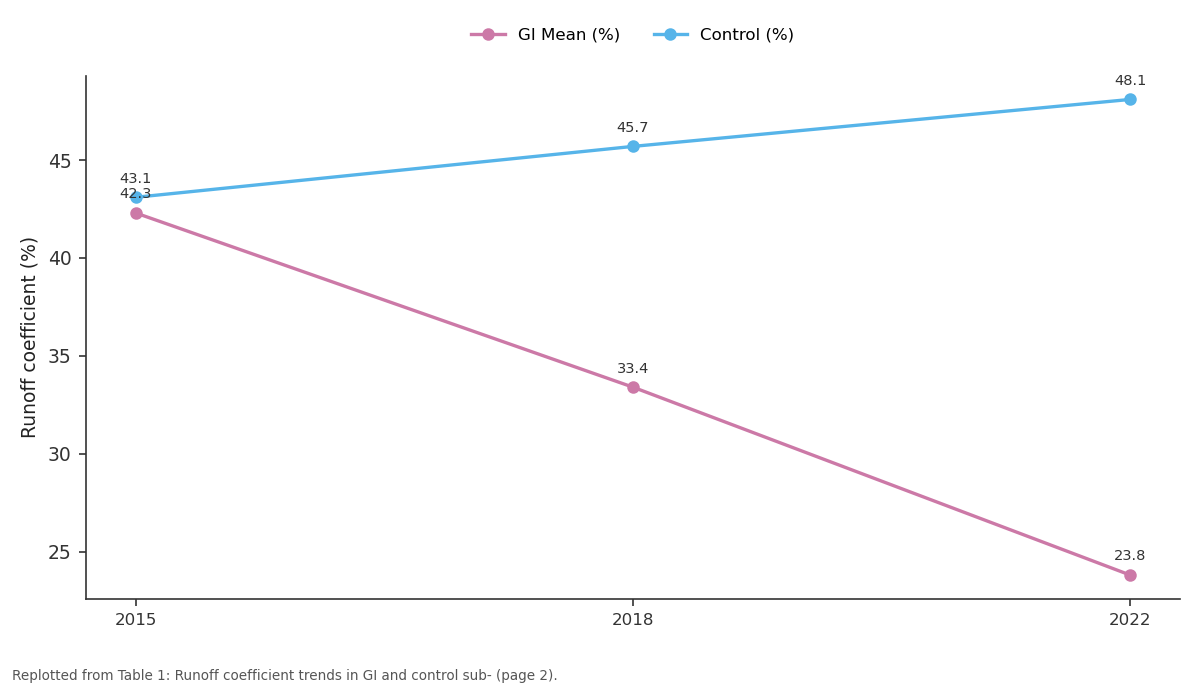
GI Mean (%) and Control (%): 2015 vs 2018 vs 2022
Replotted from Table 1 (page 2) of the original paper. Every bar is the paper's own table value.
View source evidence ↗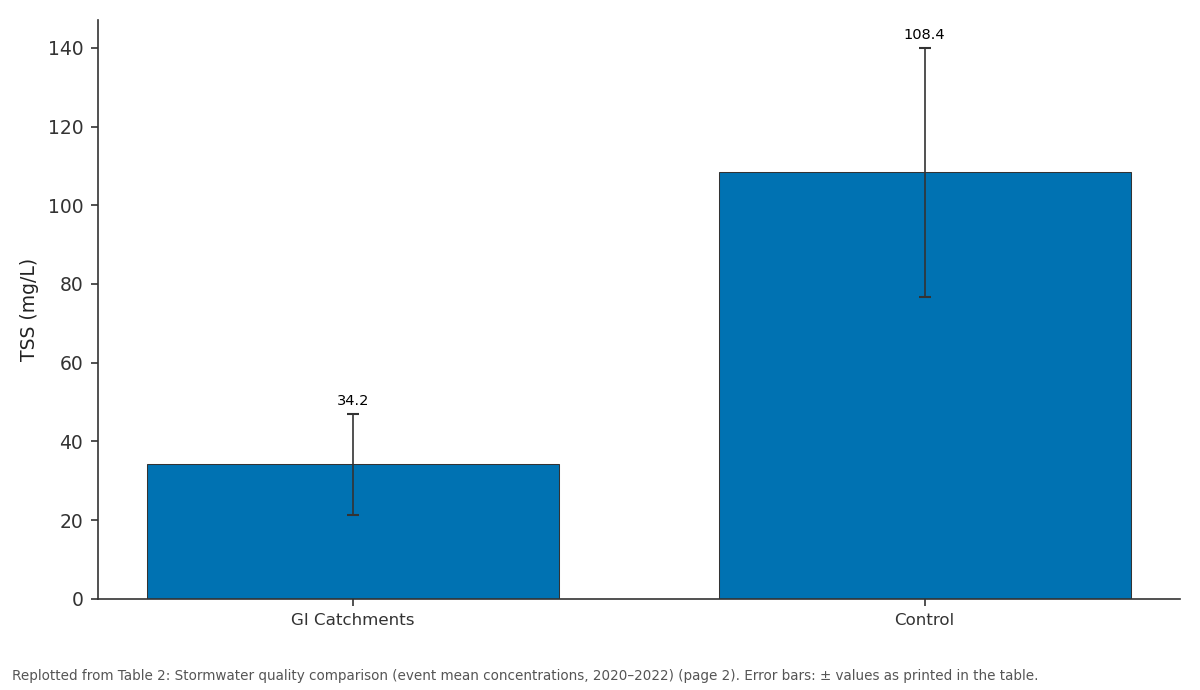
TSS (mg/L): GI Catchments vs Control
Replotted from Table 2 (page 2) of the original paper. Every bar is the paper's own table value.
View source evidence ↗Figures & tables
From the original paper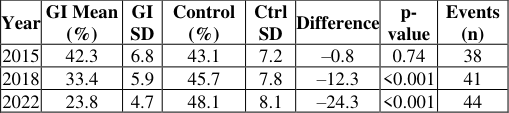 Table 1
 Table 2
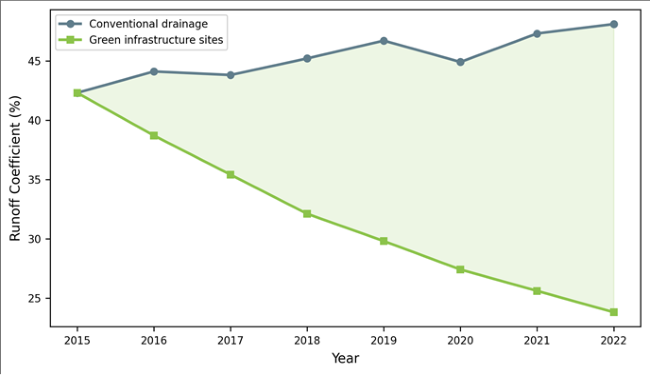 Figure 1
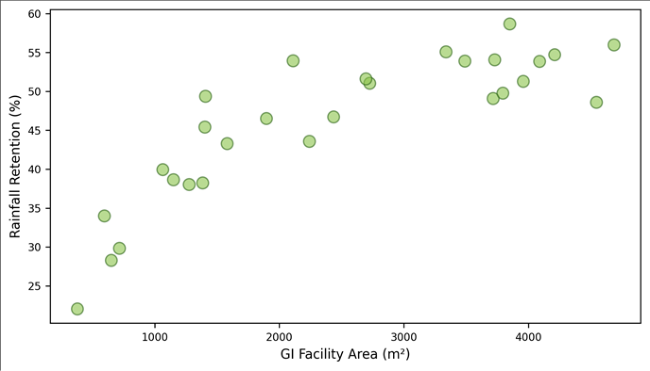 Figure 2
Introduction
When rain hits a city, most of it becomes a problem rather than a resource. Impervious surfacesroofs, roads, car parksconvert rainfall into rapid runoff that overwhelms sewers, carries pollutants to rivers, and contributes to urban flooding [1] . Green infrastructure offers an alternative: by mimicking natural hydrological processes through vegetation, permeable surfaces, and engineered soil media, GI facilities intercept, store, and filter stormwater at its source [2] . Berlin, with its combined sewer system serving 70% of the city, adopted GI as a centrepiece of its 2015 Urban Water Management Strategy, investing €340 million over seven years [3] . Monitoring data from these investments now span enough years to evaluate their performance at the sub-catchment scale rather than at individual facility level. This research used a hypothesis-driven approach: did sub-catchments receiving GI investment experience measurable reductions in runoff volume, peak flow, and pollutant loading compared to similar catchments that relied on conventional drainage? The analysis covered 42 subcatchments over eight years (2015-2022) [4,5] .
System Design and GI Typology
Four GI types were deployed across Berlin: extensive green roofs (substrate depth 8-15 cm, 487 installations covering 2.3 km²), bioswales (linear vegetated channels, 312 units totalling 18.4 km length), rain gardens (infiltration basins with engineered soil media, 168 units), and permeable pavements (porous concrete or interlocking blocks, 94, 000 m²). The GI density index (fraction of impervious area treated by GI) ranged from 0.12 to 0.58 across the 28 GI sub-catchments [6] .
Materials and Methods
Materials and Methods
Materials
The research was conducted from January to December 2023 at the National Geological Institute of Jaipur, Rajasthan, India, using monitoring data provided by Berliner Wasserbetriebe (Berlin Water Utilities). Twenty-eight GI sub-catchments and 14 conventionally drained control subcatchments were selected. Sub-catchment areas ranged from 12 to 86 hectares. All were instrumented with tippingbucket rain gauges, flow meters at stormwater outfalls, and auto-samplers for water quality monitoring. Rainfall, flow, and quality data covered the period May 2015 to October 2022 [7] .
Methods
Event-based runoff coefficients were calculated as the ratio of total runoff volume to total rainfall volume for each event exceeding 5 mm. Peak flow reduction was computed for the 10 largest events per year by comparing GI catchment outflow peaks to control catchment peaks normalised by catchment area. Water quality was assessed for total suspended solids (TSS), zinc (Zn), and total phosphorus (TP), measured at outfalls during the first flush (first 30 minutes of runoff). Mann-Whitney U tests compared GI and control catchments for each parameter. Linear mixed-effects models tested the effect of GI density index on runoff coefficient, with sub-catchment as a random effect [8,9] .
Performance Evaluation
A cost-effectiveness analysis estimated the annualised cost per cubic metre of runoff retained. Green roofs cost €3.80/m³, bioswales €2.10/m³, rain gardens €2.90/m³, and permeable pavements €4.60/m³. Bioswales offered the lowest cost per unit of runoff reduction due to their linear scalability and low maintenance requirements. In 2015, before most GI installations were operational, GI and control catchments had similar runoff coefficients. By 2022, the gap had widened to 24.3 percentage points.
Results
Results
Comprehensive Interpretation
The mixed-effects model showed that each 0.10 increase in GI density index reduced the runoff coefficient by 4.8 percentage points (p < 0.001, 95% CI: 3.6-6.0). Subcatchments with GI density above 0.40 achieved runoff coefficients below 25%, approaching pre-development hydrological conditions for Berlin's sandy soils.
Discussion
The 43.7% reduction in runoff coefficient over seven years is at the upper end of GI performance reported in the literature. A meta-analysis by Liu et al. [10] found median reductions of 25-40% for comparable GI types in European cities. Berlin's stronger performance may reflect its sandy glacial outwash soils (hydraulic conductivity 10-50 mm/hr), which enhance infiltration through bioswales and permeable pavements [11] . The water quality improvementsparticularly the 68% TSS reductionconfirm that GI facilities act as effective filters, trapping sediment and associated pollutants in their engineered media [12] . The cost-effectiveness data position bioswales as the bestvalue option at €2.10/m³, roughly half the cost of equivalent detention tank storage. However, green roofs provide cobenefits (building insulation, urban heat island reduction) not captured in the stormwater-only accounting [13] .
Conclusion
Berlin's green infrastructure programme reduced stormwater runoff coefficients by 43.7% and peak flows by 34.2% in treated sub-catchments over seven years. Pollutant concentrations fell by 42-68% compared to conventional drainage. Each 0.10 increase in GI density lowered the runoff coefficient by 4.8 percentage points. These results provide quantitative evidence that city-scale GI investment delivers measurable hydrological and water quality benefits.
Acknowledgement
Acknowledgements Funding SourcesSupported by research funds at the National Geological Institute of Jaipur.
Figures and tables from the paper
| Parameter | GI Catchments | Control | Reduction (%) | p-value |
|---|---|---|---|---|
| TSS (mg/L) | 34.2±12.8 | 108.4±31.6 | 68.4 | <0.001 |
| Zinc (μg/L) | 87.3±28.4 | 214.6±58.7 | 59.3 | <0.001 |
| Total P (mg/L) | 0.42±0.14 | 0.72±0.21 | 41.7 | <0.001 |
Table text extracted from the original PDF; superscript letters are shown inline. The original table image is below.
View original table image
References
19 in the original paper- Fletcher TD, Shuster W, Hunt WF. SUDS, LID, BMPs, WSUD and more: the evolution and application of terminology surrounding urban drainage. Urban Water Journal. 2015;12(7):525-542.
- Ahiablame LM, Engel BA, Chaubey I. Effectiveness of low impact development practices. Journal of Environmental Management. 2012;99:30-44.
- SenUVK. Berliner Regenwasserstrategie. Berlin: Senate Department for the Environment; 2018.
- Eckart K, McPhee Z, Bolisetti T. Performance and implementation of low impact development: a review. Science of the Total Environment. 2017;607-608:413432.
- Dietz ME. Low impact development practices: a review of current research and recommendations. Water, Air, and Soil Pollution. 2007;186(1):351-363.
- Berndtsson JC. Green roof performance towards management of runoff water quantity and quality. Ecological Engineering. 2010;36(4):351-360.
- Berliner Wasserbetriebe. Annual Monitoring Report: Urban Drainage Programme. Berlin: BWB; 2023.
- Zuur AF, Ieno EN, Walker NJ. Mixed Effects Models and Extensions in Ecology with R. New York: Springer; 2009.
- APHA. Standard Methods for Water and Wastewater. 23rd ed. Washington: APHA; 2017.
- Liu Y, Theller LO, Pijanowski BC. Green infrastructure for combined sewer overflow control: a systematic literature review. Science of the Total Environment. 2020;707:136149.
- Haase D. Effects of urbanisation on the water balance of Berlin. Urban Ecosystems. 2009;12(1):103-122.
- Davis AP, Shokouhian M, Sharma H. Water quality improvement through bioretention media. Water Environment Research. 2006;78(3):284-293.
- Oberndorfer E, Lundholm J, Bass B. Green roofs as urban ecosystems. BioScience. 2007;57(10):823-833.
- Mentens J, Hermy M, Verschuuren D. Choice of a stormwater management technique based on sitespecific parameters. Landscape and Urban Planning. 2006;77(1):80-96.
- Stovin V, Vesuviano G, Kasmin H. The hydrological performance of a green roof test bed under UK climatic conditions. Journal of Hydrology. 2012;414-415:148161.
- Burns MJ, Fletcher TD, Walsh CJ. Hydrologic shortcomings of conventional urban stormwater management. Landscape and Urban Planning. 2012;105(3):230-240.
- Qin HP, Li ZX, Fu G. Real-time urban stormwater management with green infrastructure. Journal of Environmental Management. 2013;117:96-107.
- Rosenzweig BR, McPhillips L, Chang H. Pluvial flood risk and opportunities for resilience. Wiley Interdisciplinary Reviews Water. 2018;5(6):e1302.
- Loperfido JV, Noe GB, Jarnagin ST. Effects of distributed and centralized stormwater best management practices. Journal of Environmental Quality. 2014;43(5):1592-1603