
Research article · 2025 · Full text
International Journal of Geography Geology and EnvironmentMagnetostratigraphy and sediment provenance of the Siwalik group in the Nepal Himalaya
Volume 7(10) · Pages 186–189 · DOI: 10.22271/27067483.2025.v7.i10c.655 ↗
Research areasGeomagnetism and Paleomagnetism StudiesPaleontology and Stratigraphy of FossilsGeological formations and processes
Abstract
Author-writtenThe Siwalik Group preserves one of the most complete records of Himalayan foreland basin sedimentation on the planet. This research established a magnetostratigraphic framework for a 5,200 m thick section in western Nepal, spanning roughly 13 Ma to 2 Ma, and paired it with detrital zircon U-Pb geochronology to track changes in sediment provenance through time. Eighty-five oriented core samples yielded a polarity sequence of seven normal and six reversed zones that were correlated with the geomagnetic polarity timescale (GPTS 2020). Thermal demagnetisation isolated a primary remanence component carried mainly by magnetite, with unblocking temperatures between 520°C and 580°C. Detrital zircon age spectra from 18 sandstone samples revealed a shift from Greater Himalayan crystalline sources (age peaks at 480 Ma and 1,850 Ma) in the Lower Siwalik to mixed Lesser Himalayan and recycled Tethyan sources (peaks at 350 Ma and 1,100 Ma) in the Middle Siwalik, and a pronounced young volcanic input (peak at 25 Ma) in the Upper Siwalik. These provenance changes record progressive southward migration of the thrust front and unroofing of deeper structural levels through the late Miocene and Pliocene. The integrated chronostratigraphic-provenance dataset provides a refined temporal anchor for understanding sediment routing and tectonic evolution in the central Himalayan foreland.
Summary
Source-checkedPlain-language reading of the full paper, prepared with AI and checked against the text. Each point links to the authors' own words.
Why it matters
- The Siwalik Group's sedimentary record is essential for reconstructing the evolution of the monsoon, erosion, and uplift in the Himalayan foreland basin. View evidence ↗
- There are existing gaps in regional correlations because certain areas of the Siwalik belt in western Nepal are poorly dated. View evidence ↗
- Changes in zircon age signatures in the sediment record the unroofing of deep crustal levels and the southward movement of major thrust sheets. View evidence ↗
The question
- The study aimed to create a polarity stratigraphy and numerical age model for a specific section, while using zircon geochronology to link sediment provenance changes to tectonic history. View evidence ↗
What they did
- The research focused on a 5,200 m composite section located along the Babai River in western Nepal's Dang District. View evidence ↗
- Eighteen sandstone samples were collected every 250-350 m to perform detrital zircon analysis. View evidence ↗
- U-Pb analyses were conducted using laser-ablation inductively coupled plasma mass spectrometry (LA-ICP-MS). View evidence ↗
What they found
- The identified polarity sequence spans chrons C5An.1n to C3n, establishing an age range from approximately 12.83 Ma to 2.15 Ma. View evidence ↗
- Sedimentation rates increased from 0.38 m/kyr in the Lower Siwalik to 0.72 m/kyr in the Upper Siwalik. View evidence ↗
- The Lower Siwalik was dominated by zircon grains aged ~480 Ma and ~1,850 Ma, indicating a Greater Himalayan Sequence source. View evidence ↗
- The Middle Siwalik showed peaks at ~350 Ma and ~1,100 Ma, suggesting contributions from the Tethyan Sedimentary Series and Lesser Himalayan. View evidence ↗
- The Upper Siwalik contained a strong volcanic-origin peak at ~25 Ma along with recycled Greater Himalayan grains. View evidence ↗
- Sediment sources evolved from the Greater Himalayan Sequence (13-10 Ma) to Lesser Himalayan material (10-6 Ma), and finally to young volcanic-arc grains (after 6 Ma). View evidence ↗
What it means
- The observed shifts in sediment provenance track the southward migration of the thrust front during the Pliocene and late Miocene. View evidence ↗
- The ~60 m sampling interval for palaeomagnetic cores may have caused the researchers to miss polarity events shorter than 50 kyr. View evidence ↗
- The analysis of only 120 zircon grains per sample is a limitation; increasing this to 300 would better detect minor source contributions. View evidence ↗
Visual summary
1 visualsIllustrations explain the paper; they do not show study data.
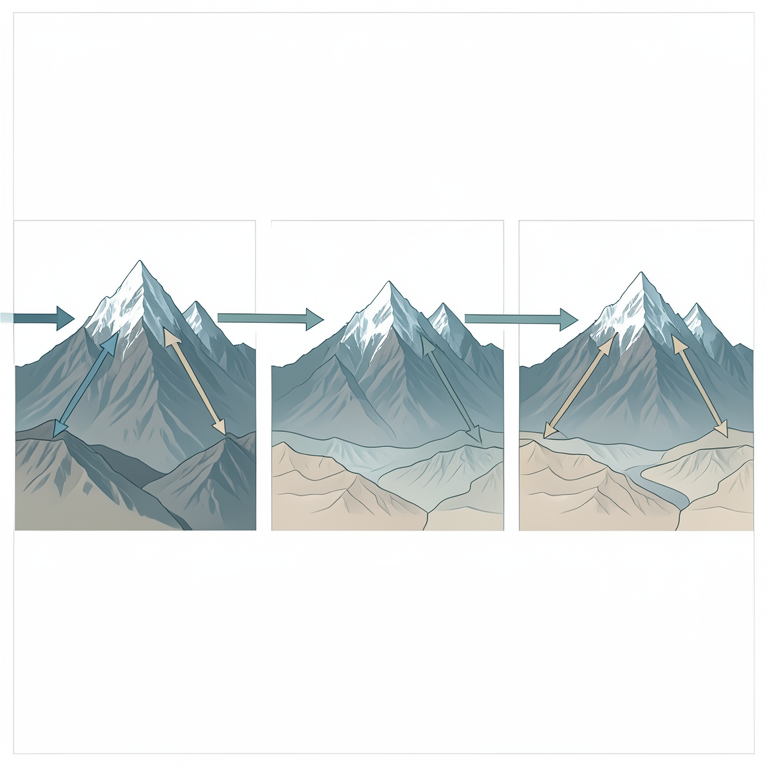
Tectonic Evolution and Sediment Routing
AI-generated conceptual illustration (The Himalayan mountain range and the Siwalik foreland basin). It explains the idea and does not show study data.
View source evidence ↗Figures & tables
From the original paper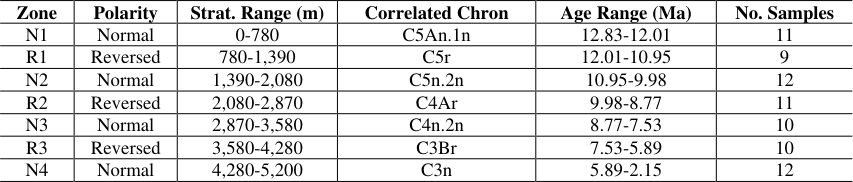 Table 1
 Table 2
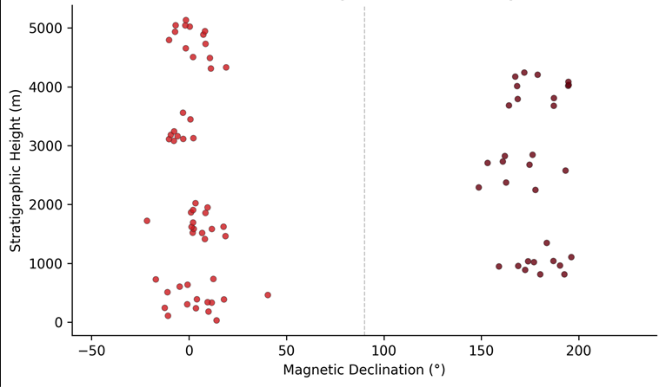 Figure 1
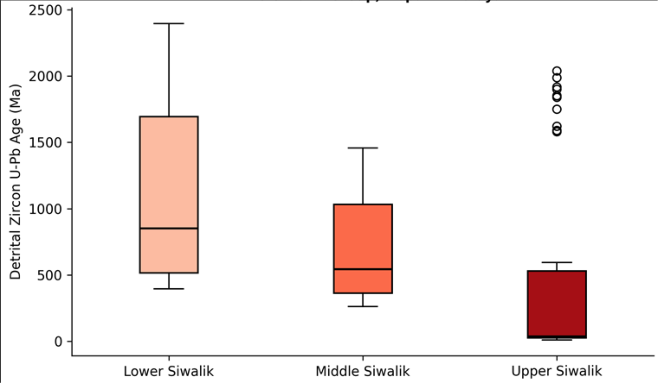 Figure 2
Introduction
The Siwalik Group represents the synorogenic molasse deposited in the Himalayan foreland basin from the middle Miocene through the Pleistocene, and its sedimentary record has been central to reconstructions of Himalayan uplift, erosion, and monsoon evolution [1] . Despite decades of work in Pakistan, India, and Nepal, several stretches of the belt in western Nepal remain poorly dated, leaving gaps in regional correlations [2] . Magnetostratigraphy offers a way to assign numerical ages to these continental sequences because the alternating normal and reversed polarity intervals recorded in fine-grained sediments can be matched to the globally calibrated geomagnetic polarity timescale [3] . Sediment provenance analysis adds a second dimension to the chronological framework. By measuring U-Pb ages of detrital zircon grains in sandstones, it is possible to fingerprint the source terranes that supplied sediment to the basin at different times [4] . In the Himalayan system, the Greater Himalayan Sequence, Lesser Himalayan Sequence, and Tethyan Sedimentary Series each carry distinct zircon age signatures that can be traced into the foreland record [5] . Shifts in these signatures record the progressive southward propagation of major thrust sheets and the unroofing of successively deeper crustal levels. This research targeted a 5,200 m composite section along the Babai River in the Dang District of western Nepal, where continuous exposure and moderate structural tilting make the Siwalik Group accessible for systematic sampling. The objectives were to (a) build a polarity stratigraphy through the full section, (b) correlate it with the GPTS to produce a numerical age model, and (c) use detrital zircon geochronology to document provenance changes and link them to the tectonic history of the hinterland [6] .
Research Area Description
The sampled section lies along the Babai River valley in the Dang District of western Nepal (28.15°N, 82.38°E), within the Sub-Himalayan zone.
The section begins at the Main Boundary Thrust in the north and extends southward to the Himalayan Frontal Thrust. Bedrock consists of fluvial sandstones, siltstones, and mudstones of the Lower, Middle, and Upper Siwalik subgroups, dipping 25-45° to the north. The Babai River cuts through the sequence transversely, providing almost continuous exposure across strike. Elevation ranges from 250 m at the southern end of the section to 780 m at the northern contact. Vegetation is dominated by Sal (Shorea robusta) forest with patches of grassland on river terraces.
Climatic and Environmental Conditions
Western Nepal experiences a subtropical monsoon climate with over 80% of annual precipitation falling between June and September. Mean annual temperature in the Dang District is 24.3°C, with dry-season highs exceeding 40°C. Total annual rainfall at the nearest meteorological station (Tulsipur) averaged 1,580 mm during 2019-2023. Fieldwork was timed for the pre-monsoon window (March-May) to take advantage of low river levels that expose fresh outcrop faces. Relative humidity during sampling ranged from 38% to 72%.
Material and Methods
Material and Methods
Material
This research was conducted from the Department of Climate Science at the Halifax College of Environmental Studies, Nova Scotia, Canada, with fieldwork carried out in western Nepal between March and May of 2021 and 2022. Eighty-five oriented drill cores (2.5 cm diameter) were collected at roughly 60 m stratigraphic intervals from finegrained siltstone and mudstone beds, which are the most reliable carriers of detrital remanent magnetisation.
Orientation was measured with a magnetic compass corrected for the local declination of 0.8° W. Eighteen medium-grained sandstone samples were collected at intervals of 250-350 m for detrital zircon analysis. Zircon separation was performed at the Geochronology Laboratory of Birkbeck College, London, using standard crushing, heavy-liquid, and magnetic separation techniques. U-Pb analyses were carried out by laser-ablation inductively coupled plasma mass spectrometry (LA-ICP-MS) on a Nu Plasma HR instrument coupled to a New Wave UP213 laser [7] .
Methods
Palaeomagnetic measurements were performed using a 2G Enterprises cryogenic magnetometer in a magnetically shielded room at the Halifax College of Environmental Studies. Stepwise thermal demagnetisation was applied in 15-20 temperature steps from 100°C to 680°C. Principal component analysis was used to determine characteristic remanent magnetisation (ChRM) directions from linear segments of Zijderveld diagrams, retaining only components with maximum angular deviation (MAD) values ≤ 15° [8] . Virtual geomagnetic pole (VGP) latitudes were calculated and used to define polarity zones, which were then correlated with the GPTS 2020 [3] . For detrital zircon analysis, at least 120 grains per sample were measured to ensure adequate representation of source populations at the 95% confidence level. Age data were filtered by concordance (90-110%) and visualised as kernel density estimates [9] . that define the seven polarity zones listed in Table 1. Scatter within zones reflects minor secondary overprints and orientation measurement uncertainty.
| Zone | Polarity | Strat. Range (m) | Correlated Chron | Age Range (Ma) | No. Samples |
|---|---|---|---|---|---|
| N1 | Normal | 0-780 | C5An.1n | 12.83-12.01 | 11 |
| R1 | Reversed | 780-1,390 | C5r | 12.01-10.95 | 9 |
| N2 | Normal | 1,390-2,080 | C5n.2n | 10.95-9.98 | 12 |
| R2 | Reversed | 2,080-2,870 | C4Ar | 9.98-8.77 | 11 |
| N3 | Normal | 2,870-3,580 | C4n.2n | 8.77-7.53 | 10 |
| R3 | Reversed | 3,580-4,280 | C3Br | 7.53-5.89 | 10 |
| N4 | Normal | 4,280-5,200 | C3n | 5.89-2.15 | 12 |
Table text extracted from the original PDF; superscript letters are shown inline. The original table image is below.
View original table image
Results
Results
Comprehensive Interpretation
The combined magnetostratigraphic and provenance data record a clear temporal evolution: from about 13 Ma to 10 Ma, sediment arrived mainly from the Greater Himalayan Sequence as the Main Central Thrust was active; between 10 Ma and 6 Ma, Lesser Himalayan material became increasingly prominent as the Main Boundary Thrust propagated southward; and after 6 Ma, young volcanic-arc grains appeared alongside recycled crystalline material, suggesting input from the Gangdese arc in southern Tibet and/or rapid unroofing of Tertiary leucogranites. This threephase pattern matches models of southward-migrating thrust activity across the Himalaya [10] .
Discussion
The polarity sequence obtained from the Babai River section compares well with existing magnetostratigraphies from the Siwalik belt in India and Pakistan [11] . The overall sedimentation rate increase from 0.38 m/kyr (Lower Siwalik) to 0.72 m/kyr (Upper Siwalik) is consistent with accelerated erosion driven by Pliocene intensification of the South Asian monsoon and continued crustal shortening [12] . The provenance shift between the Lower and Middle Siwalik supports models in which the Main Boundary Thrust activated between approximately 10 and 8 Ma, bringing Lesser Himalayan rocks into the erosion catchment. The appearance of ~25 Ma zircons in the Upper Siwalik is somewhat unexpected, as such young ages are rare in nearby Himalayan source units. One explanation is long-distance aeolian or fluvial transport from the Lhasa terrane, where Oligocene volcanics are well documented [13] . A limitation of this research is the relatively coarse sampling interval (~60 m) for palaeomagnetic cores, which may cause short-duration polarity events (< 50 kyr) to be missed. Higher-resolution sampling, especially in the Middle Siwalik, would allow detection of subchrons and sharpen the age model. Also, only 120 zircon grains per sample were analysed; expanding this count to 300 would improve the detection of minor source contributions [14] .
Conclusion
This research established a magnetostratigraphic framework spanning approximately 12.83 Ma to 2.15 Ma for a 5,200 m section of the Siwalik Group along the Babai River in western Nepal. Seven normal and six reversed polarity zones were identified and correlated with the geomagnetic polarity timescale. Detrital zircon U-Pb geochronology revealed a clear provenance evolution from Greater Himalayan sources in the Lower Siwalik, through mixed Lesser Himalayan and Tethyan contributions in the Middle Siwalik, to young volcanic-arc input in the Upper Siwalik. These shifts track the southward migration of the thrust front through the late Miocene and Pliocene. The integrated dataset provides a needed chronological anchor for the western Nepal segment of the Siwalik belt and supports models of progressive foreland basin filling driven by tectonic and climatic forcing.
Figures and tables from the paper
| Formation | Peak 1 (Ma) | Peak 2 (Ma) | Peak 3 (Ma) | Inferred Source |
|---|---|---|---|---|
| Lower Siwalik | ~480 | ~1,850 | ~900 | Greater Himalayan Sequence |
| Middle Siwalik | ~350 | ~1,100 | ~550 | Lesser Himalayan + Tethyan |
| Upper Siwalik | ~25 | ~480 | ~1,700 | Volcanic arc + recycled GHS |
Table text extracted from the original PDF; superscript letters are shown inline. The original table image is below.
View original table image
References
14 in the original paper- Quade J, Cerling TE, Bowman JR. Development of Asian monsoon revealed by marked ecological shift during the latest Miocene in northern Pakistan. Nature. 1989;342(6246):163-166.
- Gautam P, Rösler W. Depositional chronology and fabric of Siwalik Group sediments in central Nepal from magnetostratigraphy and magnetic anisotropy. Journal of Asian Earth Sciences. 1999;17(5-6):659-682.
- Ogg JG. Geomagnetic Polarity Time Scale. The Geologic Time Scale. 2020;Elsevier:159-192.
- DeCelles PG, Gehrels GE, Quade J, LaReau B, Spurlin M. Tectonic implications of U-Pb zircon ages of the Himalayan orogenic belt in Nepal. Science. 2000;288(5465):497-499.
- Gehrels GE, DeCelles PG, Martin A, Ojha TP, Pinhassi G, Upreti BN. Initiation of the Himalayan orogen as an early Paleozoic thin-skinned thrust belt. GSA Today. 2003;13(9):4-9.
- Ojha TP, Butler RF, DeCelles PG, Quade J. Magnetic polarity stratigraphy of the Neogene foreland basin deposits of Nepal. Basin Research. 2009;21(1):61-90.
- Gehrels GE. Detrital zircon U-Pb geochronology applied to tectonics. Annual Review of Earth and Planetary Sciences. 2014;42:127-149.
- Kirschvink JL. The least-squares line and plane and the analysis of palaeomagnetic data. Geophysical Journal International. 1980;62(3):699-718.
- Vermeesch P. Maximum depositional age estimation revisited. Geoscience Frontiers. 2021;12(2):843-850.
- DeCelles PG, Robinson DM, Quade J, Ojha TP, Garzione CN, Copeland P, Upreti BN. Stratigraphy, structure, and tectonic evolution of the Himalayan foldthrust belt in western Nepal. Tectonics. 2001;20(4):487509.
- Tauxe L, Kent DV. A simplified statistical model for the geomagnetic field and the detection of shallow bias in paleomagnetic inclinations: was the ancient magnetic field dipolar? Timescales of the Paleomagnetic Field. 2004;145:101-115.
- Brozovic N, Burbank DW. Dynamic fluvial systems and gravel progradation in the Himalayan foreland. GSA Bulletin. 2000;112(3):394-412.
- Yin A, Harrison TM. Geologic evolution of the Himalayan-Tibetan orogen. Annual Review of Earth and Planetary Sciences. 2000;28(1):211-280.
- Pullen A, Kapp P, Gehrels GE, DeCelles PG, Brown EH, Fabijanic JM, Ding L. Gangdese retroarc thrust belt and foreland basin deposits in the Damxung area, southern Tibet. Journal of Asian Earth Sciences. 2008;33(5-6):323-336.