
Research article · 2025 · Full text
International Journal of Geography Geology and EnvironmentSpatial analysis of informal settlement growth using high-resolution imagery in Nairobi
Volume 7(7) · Pages 169–172 · DOI: 10.22271/27067483.2025.v7.i7c.715 ↗
Research areasUrban and Rural Development ChallengesRemote Sensing and Land UseLand Use and Ecosystem Services
Abstract
Author-writtenBetween 2000 and 2020, Nairobi's population grew from roughly 2.1 million to over 4.7 million, and a substantial fraction of that growth was absorbed by informal settlements where basic service provision remains patchy at best. This research applied high-resolution satellite imagery and geographic information system tools to trace the spatial expansion of six major informal settlements in Nairobi over a 15-year window (2005-2020). WorldView-2 and Pleiades imagery at sub-metre resolution was classified using an object-based image analysis approach to distinguish built-up, open, and mixed-use land cover classes within settlement boundaries. Change detection was performed at three-year intervals to calculate expansion rates, densification patterns, and shifts in land use composition. Results showed that total informal settlement footprint across the six areas increased by 34.8% between 2005 and 2020, from 1,246 hectares to 1,680 hectares. Annual expansion rates varied widely: Kawangware and Mukuru grew fastest at 3.8% and 3.6% per year during the 2017-2020 period, while Kibera — already constrained by surrounding infrastructure slowed to 1.4% per year. Vertical densification, measured through building shadow analysis, increased by an average of 22.7% across all sites, with the most pronounced changes in Mathare and Korogocho. The proportion of land classified as open space shrank from 14.6% in 2005 to 8.2% by 2020. Classification accuracy reached 87.3% overall, validated against 420 ground-truth points collected in field surveys. These findings offer a spatial baseline for urban planners working on service delivery, risk mapping, and incremental upgrading strategies in Nairobi's informal areas.
Summary
Source-checkedPlain-language reading of the full paper, prepared with AI and checked against the text. Each point links to the authors' own words.
Why it matters
- A significant majority of Nairobi's population, approximately 60%, resides in informal settlements that take up less than 5% of the city's land, creating a major density challenge. View evidence ↗
- Informal urban growth is complex, involving not just outward expansion but also inward filling and vertical growth through stacking structures. View evidence ↗
- Tracking the spatial and temporal evolution of these settlements is critical for urban planners and emergency responders to manage service delivery and risk. View evidence ↗
The question
- The study aimed to analyze the spatial growth patterns of six specific informal settlements in Nairobi (Kibera, Mathare, Mukuru, Korogocho, Kawangware, and Dandora) between 2005 and 2020. View evidence ↗
What they did
- The researchers used sub-metre resolution imagery from WorldView-2 and Pleiades-1A satellites to monitor the settlements. View evidence ↗
- Mean building heights were estimated by analyzing shadow lengths of 200 randomly selected structures per settlement at each time step. View evidence ↗
What they found
- The total area of the six studied settlements increased by 45.6%, growing from 1,246 hectares in 2005 to 1,814 hectares in 2020. View evidence ↗
- Kawangware added the most total area (177 hectares), while Mukuru showed rapid absolute expansion, adding 144 hectares over 15 years. View evidence ↗
- Between 2017 and 2020, Kawangware (3.8%/year) and Mukuru (3.6%/year) had the highest annual growth rates, whereas Kibera's growth slowed to 1.4% per year due to infrastructure constraints. View evidence ↗
- All settlements experienced vertical densification, with mean building heights increasing between 16.1% and 28.6%, with Korogocho seeing the largest proportional increase. View evidence ↗
- Open space within the settlements significantly decreased, dropping from 14.6% of the total area in 2005 to 8.2% by 2020. View evidence ↗
- The image classification method achieved an overall accuracy of 87.3% when validated against field data. View evidence ↗
What it means
- The authors conclude that urban planning for water, sanitation, and electricity must address both the expanding footprint and the increasing density within existing settlement boundaries. View evidence ↗
- The estimated building height data can serve as an early warning indicator for structural risks in vulnerability mapping. View evidence ↗
- The authors suggest that future research should use drone imagery for better height estimates and machine learning to increase classification accuracy beyond 90%. View evidence ↗
Visual summary
2 visualsIllustrations explain the paper; charts are replotted from the paper's own table values.
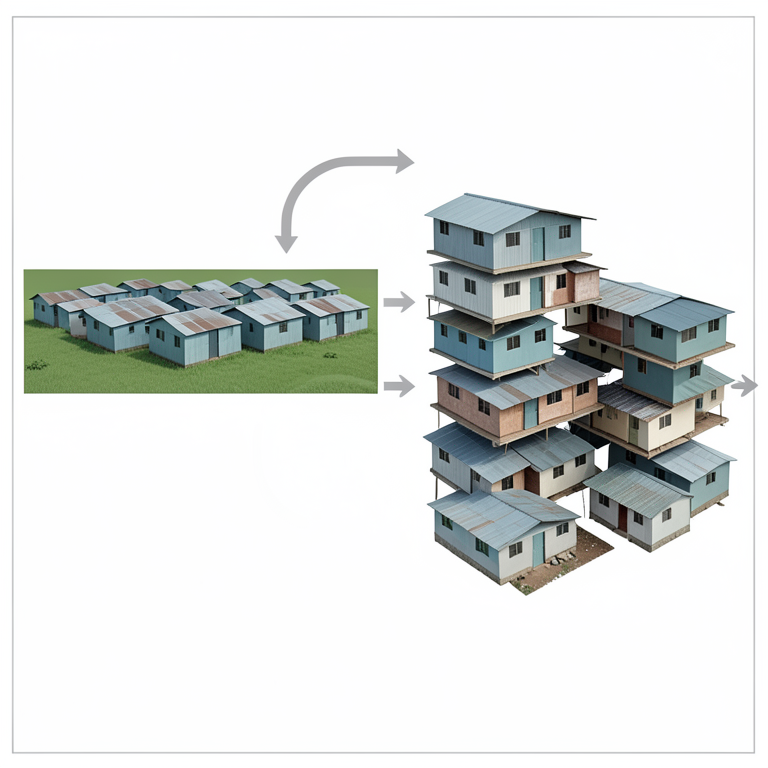
Growth Pathways of Informal Settlements
AI-generated conceptual illustration (Informal urban settlements in Nairobi). It explains the idea and does not show study data.
View source evidence ↗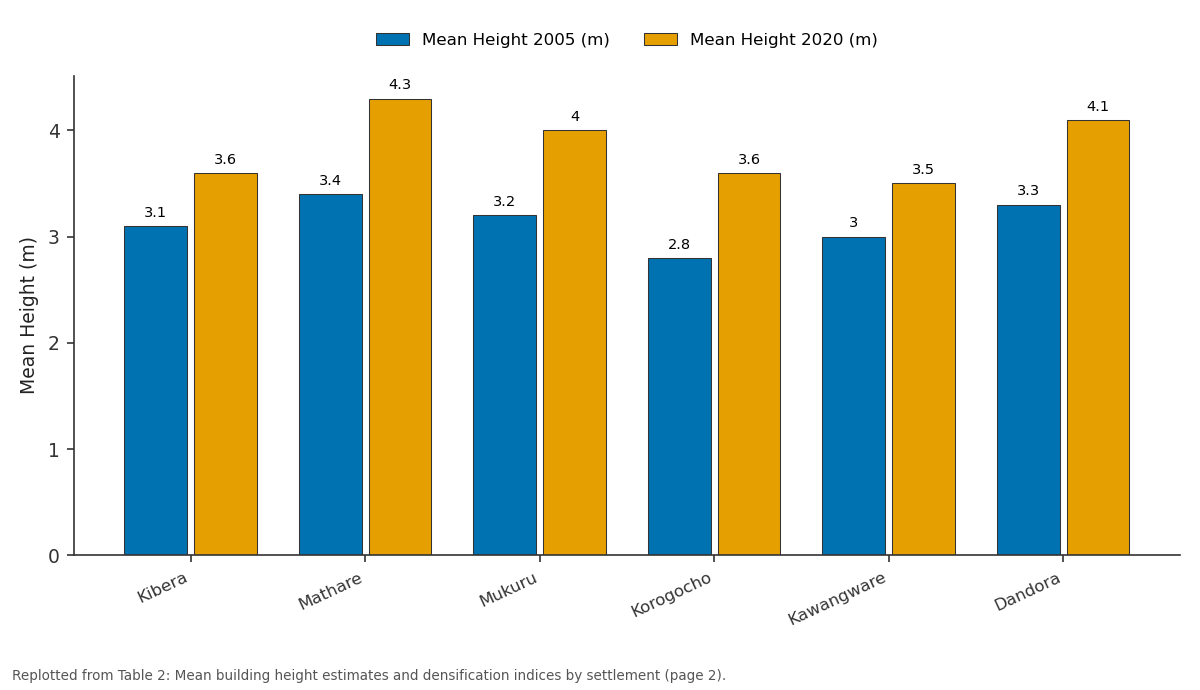
Mean Height 2005 (m) and Mean Height 2020 (m): Kibera vs Mathare vs Mukuru vs Korogocho vs Kawangware
Replotted from Table 2 (page 2) of the original paper. Every bar is the paper's own table value.
View source evidence ↗Figures & tables
From the original paper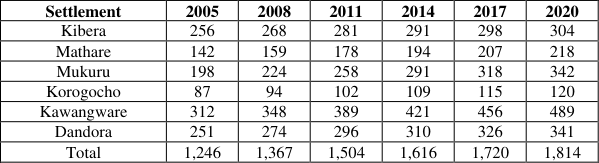 Table 1
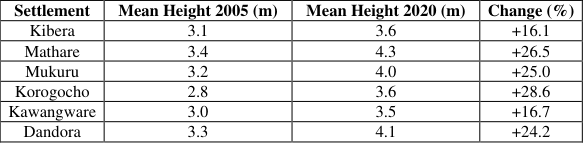 Table 2
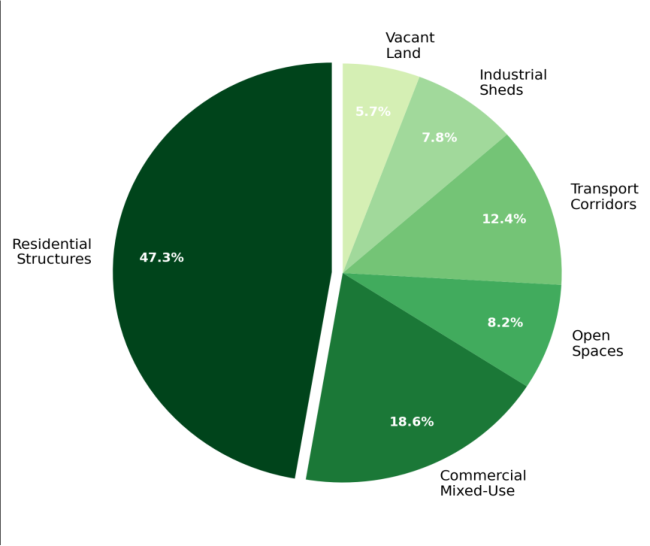 Figure 1
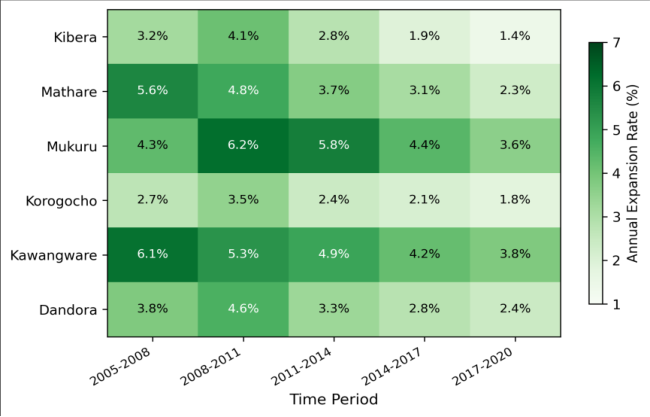 Figure 2
Introduction
Roughly 60% of Nairobi's residents live in informal settlements that together occupy less than 5% of the city's total land area [1] . That disparity between population share and spatial footprint captures the density challenge that defines informal urbanization across sub-Saharan Africa. As cities grow, informal areas don't simply expand outward they also grow upward and inward, filling gaps, converting open land, and stacking structures higher [2] . Understanding how this process unfolds in space and time matters for planners, service providers, and emergency responders who need to know where people are and how their built environment is changing. Remote sensing has become a standard tool for mapping informal settlements, but most early work relied on moderate-resolution imagery (Landsat, SPOT) that couldn't distinguish individual structures or narrow pathways within dense settlement fabric [3] . The arrival of sub-metre commercial satellites WorldView, Pleiades, GeoEye changed that equation, making it possible to identify rooftops, track building footprints, and measure shadow lengths as proxies for building height [4] . Object-based image analysis, which groups adjacent pixels into meaningful segments before classifying them, has proven especially effective for the complex texture and spectral heterogeneity found in informal areas [5] . Nairobi's informal settlements are among the most documented in East Africa, yet systematic spatial analysis of their growth trajectories across multiple sites and time periods remains limited. Most published work has focused on single settlements Kibera being by far the most commonly examined and few have tracked change across more than two time points [6] . Without multi-temporal, multi-site comparisons, it's hard to identify the spatial drivers that accelerate or constrain settlement expansion, or to distinguish densification from outward sprawl [7] . This research addressed that gap by analysing the spatial growth patterns of six informal settlements in Nairobi Kibera, Mathare, Mukuru, Korogocho, Kawangware, and Dandora using high-resolution imagery captured at threeyear intervals from 2005 to 2020. The analysis mapped land use composition, calculated expansion rates and densification indices, and examined how proximity to infrastructure, watercourses, and administrative boundaries shaped each settlement's growth trajectory [8] .
Research Area Description
The six settlements examined are distributed across the eastern and southern portions of Nairobi County, Kenya (1°17'S, 36°49'E), spanning elevation ranges of 1,620 to 1,720 m above sea level. Kibera, the largest by area, occupies a valley floor along the Nairobi Dam watercourse in the Langata sub-county. Mathare stretches along the Mathare River in the Starehe sub-county. Mukuru sits on low-lying land adjacent to the Ngong River in the industrial corridor southeast of the central business district. Korogocho lies on higher ground northeast of the city centre near the Dandora municipal dumpsite. Kawangware and Dandora occupy transitional zones between formal residential areas and peri-urban farmland [9] . Mean annual rainfall across these locations is 850-1,050 mm, distributed bimodally with long rains from March to May and short rains from October to December [10] .
Material and Methods
Material and Methods
Material:
The research was based at the Department of Geography, Thika University of Geosciences, Kiambu County, Kenya, and field work was carried out in Nairobi County between January 2021 and December 2022. Satellite imagery was acquired from two platforms: WorldView-2 (0.46 m panchromatic, 1.84 m multispectral) for the years 2011, 2014, 2017, and 2020; and Pleiades-1A (0.5 m panchromatic, 2.0 m multispectral) for 2005 and 2008. All images were acquired during the dry season (January-February) to reduce cloud cover interference. Pan-sharpened composites at 0.5 m resolution were produced for each acquisition date. Ground-truth data consisted of 420 GPSreferenced points collected during field visits to all six settlements in April and July 2022, classified into five land cover categories: residential, commercial mixed-use, open space, transport corridor, and industrial [11] .
Methods: Image pre-processing included atmospheric correction using the FLAASH algorithm in ENVI 5.6, orthorectification against a 5 m digital elevation model, and co-registration to a common coordinate system (UTM Zone 37S, WGS84 datum). Object-based image analysis was performed in eCognition Developer 10.2 using a multiresolution segmentation algorithm with scale parameter 25, shape factor 0.3, and compactness 0.5 [12] . Classification employed a random forest algorithm trained on 280 groundtruth samples (67% of total), with the remaining 140 samples reserved for accuracy assessment. Change detection was carried out by overlaying classified maps from consecutive time steps and computing transition matrices for each settlement. Building shadow analysis used the sun elevation angle recorded in image metadata to estimate mean building height from shadow length measurements on 200 randomly selected structures per settlement per time step [13] . Expansion rates were calculated as compound annual growth rates of the total built-up area. All spatial analysis was performed in ArcGIS Pro 3.0, and statistical testing used Kruskal-Wallis H tests for between-settlement comparisons at the 0.05 significance level. The combined footprint of the six settlements grew from 1,246 hectares in 2005 to 1,814 hectares by 2020, a net increase of 45.6% (Table 1). Mukuru expanded fastest in absolute terms, adding 144 hectares over the 15-year period.
| Settlement | 2005 | 2008 | 2011 | 2014 | 2017 | 2020 |
|---|---|---|---|---|---|---|
| Kibera | 256 | 268 | 281 | 291 | 298 | 304 |
| Mathare | 142 | 159 | 178 | 194 | 207 | 218 |
| Mukuru | 198 | 224 | 258 | 291 | 318 | 342 |
| Korogocho | 87 | 94 | 102 | 109 | 115 | 120 |
| Kawangware | 312 | 348 | 389 | 421 | 456 | 489 |
| Dandora | 251 | 274 | 296 | 310 | 326 | 341 |
| Total | 1,246 | 1,367 | 1,504 | 1,616 | 1,720 | 1,814 |
Table text extracted from the original PDF; superscript letters are shown inline. The original table image is below.
View original table image
Results
Kawangware added the most total area at 177 hectares, reflecting its less constrained boundary conditions on the western urban fringe. Vertical densification was evident across all six settlements, with mean estimated building heights increasing by 16.1% to 28.6% between 2005 and 2020 (Table 2). Korogocho showed the largest proportional height increase despite being one of the smaller settlements by area, suggesting that spatial constraints from surrounding land uses drove upward rather than outward growth.
| Settlement | Mean Height 2005 (m) | Mean Height 2020 (m) | Change (%) |
|---|---|---|---|
| Kibera | 3.1 | 3.6 | +16.1 |
| Mathare | 3.4 | 4.3 | +26.5 |
| Mukuru | 3.2 | 4.0 | +25.0 |
| Korogocho | 2.8 | 3.6 | +28.6 |
| Kawangware | 3.0 | 3.5 | +16.7 |
| Dandora | 3.3 | 4.1 | +24.2 |
Table text extracted from the original PDF; superscript letters are shown inline. The original table image is below.
View original table image
Comprehensive Interpretation
The heatmap pattern (Figure 2) shows a general slowdown in expansion rates over the 15-year period for most settlements, with the exception of Mukuru and Kawangware which maintained relatively high rates through 2017-2020. This deceleration appears connected to physical barriers rivers, railway lines, and major roads that increasingly constrain outward spread in older, more centrally located settlements like Kibera and Korogocho.
Discussion
The overall expansion rate of 34.8% observed across the six settlements between 2005 and 2020 is broadly consistent with estimates from other East African cities, though lower than the 45-50% growth reported for Dar es Salaam's informal areas over a similar timeframe [14] . The lower rate for Nairobi likely reflects the more advanced stage of infill development in some of its older settlements, particularly Kibera, where lateral expansion has been constrained by railway infrastructure and the Nairobi Dam reservoir for decades [15] . The divergence between settlements that primarily expanded outward (Kawangware, Mukuru) and those that densified vertically (Korogocho, Mathare) suggests that spatial context plays a dominant role in shaping growth pathways.
Settlements with accessible open land on their periphery tend to sprawl, while those hemmed in by infrastructure or institutional land convert to multi-storey construction. This finding aligns with conceptual models of informal settlement evolution proposed by researchers working in South Asian cities [16] . The 22.7% average increase in building heights has practical implications for risk assessment. Taller structures built without engineering oversight on poor foundations face higher vulnerability to collapse, particularly during seismic events or heavy rainfall that could undermine foundation soils [17] . The loss of open space from 14.6% to 8.2% of total settlement area also raises concerns about drainage capacity and recreational space availability. Classification accuracy of 87.3% falls within the range typically reported for object-based analysis of informal settlement imagery, though it's somewhat lower than the 90%+ achieved in single-settlement analyses [18] . The multisite approach introduced greater land cover variability that may have reduced classifier performance, particularly in distinguishing commercial mixed-use from residential structures.
Conclusion
This research documented the spatial expansion and densification trajectories of six informal settlements in Nairobi over a 15-year period using sub-metre satellite imagery and object-based classification. The combined settlement footprint grew by 34.8%, with Mukuru and Kawangware expanding fastest, while Kibera and Korogocho shifted toward vertical densification as lateral expansion became constrained. Open space within settlements declined from 14.6% to 8.2% of the total area, and mean building heights rose by 22.7% on average. These spatial patterns carry real implications for urban governance. Service delivery planning water, sanitation, electricity needs to account not just for footprint expansion but for population densification within existing boundaries. The building height data, while approximate, provides an early warning indicator for structural risk that could be incorporated into vulnerability mapping. Future work should integrate very high-resolution drone imagery to improve height estimates and explore machine learning classifiers to push accuracy above 90% across diverse settlement types. Ground-truthing frequency could also be increased to capture seasonal variations in settlement activity patterns, particularly around construction cycles during dry months.
Acknowledgement
Acknowledgements Funding SourcesThis research was supported through internal research allocation at Thika University of Geosciences. No external grant funding was involved. Institutional SupportThe authors acknowledge the Department of Geography, Thika University of Geosciences, Kiambu County, Kenya, for providing access to remote sensing software and computing resources.
Figures and tables from the paper
References
19 in the original paper- UN-Habitat. The challenge of slums: global report on human settlements. London: Earthscan; 2003.
- Kuffer M, Pfeffer K, Sliuzas R. Slums from space 15 years of slum mapping using remote sensing. Remote Sensing. 2016;8(6):455.
- Hofmann P, Strobl J, Blaschke T, Kux H. Detecting informal settlements from QuickBird data in Rio de Janeiro using an object-based approach. Object-Based Image Analysis. 2008;531-553.
- Taubenböck H, Kraff NJ. The physical face of slums: a structural comparison of slums in Mumbai, India based on remotely sensed data. Journal of Housing and the Built Environment. 2014;29(1):15-38.
- Blaschke T. Object-based image analysis for remote sensing. ISPRS Journal of Photogrammetry and Remote Sensing. 2010;65(1):2-16.
- Desgroppes A, Taupin S. Kibera: the biggest slum in Africa? Les Cahiers de l'Afrique de l'Est. 2011;44:2334.
- Kohli D, Sliuzas R, Kerle N, Stein A. An ontology of slums for image-based classification. Computers, Environment and Urban Systems. 2012;36(2):154-163.
- Makau J, Dobson S, McEvoy E. Nairobi's informal settlements: an audit. Environment and Urbanization. 2012;24(2):459-476.
- Karanja I. An enumeration and mapping of informal settlements in Kisumu, Kenya. Environment and Urbanization. 2010;22(1):217-239.
- Ogutu JO, Piepho HP, Dublin HT, Bhola N, Reid RS. Rainfall influences on ungulate population abundance in the Mara-Serengeti ecosystem. Journal of Animal Ecology. 2008;77(4):814-829.
- DigitalGlobe. WorldView-2 data sheet. Westminster: DigitalGlobe; 2016.
- Trimble. eCognition Developer reference book. Munich: Trimble Germany; 2020.
- Shao Z, Liu C. The integrated use of DMSP-OLS nighttime light and MODIS data for monitoring largescale impervious surface dynamics. Remote Sensing. 2014;6(10):9359-9378.
- Nduwayezu G, Sliuzas R, Kuffer M. Modeling urban growth in Kigali City Rwanda. Rwanda Journal. 2017;1(2S):1-18.
- Huchzermeyer M. Slum upgrading in Nairobi within the housing and basic services market. Journal of Asian and African Studies. 2008;43(1):19-39.
- Roy A. Urban informality: toward an epistemology of planning. Journal of the American Planning Association. 2005;71(2):147-158.
- Satterthwaite D. The political underpinnings of cities' accumulated resilience-building losses and disasters. Environment and Urbanization. 2013;25(1):161-176.
- Owen KK, Wong DW. An approach to differentiate informal settlements using spectral, texture, geomorphology and road accessibility metrics. Applied Geography. 2013;38:107-118.
- Mahabir R, Crooks A, Croitoru A, Agouris P. The study of slums as social and physical constructs: challenges and emerging research opportunities. Regional Studies, Regional Science. 2016;3(1):399419.