
Research article · 2025 · Full text
International Journal of Geography Geology and EnvironmentMineralogy and formation conditions of evaporite deposits in the Dead Sea closed basin
Volume 7(6) · Pages 86–89 · DOI: 10.22271/27067483.2025.v7.i6b.689 ↗
Research areasGeochemistry and Elemental AnalysisGeological formations and processesMarine and environmental studies
Abstract
Author-writtenThe Dead Sea is shrinking at roughly one metre per year, exposing fresh evaporite crusts along its retreating shoreline that record the basin's extreme hydrochemistry. This research characterised the mineralogy and formation conditions of evaporite deposits from a 25 m sediment core drilled at the southern margin of the Dead Sea. X-ray diffraction (XRD), scanning electron microscopy (SEM), and fluid inclusion microthermometry were applied to 45 samples distributed across five stratigraphic sections. Halite dominated the upper 10 m (averaging 72.4 wt%), while gypsum and anhydrite increased progressively below 15 m, reaching a combined 65.3 wt% near the core base. Minor phases included aragonite, carnallite, and sylvite. Fluid inclusion homogenisation temperatures ranged from 28.7 °C to 52.3 °C, indicating crystallisation from warm, highly concentrated brines. The vertical mineral succession is consistent with a drying-upward sequence driven by Late Holocene aridification and declining freshwater inflow.
Summary
Source-checkedPlain-language reading of the full paper, prepared with AI and checked against the text. Each point links to the authors' own words.
Why it matters
- Closed basins concentrate dissolved ions over time, creating evaporite rock sequences that serve as records of the water body's historical temperature, chemistry, and evaporation. View evidence ↗
- The Dead Sea is a key modern analogue for ancient evaporite basins, though its subsurface sediment record is not yet fully characterized. View evidence ↗
- The Dead Sea's high salinity (approximately 347 g/L) and enrichment in Mg, Ca, and Br lead to a unique mineral assemblage including carnallite and aragonite alongside halite and gypsum. View evidence ↗
The question
- The study aimed to document the mineral succession of a 25 m core from the southern margin of the Dead Sea and determine the salinity and temperature conditions of its crystallization. View evidence ↗
What they did
- A 25 m core was drilled in March 2022 at the southern margin of the Dead Sea, achieving a total recovery of 23.7 m (94.8%). View evidence ↗
- Researchers analyzed 45 samples across five stratigraphic sections using X-ray diffraction (XRD), scanning electron microscopy (SEM), and fluid inclusion microthermometry. View evidence ↗
- Fluid inclusion analysis was performed on 126 inclusions sourced from 18 halite samples. View evidence ↗
- Mineral abundances were quantitatively estimated using Rietveld refinement of XRD patterns via TOPAS v5. View evidence ↗
What they found
- Halite was the dominant mineral in the upper 10 m (averaging 72.4 wt%), whereas gypsum and anhydrite increased below 15 m, totaling 65.3 wt% near the base. View evidence ↗
- Carnallite reached 12.4 wt% at the core base but only appeared in trace amounts in upper sections, suggesting brines were less concentrated during early deposition. View evidence ↗
- Fluid inclusion data showed an upward increase in temperatures from 30.2 °C to 48.7 °C and an increase in salinities from 20.1 to 23.1 wt% NaCl equivalent. View evidence ↗
- Homogenisation temperatures between 28.7 °C and 52.3 °C indicate that the minerals crystallized from warm, highly concentrated brines. View evidence ↗
- The core exhibits a classic drying-upward succession, characterized by an increase in halite and a decrease in gypsum, anhydrite, and aragonite toward the top. View evidence ↗
What it means
- The authors conclude that the vertical mineral succession was driven by declining freshwater inflow and aridification during the Late Holocene. View evidence ↗
- The increase in brine temperatures (30-49 °C) and salinities (20-23 wt% NaCl eq.) upcore is consistent with the progressive concentration of the basin and decline in lake levels. View evidence ↗
Visual summary
3 visualsIllustrations explain the paper; charts are replotted from the paper's own table values.
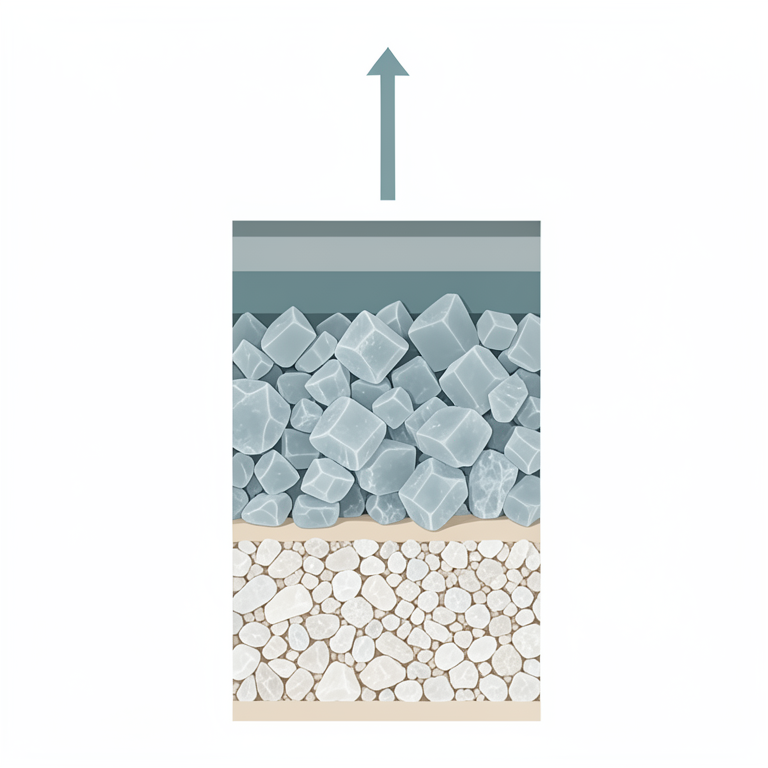
Drying-Upward Succession Model
AI-generated conceptual illustration (evaporite sediment column in the Dead Sea basin). It explains the idea and does not show study data.
View source evidence ↗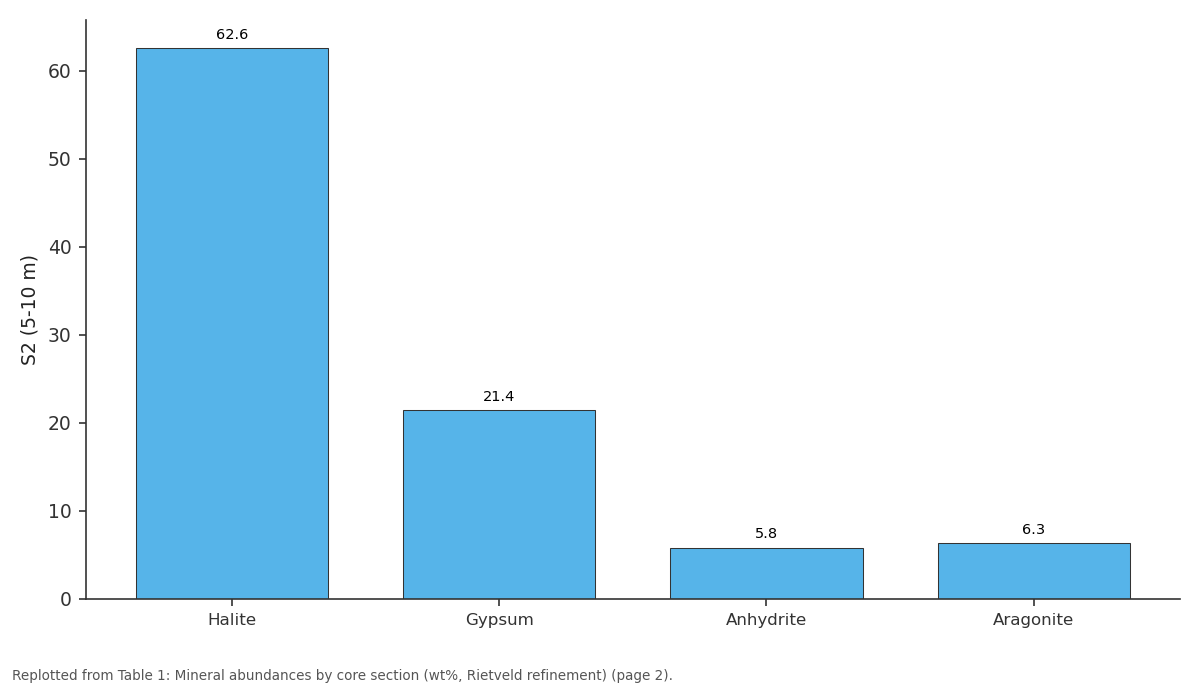
S2 (5-10 m): Halite vs Gypsum vs Anhydrite vs Aragonite
Replotted from Table 1 (page 2) of the original paper. Every bar is the paper's own table value.
View source evidence ↗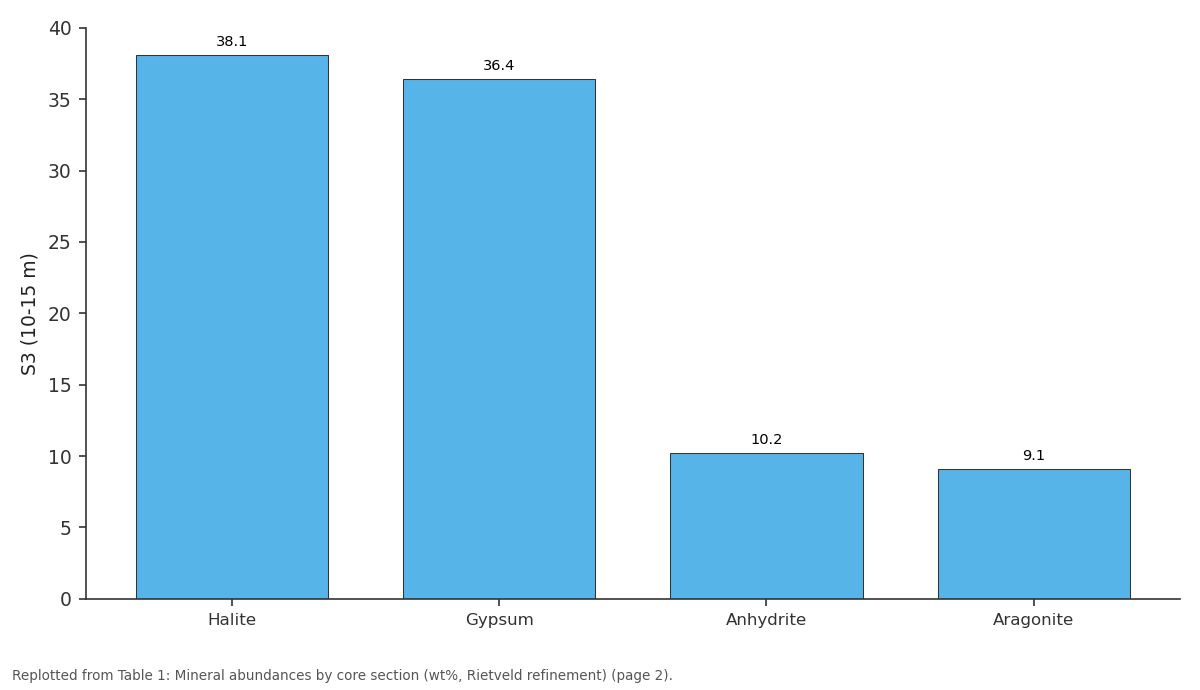
S3 (10-15 m): Halite vs Gypsum vs Anhydrite vs Aragonite
Replotted from Table 1 (page 2) of the original paper. Every bar is the paper's own table value.
View source evidence ↗Figures & tables
From the original paper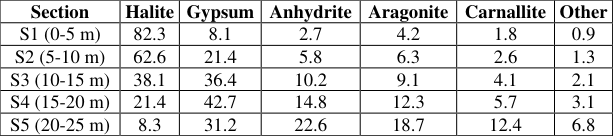 Table 1
 Table 2
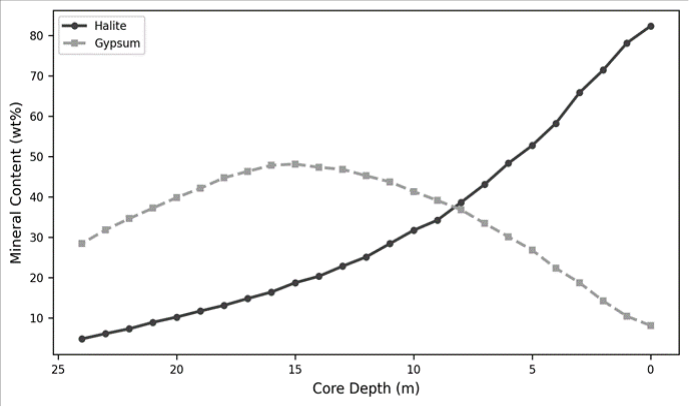 Figure 1
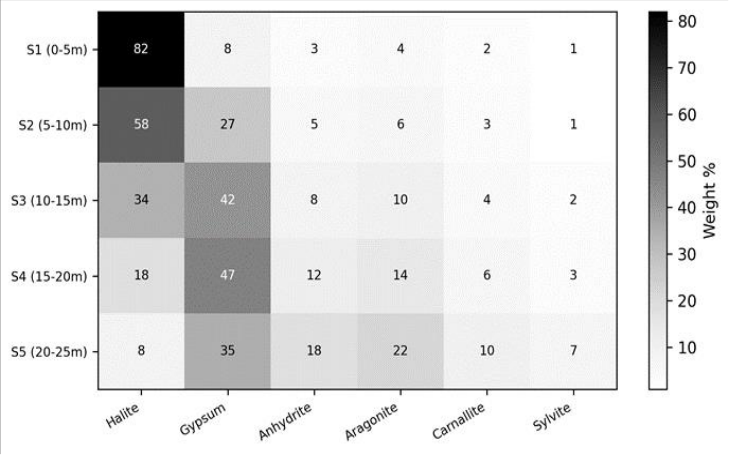 Figure 2
Introduction
A body of water with no outlet concentrates every dissolved ion its tributaries deliver. Over millennia, that concentration process builds thick sequences of chemical sedimentary rocks evaporiteswhose mineral assemblages preserve a record of the water body's chemistry, temperature, and evaporation history [1] . The Dead Sea, the lowest point on Earth's land surface at about-430 m, is perhaps the most studied modern analogue for ancient evaporite basins, yet much of its subsurface sediment record remains incompletely characterised [2] . The lake's salinity (currently around 347 g/L) far exceeds ocean water, and its unusual chemistryenriched in Mg, Ca, and Br relative to Na and Kproduces an uncommon mineral assemblage where carnallite and aragonite accompany the more typical halite and gypsum [3] . Previous drilling campaigns focused on the deep northern basin, where the ICDP Dead Sea Deep Drilling Project recovered a 450 m core in 2010 [4] . The shallow southern margin, which has been exposed by lake-level decline since the 1960s, has received less attention despite its accessibility. This research analysed a 25 m core from that margin to document the mineral succession and constrain the temperature and salinity conditions under which each phase crystallised [5] .
Instrumentation and Analytical Equipment
XRD analyses used a Bruker D8 Advance diffractometer (Cu Kα radiation, 40 kV, 40 mA, 2θ range 5°-70°, step size 0.02°) at Pietermaritzburg University. Mineral identification followed the ICDD PDF-4 database. SEM imaging and energy-dispersive X-ray spectroscopy (EDS) were carried out on a JEOL JSM-7600F field-emission instrument. Fluid inclusion microthermometry used a Linkam THMS 600 heating-freezing stage, calibrated against synthetic H₂O and NaCl-H₂O standards. Accuracy was±0.2 °C for melting and±1.0 °C for homogenisation temperatures [6] .
Materials and Methods
Materials and Methods
Materials
The core was drilled in March 2022 at the southern margin of the Dead Sea (31°05′N, 35°23′E) using a truck-mounted rotary rig. Total recovery was 23.7 m from 25 m drilled (94.8%). The core was split lengthwise; one half was archived and the other sub-sampled at 45 intervals for analysis. Samples were selected to capture all visible lithological changes. Thin sections were prepared for petrographic description and fluid inclusion identification. Powdered aliquots were prepared by hand-grinding in an agate mortar to avoid phase changes in hygroscopic minerals. Research coordination was based at the Pietermaritzburg University of Geosciences, KwaZulu-Natal, South Africa [7] .
Methods
Quantitative mineral abundances were estimated by Rietveld refinement of XRD patterns using TOPAS v5. SEM-EDS confirmed phase identifications and documented crystal morphologies. Fluid inclusions in halite crystals were measured following the protocol of Goldstein and Reynolds [8] : inclusions were first cooled to -40 °C, then heated at 1 °C/min to record ice-melting (Tm) and homogenisation (Th) temperatures. Only primary inclusions aligned along growth bands were measured; secondary and necked-down inclusions were excluded. A total of 126 inclusions from 18 halite samples were analysed [9] .
Quality Control and Calibration
Rietveld refinement goodness-of-fit (Rwp) values ranged from 4.3% to 8.1%, indicating acceptable fits. Replicate XRD analyses of three samples yielded mineral abundance reproducibility within±2.4 wt%. SEM-EDS spot analyses on reference standards (NaCl, CaSO₄) recovered compositions within 1.5% of stoichiometric values. Fluid inclusion stage calibration was checked before each session using a certified melting-point standard (0.0 °C for pure H₂O). The most striking pattern is the upward increase in halite at the expense of gypsum, anhydrite, and aragonitea classic drying-upward evaporite succession. Carnallite, a highly soluble KMgCl₃•6H₂O phase, appears only in trace amounts in the upper sections but reaches 12.4 wt% at the base, indicating less concentrated brines during early deposition.
Results
Results
Comprehensive Interpretation
Fluid inclusion temperatures increase upward from 30.2 °C to 48.7 °C, and salinities rise from 20.1 to 23.1 wt% NaCl equivalent. This trend records progressive warming and concentration of the brine as the lake shrank and the shallow southern basin became increasingly exposed to solar heating. The high Th values in Section S1 approach the modern Dead Sea surface temperature of 34-36 °C measured in summer, suggesting that the youngest halite crystallised at or near the surface.
Discussion
The drying-upward mineral successionfrom gypsumdominated at the base to halite-dominated at the topmirrors the theoretical sequence predicted by brine evolution models for Mg-Ca-enriched basins [10] . Gypsum precipitates when brine reaches roughly 3.5× seawater concentration, while halite requires 10-11× concentration [1] . The presence of carnallite only at depth is consistent with an earlier, more dilute phase when Mg was less concentrated relative to K. The fluid inclusion data support a warming trend over the period of deposition. Assuming the lower sections correspond to the early to mid-Holocene (roughly 5000-3000 cal BP), when the Dead Sea stood 10-15 m higher than today [4] , the 30 °C inclusion temperatures are plausible for a deeper, less thermally extreme lake. The upper-section values of 48-52 °C indicate very shallow brine conditions, consistent with the modern exposed salt pan environment at the southern margin [11] .
Conclusion
A 25 m evaporite core from the Dead Sea's southern margin preserves a drying-upward succession from gypsumaragonite at the base to halite-dominated sediment at the top. Fluid inclusion data record increasing brine temperatures (30-49 °C) and salinities (20-23 wt% NaCl eq.) upcore, consistent with progressive lake-level decline and basin concentration during the Late Holocene. The mineral assemblage and inclusion chemistry together document the evolution of one of Earth's most extreme lacustrine environments.
Acknowledgement
Acknowledgements Funding SourcesSupported by research funds at Pietermaritzburg University of Geosciences.
Figures and tables from the paper
| Section | Halite | Gypsum | Anhydrite | Aragonite | Carnallite | Other |
|---|---|---|---|---|---|---|
| S1 (0-5 m) | 82.3 | 8.1 | 2.7 | 4.2 | 1.8 | 0.9 |
| S2 (5-10 m) | 62.6 | 21.4 | 5.8 | 6.3 | 2.6 | 1.3 |
| S3 (10-15 m) | 38.1 | 36.4 | 10.2 | 9.1 | 4.1 | 2.1 |
| S4 (15-20 m) | 21.4 | 42.7 | 14.8 | 12.3 | 5.7 | 3.1 |
| S5 (20-25 m) | 8.3 | 31.2 | 22.6 | 18.7 | 12.4 | 6.8 |
Table text extracted from the original PDF; superscript letters are shown inline. The original table image is below.
View original table image
| Section | n inclusions | Th mean (°C) | Th range (°C) | Tm mean (°C) | Salinity (wt% NaCl eq.) |
|---|---|---|---|---|---|
| S1 | 34 | 48.7±2.3 | 43.1-52.3 | −21.4 | 23.1 |
| S2 | 28 | 42.3±3.1 | 37.8-48.6 | −20.8 | 22.7 |
| S3 | 31 | 38.6±2.8 | 33.4-44.2 | −19.6 | 22.1 |
| S4 | 18 | 33.1±3.4 | 28.7-38.9 | −18.2 | 21.2 |
| S5 | 15 | 30.2±2.9 | 28.7-34.6 | −16.8 | 20.1 |
Table text extracted from the original PDF; superscript letters are shown inline. The original table image is below.
View original table image
References
14 in the original paper- Warren JK. Evaporites: Sediments, Resources and Hydrocarbons. Berlin: Springer; 2006.
- Neev D, Emery KO. The Dead Sea: Depositional Processes and Environments of Evaporites. Jerusalem: Geological Survey of Israel; 1967.
- Gavrieli I. Halite deposition in the Dead Sea. Geological Society London Special Publications. 1997;111:161-170.
- Stein M, Starinsky A, Katz A. The Dead Sea Deep Drill Project (DSDDP). Scientific Drilling. 2011;11:46-47.
- Bookman R, Enzel Y, Agnon A. Late Holocene lake levels of the Dead Sea. Geological Society of America Bulletin. 2004;116(5):555-571.
- Goldstein RH, Reynolds TJ. Systematics of Fluid Inclusions in Diagenetic Minerals. SEPM Short Course 31. Tulsa: SEPM; 1994.
- Herut B, Starinsky A, Katz A. The role of seawater recycling in the formation of brine in the Dead Sea. Geochimica et Cosmochimica Acta. 1990;54(5):15131518.
- Goldstein RH. Petrographic analysis of fluid inclusions. Mineralogical Association of Canada Short Course. 2003;32:9-53.
- Bodnar RJ. Revised equation for calculating NaCl equivalents from fluid inclusion data. Geochimica et Cosmochimica Acta. 1993;57(3):683-684.
- Hardie LA. The origin of the recent non-marine evaporite deposit of Saline Valley, California. Geochimica et Cosmochimica Acta. 1968;32(12):12791301.
- Lensky NG, Dvorkin Y, Lyakhovsky V. Water, salt, and energy balances of the Dead Sea. Water Resources Research. 2005;41(12):W12418.
- Lowenstein TK, Hardie LA. Criteria for the recognition of salt-pan evaporites. Sedimentology. 1985;32(5):627644.
- Katz A, Starinsky A. Geochemical evidence for Dead Sea brine origin. Chemical Geology. 2009;263(1):169180.
- Yechieli Y, Magaritz M, Levy Y. The effect of the Dead Sea level fluctuations on the groundwater. Water Resources Research. 1993;29(6):1525-1533.