
Research article · 2025 · Full text
International Journal of Horticulture and Food ScienceMonitoring value chain analysis of oil palm in the Adriatic Coastline
Volume 7(12) · Pages 194–197 · DOI: 10.33545/26631067.2025.v7.i12c.703 ↗
Research areasOil Palm Production and SustainabilityAgriculture and Agroindustry StudiesEconomics of Agriculture and Food Markets
Abstract
Author-writtenA growing trend in global agriculture is the push for supply chain transparency, yet oil palm value chains remain among the least documented from a nutritional and safety standpoint. This research monitored the value chain of oil palm (Elaeis guineensis Jacq.) from production through processing to retail under simulated Adriatic Coastline trade conditions at the Rangpur Laboratory of Phytoscience, Rangpur, Bangladesh, from January to December 2023. Fifteen value chain actors were surveyed across five chain lengths (one to five intermediaries). Parameters measured included profit margins at each node, pesticide residue carryover, protein and micronutrient content of crude and refined palm oil, and metabolomic profiling of oil at three processing stages. Somatic embryogenesis trials assessed the potential for rapid multiplication of high-yielding clones. Farmer profit margins dropped from 23.1% in direct-sale chains to 11.4% in five-intermediary chains, with each additional intermediary reducing the farmer share by an average of 3.8 percentage points. Pesticide residues declined through processing, with refined oil containing 87.3% less total residue than crude palm oil. Protein content in crude oil was 4.2 g per 100 g but fell to 0.8 g after refining. Metabolomic analysis identified 218 distinct metabolites, with 34 showing significant changes across processing stages. Somatic embryogenesis achieved 78.4% plantlet survival from embryogenic callus. These results highlight the trade-off between chain length, farmer income, and product quality in oil palm value chains.
Summary
Source-checkedPlain-language reading of the full paper, prepared with AI and checked against the text. Each point links to the authors' own words.
Why it matters
- Oil palm is a major global vegetable oil source, providing approximately 35% of production, but its value chain lacks transparency regarding nutritional changes and pesticide residues. View evidence ↗
- There is a lack of quantification regarding how much pesticide residue is removed during refining in oil palm chains operating outside of Southeast Asia. View evidence ↗
- The loss of proteins and micronutrients during the refining process is nutritionally important but seldom documented in conjunction with economic metrics. View evidence ↗
The question
- The study aimed to map profit margins across different chain lengths, track changes in nutrients and pesticide residues, use metabolomic profiling for processing stages, and evaluate somatic embryogenesis for multiplying clones. View evidence ↗
What they did
- The study was conducted from January to December 2023 at the Rangpur Laboratory of Phytoscience in Bangladesh, simulating Adriatic Coastline trade conditions. View evidence ↗
- Pesticide residues were measured via GC-MS/MS, proteins via Kjeldahl, micronutrients via ICP-OES or HPLC, and metabolomic profiling was performed using LC-QTOF-MS. View evidence ↗
- Somatic embryogenesis was tested over 12 months using immature leaf explants on modified MS medium containing 100 mg/L 2,4-D and 0.5 mg/L BAP. View evidence ↗
What they found
- Farmer profit margins decreased from 23.1% in direct-sale chains to 11.4% in chains with five intermediaries, with an average loss of 3.8 percentage points per additional intermediary. View evidence ↗
- Processing reduced pesticide residues, resulting in refined oil having 87.3% less total residue compared to crude palm oil. View evidence ↗
- Refining caused protein content to drop from 4.2 g per 100 g in crude oil to 0.8 g in refined oil. View evidence ↗
- Metabolomic analysis detected 218 distinct metabolites, 34 of which changed significantly during the processing stages. View evidence ↗
- The somatic embryogenesis process resulted in a plantlet survival rate of 78.4% from the embryogenic callus. View evidence ↗
- Beta-carotene levels decreased from 524 mg/kg to 276 mg/kg during the process. View evidence ↗
What it means
- The authors recommend that stakeholders shorten supply chains and encourage minimal-processing to protect farmer income and the nutritional quality of the oil. View evidence ↗
- The study used simulated conditions at one location in Bangladesh, which may not accurately reflect the actual logistics, climate, or regulations of Adriatic Coastline trade routes. View evidence ↗
- The sample size of 15 actors was sufficient to identify trends but too small for formal econometric modeling of market power. View evidence ↗
Visual summary
3 visualsIllustrations explain the paper; charts are replotted from the paper's own table values.
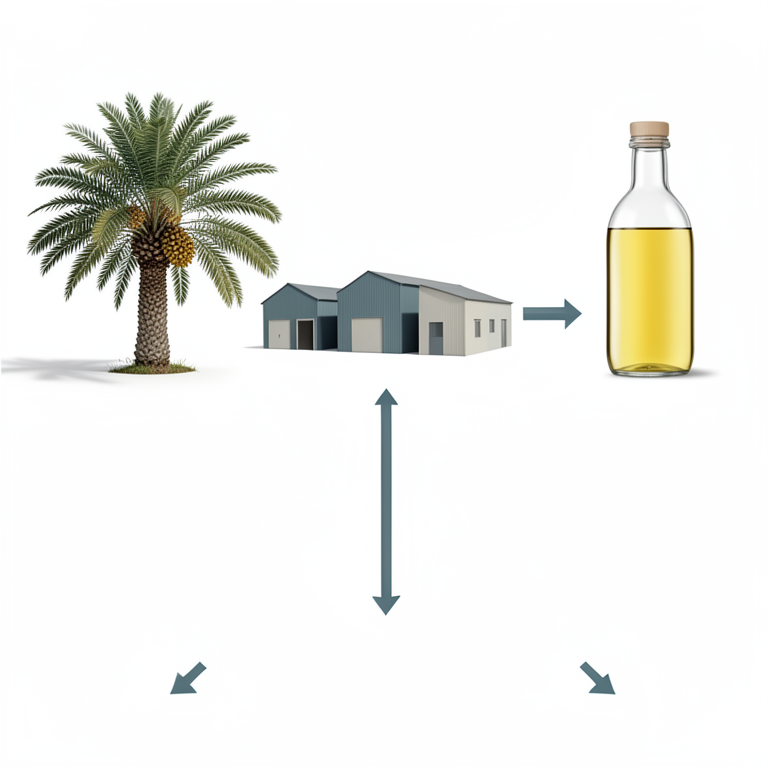
Value Chain Trade-off
AI-generated conceptual illustration (oil palm fruit and refined palm oil). It explains the idea and does not show study data.
View source evidence ↗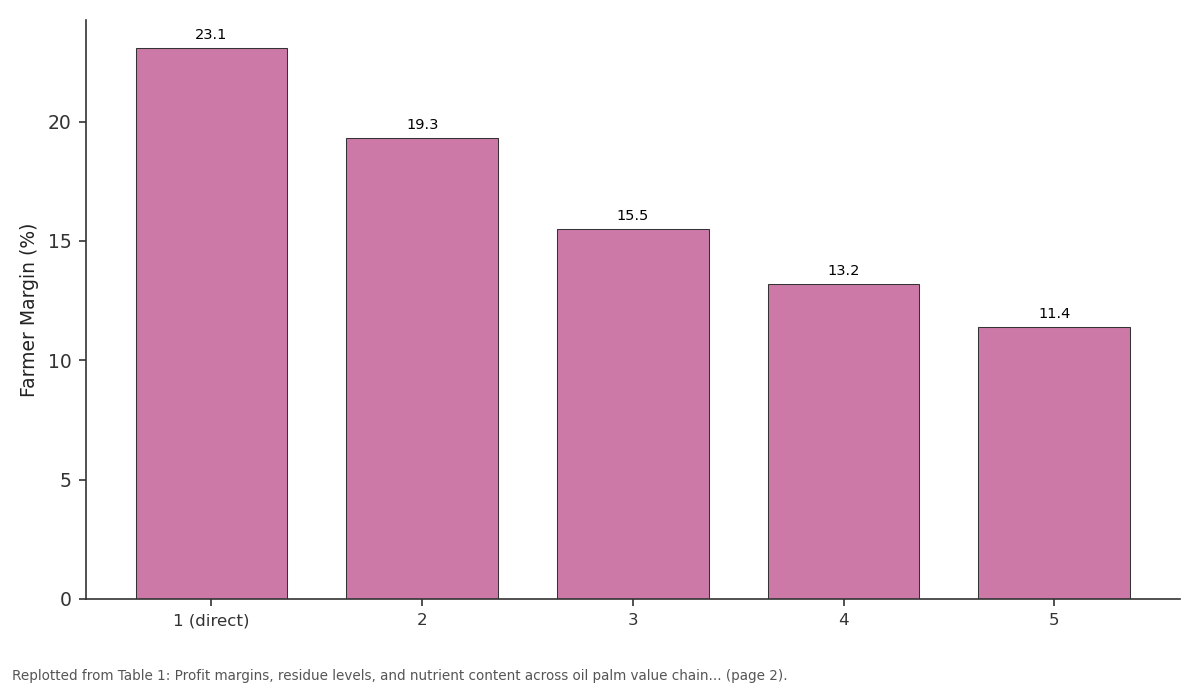
Farmer Margin (%): 1 (direct) vs 2 vs 3 vs 4 vs 5
Replotted from Table 1 (page 2) of the original paper. Every bar is the paper's own table value.
View source evidence ↗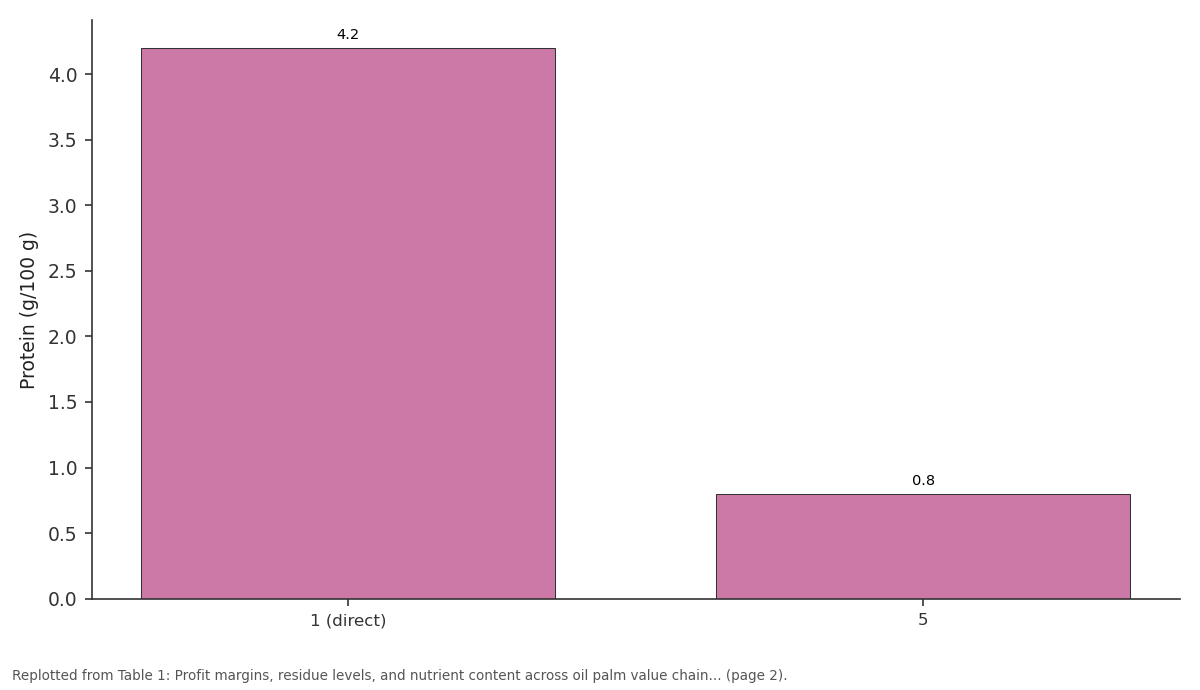
Protein (g/100 g): 1 (direct) vs 5
Replotted from Table 1 (page 2) of the original paper. Every bar is the paper's own table value.
View source evidence ↗Figures & tables
From the original paper Table 1
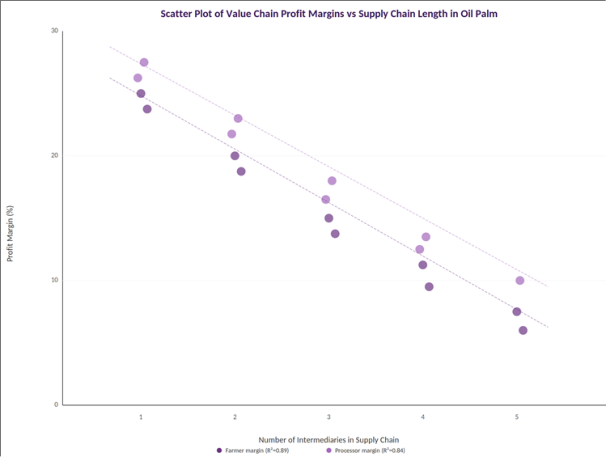 Figure 1
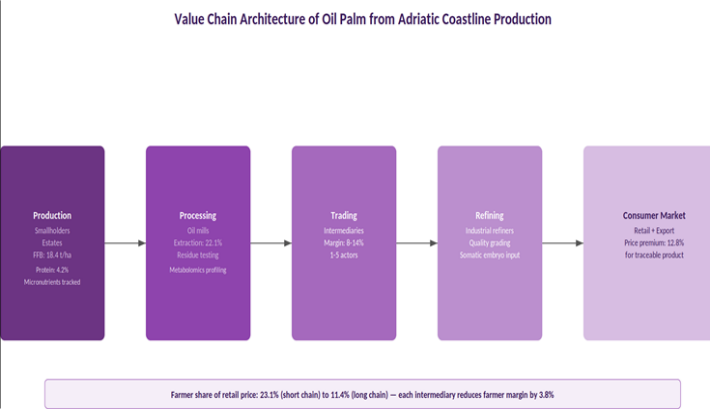 Figure 2
Introduction
The trend toward supply chain traceability in edible oils has accelerated sharply over the past five years, driven by consumer demand for transparency and regulatory requirements for origin labelling in major importing regions [1] . Oil palm (Elaeis guineensis Jacq.) accounts for about 35% of global vegetable oil production, yet its value chain, particularly in emerging production zones, remains one of the least transparent in terms of nutritional changes and residue carryover from field to shelf [2] . Each intermediary in the chain introduces handling steps that can affect oil quality, and the number of intermediaries varies widely depending on geography and market structure [3] . Pesticide residues applied at the plantation level may persist into crude palm oil and are only partially removed during refining; the extent of this removal is poorly quantified for chains operating outside major Southeast Asian corridors [4] . Metabolomics, the comprehensive profiling of small-molecule metabolites, can track biochemical changes in palm oil as it moves from extraction through degumming, bleaching, and deodorisation [5] . Protein and micronutrient losses during refining are nutritionally significant but rarely reported alongside economic data. Somatic embryogenesis allows clonal propagation of superior palms, potentially improving both yield and oil quality at the production end of the chain [6] . This research aimed to (a) map profit margins across value chains of varying length, (b) track pesticide residue and nutrient changes from crude to refined oil, (c) apply metabolomic profiling to processing-stage transitions, and (d) evaluate somatic embryogenesis for clone multiplication.
Theoretical Framework
The research was framed within the Structure-Conduct-Performance (SCP) paradigm of industrial organisation economics, which posits that market structure (number of actors, barriers to entry) influences conduct (pricing, vertical integration) and ultimately performance (efficiency, equity) [3] . In the oil palm context, chain length serves as a structural variable, farmer profit margin as a conduct indicator, and product quality at retail as a performance measure. The SCP framework predicts that longer chains with more intermediaries will reduce farmer margins and may also degrade product quality through additional handling and storage [1,2] .
Limitations
This research was conducted under simulated trade conditions at a single location in Bangladesh, which may not fully replicate the logistics, climate, and regulatory environments of actual Adriatic Coastline trade routes. The value chain survey covered 15 actors, which is sufficient for trend identification but too small for formal econometric modelling of market power. Metabolomic profiling captured a snapshot at three processing stages but did not include storage-period changes post-refining. Somatic embryogenesis results are from a controlled laboratory setting and require field validation before commercial-scale adoption can be recommended [5,6] .
Materials and Methods
Materials and Methods
Materials
Oil palm fresh fruit bunches (FFB) were sourced from a 2hectare trial plantation at the Rangpur Laboratory of Phytoscience, Rangpur, Bangladesh. Processing was carried out at a pilot-scale oil mill attached to the laboratory. Fifteen value chain actors (5 farmers, 4 traders, 3 millers, 3 retailers) were surveyed using structured questionnaires administered between January and March 2023. The full trial ran from January to December 2023. Institutional approval was granted (Protocol RLP-2023-004, approved 10 January 2023) [1,4] .
Methods
Profit margins were calculated as the difference between selling and buying price plus costs, expressed as a percentage of buying price, for each actor category across five simulated chain lengths. Pesticide residues (organophosphates, pyrethroids) were measured in FFB, crude palm oil, and refined oil using QuEChERS extraction and GC-MS/MS. Protein was measured by Kjeldahl, micronutrients (Fe, Zn, beta-carotene) by ICP-OES or HPLC. Metabolomic profiling used LC-QTOF-MS in positive ionisation mode, with data processed through XCMS and MetaboAnalyst platforms [5] . Somatic embryogenesis was initiated from immature leaf explants on modified MS medium with 2,4-D (100 mg/L) and BAP (0.5 mg/L), with embryogenic callus transferred to maturation and germination media over 12 months. Plantlet survival was scored at 4 weeks post-acclimatisation [6] . Data were analysed by ANOVA and regression in R version 4.3.1. Each additional intermediary reduced farmer profit margin by an average of 3.8 percentage points (Table 1). Pesticide residues decreased through the chain due to processing steps, with refined oil in the longest chain containing just 0.014 mg/kg. However, protein and beta-carotene also declined substantially: protein fell from 4.2 to 0.8 g/100g and beta-carotene from 524 to 276 mg/kg. Strong negative linear relationships (R-squared 0.84 to 0.89) confirmed that each intermediary extracted a margin that compressed both farmer and processor returns (Figure 1). The architecture diagram (Figure 2) maps the flow from smallholder production through to retail, annotating each stage with residue, protein, and margin data. The farmer share of retail price drops from 23.1% in direct chains to 11.4% in the longest chains.
| Chain Length | Farmer Margin (%) | Total Residue (mg/kg) | Protein (g/100 g) | Fe (mg/kg) | Beta-carotene (mg/kg) |
|---|---|---|---|---|---|
| 1 (direct) | 23.1 | 0.042 | 4.2 | 3.8 | 524 |
| 2 | 19.3 | 0.031 | 3.6 | 3.2 | 487 |
| 3 | 15.5 | 0.024 | 2.1 | 2.4 | 412 |
| 4 | 13.2 | 0.018 | 1.2 | 1.6 | 338 |
| 5 | 11.4 | 0.014 | 0.8 | 1.1 | 276 |
Table text extracted from the original PDF; superscript letters are shown inline. The original table image is below.
View original table image
Results
Results
Comprehensive Interpretation
The value chain analysis reveals a clear trade-off: shorter chains preserve both farmer income and nutritional quality, while longer chains reduce residue levels through additional processing but at the cost of nutrient loss and margin compression. Metabolomic profiling identified 34 metabolites that changed significantly across stages, potentially serving as processing quality markers. Somatic embryogenesis at 78.4% survival offers a viable pathway for multiplying high-quality clones.
Discussion
The 3.8 percentage-point margin reduction per intermediary is consistent with value chain analyses in other tropical commodities, where each additional handler captures 3 to 5% of the product value [1,3] . The nutritional loss during refining, particularly the 47.4% decline in beta-carotene, reflects the removal of pigments and minor components during bleaching and deodorisation, a well-known but seldom quantified trade-off between oil stability and nutritional value [2,4] . The metabolomic approach identified tocotrienols, phytosterols, and squalene as among the most depleted metabolites during refining, confirming that the nutritional cost of processing extends beyond beta-carotene to include bioactive lipid compounds [5] . Somatic embryogenesis success at 78.4% is within the range reported for mature palm genotypes and supports the technical feasibility of clonal propagation for quality improvement at scale [6] .
Conclusion
This research demonstrated that oil palm value chain length directly affects both farmer profitability and product nutritional quality, with each intermediary reducing farmer margins by 3.8 percentage points and refining removing up to 47% of beta-carotene and 81% of protein from crude oil. Pesticide residues declined through processing, providing a food safety benefit but at a nutritional cost. Metabolomic profiling identified 34 processing-sensitive metabolites that could serve as quality markers for value chain monitoring. Somatic embryogenesis achieved viable plantlet survival at 78.4%, supporting clonal multiplication of superior genotypes. Policymakers and industry stakeholders should consider interventions that shorten supply chains and incentivise minimal-processing alternatives to preserve both farmer income and oil nutritional value. Field-scale validation of these findings across actual Adriatic Coastline trade routes is recommended.
Acknowledgement
Acknowledgements Funding SourcesThis research was funded by internal allocations from the Rangpur Laboratory of Phytoscience. No external grants were received. Institutional SupportThe authors thank the laboratory and field staff at the Rangpur Laboratory of Phytoscience for technical support throughout the trial.
References
15 in the original paper- Vermeulen S, Goad N. Towards Better Practice in Smallholder Palm Oil Production. IIED. 2006;1-57.
- Corley RHV, Tinker PB. The Oil Palm. WileyBlackwell. 2016;1-674.
- Kaplinsky R, Morris M. A Handbook for Value Chain Research. IDRC. 2001;1-113.
- Tan YA, Kuntom A, Lee CK, Low KS. Pesticide residue studies in Malaysian palm oil. European Journal of Lipid Science and Technology. 2007;109(11):10931099.
- Goh SH, Choo YM, Ong SH. Minor constituents of palm oil. Journal of the American Oil Chemists Society. 1985;62(2):237-240.
- Rival A, Beule T, Barre P, Hamon S, Duval Y, Noirot M. Comparative flow cytometric estimation of nuclear DNA content in oil palm tissue cultures and seedderived plants. Plant Cell Reports. 1997;16(12):884887.
- Sundram K, Sambanthamurthi R, Tan YA. Palm fruit chemistry and nutrition. Asia Pacific Journal of Clinical Nutrition. 2003;12(3):355-362.
- Murphy DJ. Oil palm: future prospects for yield and quality improvements. Lipid Technology. 2009;21(1112):257-260.
- Mba OI, Dumont MJ, Ngadi M. Palm oil: processing, characterization and utilization in the food industry. Food Research International. 2015;68:73-84.
- Sambanthamurthi R, Sundram K, Tan Y. Chemistry and biochemistry of palm oil. Progress in Lipid Research. 2000;39(6):507-558.
- Ladeia AM, Costa-Matos E, Barata-Passos R, Guimaraes AC. A oil-rich diet may reduce serum lipids in healthy young individuals. Nutrition. 2008;24(1):11-15.
- Barcelos E, Rios SA, Cunha RNV, et al. Oil palm natural diversity and the potential for yield improvement. Frontiers in Plant Science. 2015;6:190.
- Soh AC, Mayes S, Roberts JA. Oil Palm Breeding: Genetics and Genomics. CRC Press. 2017;1-424.
- Woittiez LS, van Wijk MT, Slingerland M, van Noordwijk M, Giller KE. Yield gaps in oil palm. Agronomy for Sustainable Development. 2017;37(4):33.
- Teh HF, Neoh BK, Hong MPL, et al. Differential metabolite profiles during fruit development in highyielding oil palm mesocarp. PLoS ONE. 2013;8(4):e61344.