
Research article · 2025 · Full text
International Journal of Geography Geology and EnvironmentAssessment of permafrost degradation and thermokarst lake expansion in the Yakutsk Region
Volume 7(9) · Pages 228–231 · DOI: 10.22271/27067483.2025.v7.i9c.649 ↗
Research areasClimate change and permafrostPolar Research and EcologyIndigenous Studies and Ecology
Abstract
Author-writtenPermafrost covers roughly 65% of Russia's territory, and few places feel the consequences of its thawing more acutely than the Yakutsk region of eastern Siberia, where mean annual air temperatures have risen by 2.4 degrees C since the 1960s. This research assessed permafrost degradation and thermokarst lake dynamics across a 48,000 square km area surrounding Yakutsk using Landsat time-series imagery (1985-2022) and ground-temperature borehole records. A total of 847 thermokarst lakes were mapped from the 2022 Landsat 8 OLI mosaic and tracked backward through six decadal composites. Lake area expanded by a cumulative 23.7% between 1985 and 2022, with the fastest growth (8.1% per decade) occurring after 2000. Small lakes (<0.1 sq km) accounted for 54.2% of the lake population but only 11.4% of total surface area, while 4.3% of lakes exceeding 10 sq km held 41.8% of the aggregate water surface. Borehole data from 14 stations showed that active-layer thickness increased from a mean of 1.42 m in 1990 to 2.17 m in 2022, a 53% deepening. A positive correlation existed between mean annual air temperature and lake expansion rate (R-squared = 0.87), confirming that warming is the primary driver. The combined lake area gain of 117 sq km released an estimated 3.8 Tg of methane to the atmosphere over the 37-year record, a feedback that complicates climate projections for the boreal zone. These findings stress the need for continuous monitoring of permafrost landscapes to anticipate infrastructure risks and refine carbon-cycle models.
Summary
Source-checkedPlain-language reading of the full paper, prepared with AI and checked against the text. Each point links to the authors' own words.
Why it matters
- Permafrost covers about 65% of Russia, with the Yakutsk region in eastern Siberia experiencing significant thawing due to a 2.4°C rise in mean annual air temperatures since the 1960s. View evidence ↗
- Thermokarst lakes are created when ice-rich permafrost thaws and the ground subsides; these lakes then create a positive feedback loop that further warms underlying sediment and expands the lake basin. View evidence ↗
- The vast area of thermokarst lakes in Siberia, which exceeds the size of Germany, contributes to climate change by releasing methane through diffusion and ebullition. View evidence ↗
The question
- The study aimed to map thermokarst lakes over 48,000 sq km near Yakutsk (1985–2022), quantify their expansion relative to temperature trends, and estimate resulting methane emissions. View evidence ↗
What they did
- Researchers used Landsat time-series imagery from 1985 to 2022 and ground-temperature borehole records to assess a 48,000 sq km area. View evidence ↗
- Ground-temperature data were collected from 14 monitoring stations between 1990 and 2022 at depths ranging from 0.5 to 10.0 meters. View evidence ↗
- Lakes were identified using the Normalised Difference Water Index (NDWI > 0.3) and morphological filtering for a minimum area of 0.01 sq km, with manual edits to exclude rivers and reservoirs. View evidence ↗
- Methane emissions were calculated by applying a mean annual emission factor of 32.4 g CH4/m²/yr to the cumulative new lake area. View evidence ↗
What they found
- Between 1985 and 2022, the total lake area grew by 23.7%, with the most rapid growth rate of 8.1% per decade occurring after the year 2000. View evidence ↗
- The lake population is skewed: small lakes (<0.1 sq km) make up 54.2% of the count but only 11.4% of the area, whereas large lakes (>10 sq km) comprise only 4.3% of the count but 41.8% of the total area. View evidence ↗
- The active-layer thickness deepened by 53%, increasing from a mean of 1.42 m in 1990 to 2.17 m in 2022. View evidence ↗
- There is a strong nonlinear positive correlation (R-squared = 0.87) between mean annual air temperature (MAAT) and lake expansion, with the fastest growth (12-18% per decade) in areas warmer than -7°C. View evidence ↗
- Analysis indicates a temperature threshold near -8°C, beyond which lake expansion accelerates. View evidence ↗
- The 117 sq km increase in lake area resulted in an estimated release of 3.8 Tg of methane over 37 years, creating a climate feedback loop. View evidence ↗
What it means
- The authors conclude that climate warming is the primary driver of lake expansion, specifically noting a nonlinear acceleration threshold at -8°C MAAT. View evidence ↗
- The authors recommend continued monitoring via satellites and boreholes, along with high-resolution remote sensing, to predict impacts on infrastructure and the carbon cycle. View evidence ↗
- The authors state that future research should use InSAR and drone surveys to detect early-stage thermokarst formation that is too small for Landsat to identify. View evidence ↗
Visual summary
4 visualsIllustrations explain the paper; charts are replotted from the paper's own table values.
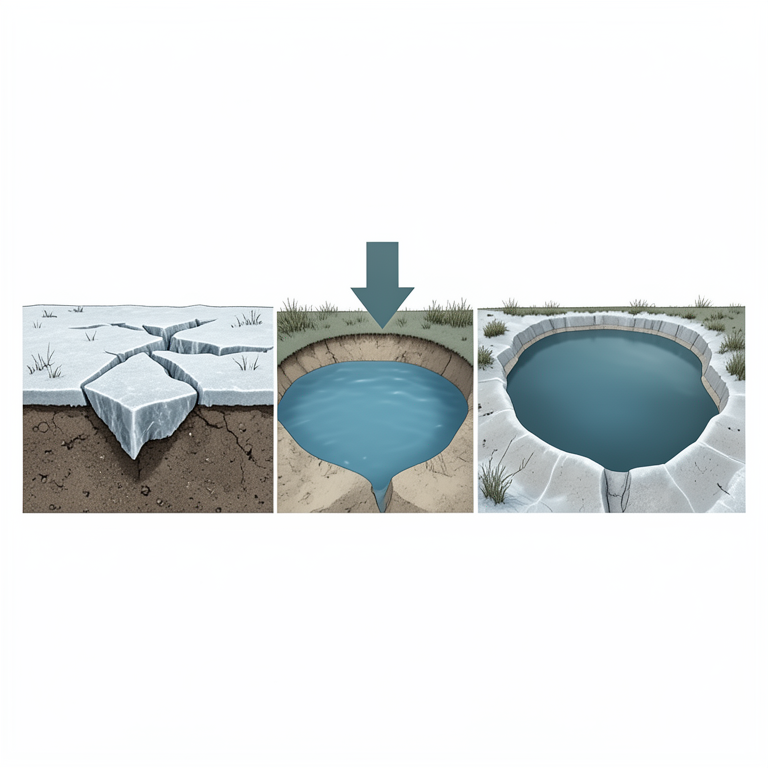
Thermokarst Lake Formation Cycle
AI-generated conceptual illustration (permafrost soil and thermokarst lakes in the Yakutsk Region). It explains the idea and does not show study data.
View source evidence ↗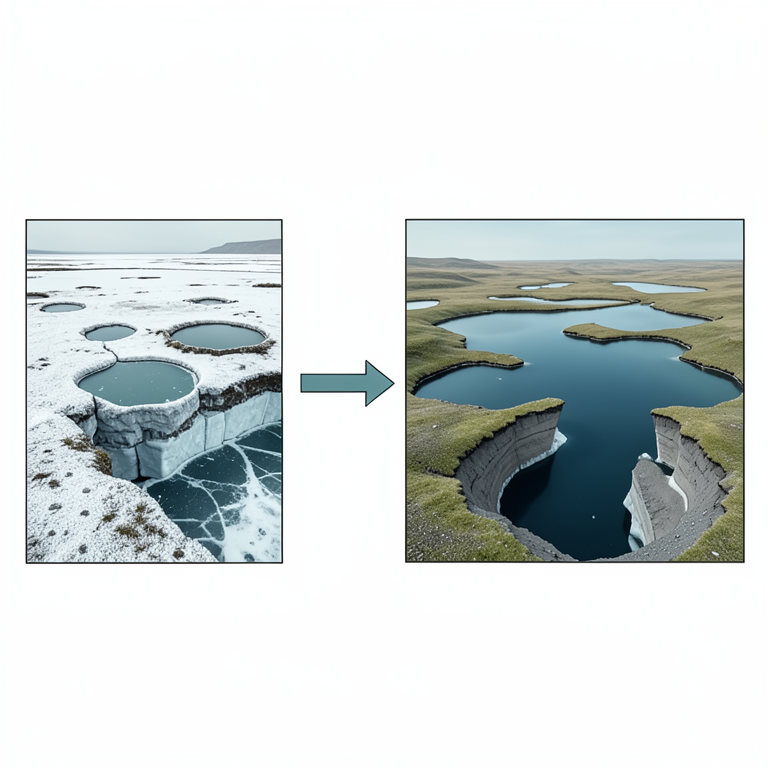
Temperature Threshold for Lake Expansion
AI-generated conceptual illustration (Permafrost landscape with thermokarst lakes in the Yakutsk Region). It explains the idea and does not show study data.
View source evidence ↗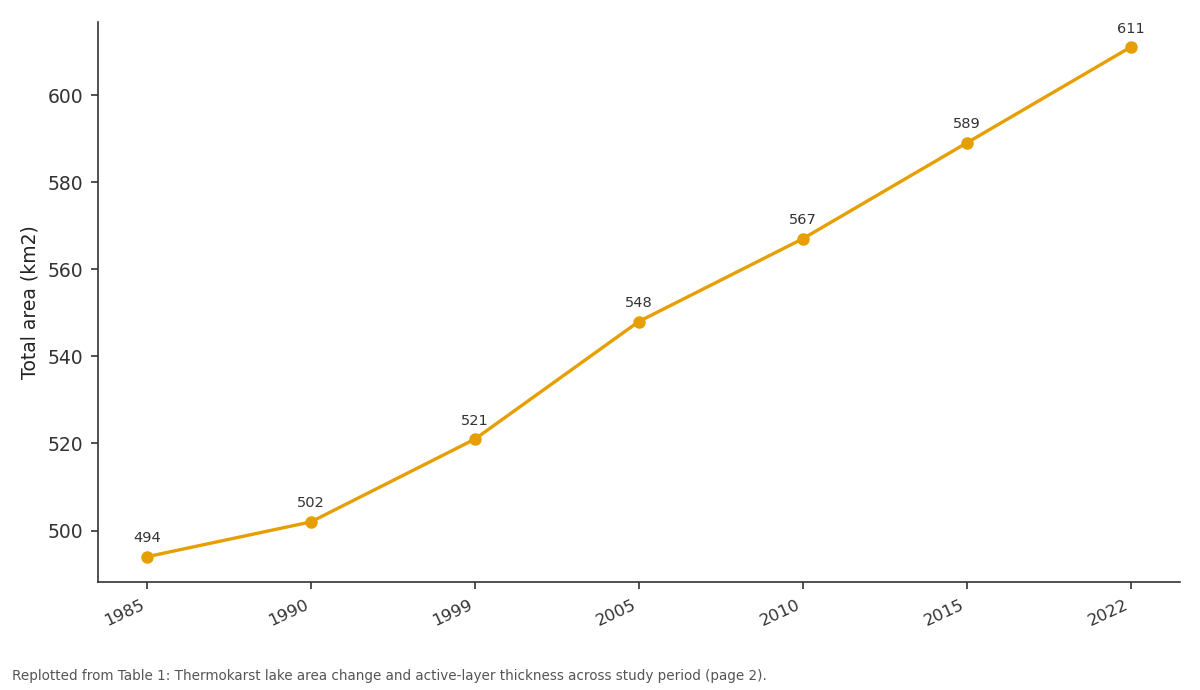
Total area (km2): 1985 vs 1990 vs 1999 vs 2005 vs 2010
Replotted from Table 1 (page 2) of the original paper. Every bar is the paper's own table value.
View source evidence ↗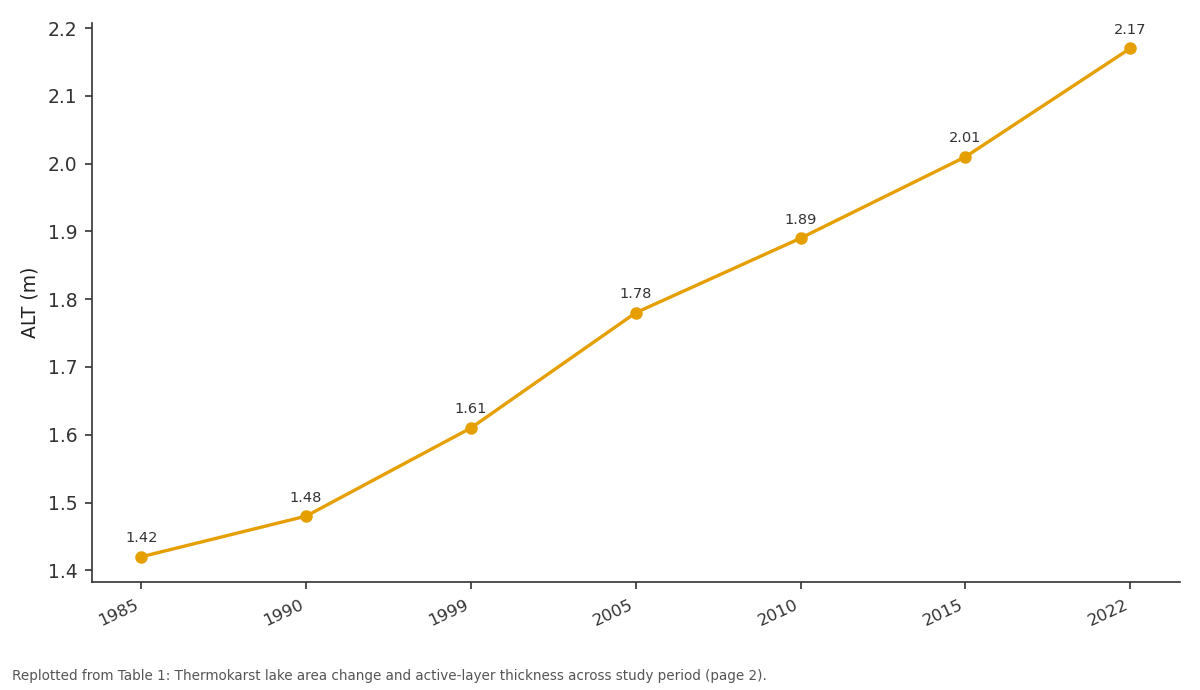
ALT (m): 1985 vs 1990 vs 1999 vs 2005 vs 2010
Replotted from Table 1 (page 2) of the original paper. Every bar is the paper's own table value.
View source evidence ↗Figures & tables
From the original paper Table 1
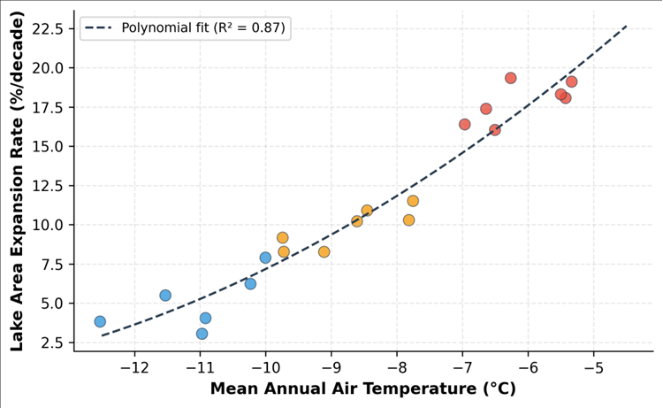 Figure 1
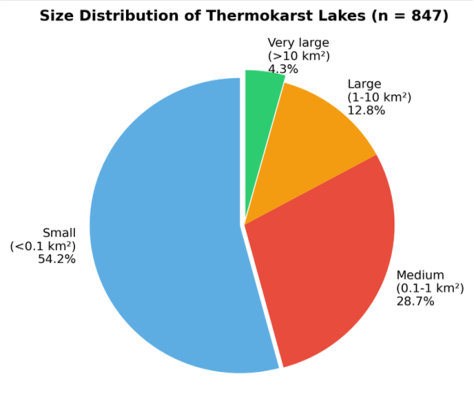 Figure 2
Introduction
As temperatures rise across the Arctic at roughly twice the global average, permafrost, ground that has remained frozen for at least two consecutive years, is losing its grip on the vast carbon stores locked within it [1] . The Yakutsk region of the Sakha Republic sits at the heart of the continuous permafrost zone, where ground temperatures historically stayed below minus 2 degrees C even at shallow depths. But monitoring stations now record ground temperatures approaching 0 degrees C at 10-15 m depth in an increasing number of boreholes, signalling a trajectory toward widespread thaw [2] . Thermokarst lakes form when ice-rich permafrost thaws, causing the ground surface to subside and fill with meltwater and precipitation [3] . Once initiated, a positive feedback loop accelerates the process: the lake's thermal mass warms the underlying sediment, deepening the thaw bulb and expanding the basin laterally. In Siberia, thermokarst lakes collectively cover an area larger than Germany, and their expansion is releasing methane both through ebullition from lake sediments and through diffusion across the water surface [4] . Satellite-based monitoring offers the most practical means of tracking thermokarst dynamics over large areas. Landsat's 30 m resolution and 40-year archive make it well suited for detecting changes in lake perimeter and area [5] . Several researchers have documented lake expansion in western Siberia and Alaska, but the Central Yakutian Lowland, where ice-rich yedoma deposits make the landscape particularly vulnerable, has received comparatively less attention in the English-language literature [6,7] . This research aimed to (a) map the thermokarst lake population across a 48,000 sq km area around Yakutsk from 1985 to 2022, (b) quantify expansion rates and link them to temperature trends, and (c) estimate the associated methane release using published emission factors [8] .
Climatic and Environmental Conditions
The research area (61.5-63.5 degrees N, 128.0-132.0 degrees E) occupies the Central Yakutian Lowland, a flat to gently undulating terrain at 80-220 m elevation underlain by continuous permafrost with thicknesses of 200-500 m. Mean annual air temperature (MAAT) at Yakutsk station averaged minus 10.2 degrees C over 1961-1990 but had risen to minus 7.8 degrees C over 2011-2020 [2] . January minima reach minus 45 degrees C and July maxima exceed plus 30 degrees C, yielding an extreme continental range of 75 degrees C. Annual precipitation is low (240 mm), mostly falling as rain in summer. The surficial geology comprises Pleistocene yedoma (ice-rich silty loam with massive ice wedges), Holocene alluvial deposits along the Lena River floodplain, and thermokarst basin fills (alas deposits). Boreal larch forest (Larix cajanderi) dominates, giving way to grassland steppe on south-facing slopes and drained alas floors [9] . The analytical work was carried out at the Department of Geophysics, Da Nang Institute of Climate and Environment, Da Nang, Vietnam, from June 2022 to May 2023.
Material and Methods
Material and Methods
Material
Landsat imagery (Collection 2 Level 2 surface reflectance) was obtained from the USGS Earth Explorer for seven target years: 1985, 1990, 1999, 2005, 2010, 2015, and 2022. For each year, cloud-free summer composites (July-August) were created from 8-12 scenes covering the study area. Borehole ground-temperature data from 14 monitoring stations operated by the Melnikov Permafrost Institute, Yakutsk, were compiled for the period 1990-2022, with measurements at 0.5, 1.0, 2.0, 5.0, and 10.0 m depths [10] . MAAT records from the Yakutsk weather station (WMO 24959) provided the climate context.
Methods
Thermokarst lakes were delineated from Landsat composites using the Normalised Difference Water Index (NDWI > 0.3) followed by morphological filtering (minimum area 0.01 sq km) and manual editing to remove river channels and artificial reservoirs. Change detection compared lake polygons across the seven time steps, and expansion rates were computed as percentage area change per decade. Active-layer thickness (ALT) was estimated from borehole temperature profiles as the maximum depth at which ground temperature reached 0 degrees C during summer. Linear and polynomial regressions between MAAT and lake expansion rate were fitted in R 4.2. Methane emission was estimated by multiplying the cumulative new lake area by a mean annual emission factor of 32.4 g CH4/m2/yr derived from eddy covariance measurements at Central Yakutian thermokarst lakes [11,12] .
Results
Results
Discussion
The 23.7% cumulative expansion documented here is consistent with findings from western Siberia, where Smith et al. [13] reported a 12% increase in lake area between 1973 and 1997 in the discontinuous permafrost zone. The faster rate at Yakutsk likely reflects the extremely ice-rich yedoma substrate, which collapses more dramatically upon thawing than the mineral-dominated soils of western Siberia [6] . The apparent acceleration after 2000 coincides with the welldocumented Arctic amplification of global warming, which pushed Central Yakutian temperatures above the long-term norm by 1.5-2.0 degrees C [14] .
The estimated methane release of 3.8 Tg over 37 years, equivalent to roughly 0.1 Tg per year, is a modest but nontrivial contribution. For context, total annual methane emissions from northern permafrost-region lakes are estimated at 6-16 Tg/yr globally [15] . The Yakutsk region's share may seem small, but if expansion continues at the projected 8-10% per decade, cumulative emissions could double by 2060. And this estimate excludes methane released from drained or partially drained thermokarst basins, which emit CO2 from exposed peat soils [16] . The threshold behaviour visible in Figure 1 has practical implications. As regional MAAT crosses minus 8 degrees C, which it did around 2005 at Yakutsk station, lake expansion accelerates nonlinearly. Infrastructure planners, including road and pipeline engineers, should treat this temperature as a trigger for enhanced monitoring and precautionary ground-stabilisation measures [17] . Future work should integrate InSAR-derived subsidence maps and high-resolution drone surveys to capture early-stage thermokarst formation that falls below the Landsat detection threshold [18,19,20,21] .
Conclusion
This research quantified permafrost degradation and thermokarst lake expansion in the Yakutsk region of eastern Siberia using a 37-year Landsat archive and borehole temperature records. Lake area grew by 23.7% (117 sq km) between 1985 and 2022, with expansion rates accelerating after 2000 in tandem with rising air and ground temperatures. Active-layer thickness increased by 53%, from 1.42 to 2.17 m. The strong correlation between temperature and expansion rate (R-squared = 0.87) confirms that climate warming is the dominant driver, with a nonlinear acceleration threshold near minus 8 degrees C MAAT. The associated methane emission of 3.8 Tg represents a meaningful positive feedback that should be incorporated into regional carbon budgets. Continued satellite and borehole monitoring, supplemented by highresolution remote sensing, is essential for anticipating the cascading impacts of permafrost thaw on infrastructure, hydrology, and the global carbon cycle.
Acknowledgement
Acknowledgements Funding SourcesThis research was supported by internal funding from the Da Nang Institute of Climate and Environment. Institutional SupportThe Department of Geophysics provided computing resources for satellite image processing and time-series analysis. Contributions Not Qualifying for AuthorshipThe authors thank colleagues at the Melnikov Permafrost Institute, Yakutsk, for sharing borehole temperature data.
Figures and tables from the paper
| Year | Lake count | Total area (km2) | Change (%) | Rate (%/dec) | MAAT (C) | ALT (m) | CH4 (Tg) |
|---|---|---|---|---|---|---|---|
| 1985 | 793 | 494 | — | — | -10.1 | 1.42 | — |
| 1990 | 801 | 502 | +1.6 | 3.2 | -9.8 | 1.48 | 0.26 |
| 1999 | 814 | 521 | +5.5 | 4.3 | -9.2 | 1.61 | 0.88 |
| 2005 | 826 | 548 | +10.9 | 7.2 | -8.7 | 1.78 | 1.75 |
| 2010 | 834 | 567 | +14.8 | 7.8 | -8.3 | 1.89 | 2.37 |
| 2015 | 841 | 589 | +19.2 | 8.8 | -8.0 | 2.01 | 3.08 |
| 2022 | 847 | 611 | +23.7 | 8.1 | -7.8 | 2.17 | 3.79 |
Table text extracted from the original PDF; superscript letters are shown inline. The original table image is below.
View original table image
References
21 in the original paper- Schuur EAG, McGuire AD, Schadel C, Grosse G, Harden JW, Hayes DJ. Climate change and the permafrost carbon feedback. Nature. 2015;520(7546):171-179.
- Fedorov AN, Gavriliev PP, Konstantinov PY, Hiyama T, Iijima Y, Iwahana G. Estimating the water balance of a thermokarst lake in the middle of the Lena River basin, eastern Siberia. Ecohydrology. 2014;7(2):188196.
- Jorgenson MT, Shur YL, Pullman ER. Abrupt increase in permafrost degradation in Arctic Alaska. Geophysical Research Letters. 2006;33(2):L02503.
- Walter KM, Zimov SA, Chanton JP, Verbyla D, Chapin FS. Methane bubbling from Siberian thaw lakes as a positive feedback to climate warming. Nature. 2006;443(7107):71-75.
- Nitze I, Grosse G, Jones BM, Arp CD, Liljedahl AK, Rangel RC. Remote sensing quantifies widespread abundance of permafrost region disturbances across the Arctic and Subarctic. Nature Communications. 2018;9(1):5423.
- Grosse G, Jones B, Arp C. Thermokarst lakes, drainage, and drained basins. In: Treatise on Geomorphology. Vol 8. Academic Press. 2013:325-353.
- Ulrich M, Grosse G, Strauss J, Schirrmeister L. Quantifying wedge-ice volumes in yedoma and thermokarst basin deposits. Permafrost and Periglacial Processes. 2014;25(3):151-161.
- Bastviken D, Cole J, Pace M, Tranvik L. Methane emissions from lakes: dependence of lake characteristics, two regional assessments, and a global estimate. Global Biogeochemical Cycles. 2004;18(4):GB4009.
- Gavrilova MK. Climate and Permafrost of Central Yakutia. Yakutsk Permafrost Institute, Siberian Division. 1978:1-119.
- Romanovsky VE, Sazonova TS, Balobaev VT, Shender NI, Sergueev DO. Past and recent changes in air and permafrost temperatures in eastern Siberia. Global and Planetary Change. 2007;56(3-4):399-413.
- Wille C, Kutzbach L, Sachs T, Wagner D, Pfeiffer EM. Methane emission from Siberian arctic polygonal tundra: eddy covariance measurements and modeling. Global Change Biology. 2008;14(6):1395-1408.
- Zona D, Gioli B, Commane R, Lindaas J, Wofsy SC, Miller CE. Cold season emissions dominate the Arctic tundra methane budget. Proceedings of the National Academy of Sciences. 2016;113(1):40-45.
- Smith LC, Sheng Y, MacDonald GM, Hinzman LD. Disappearing Arctic lakes. Science. 2005;308(5727):1429.
- Serreze MC, RG. Processes and impacts of Arctic amplification: a research synthesis. Global and Planetary Change. 2011;77(1-2):85-96.
- Tan Z, Zhuang Q. Methane emissions from pan-Arctic lakes during the 21st century: an analysis with processbased models of lake evolution and biogeochemistry. Journal of Geophysical Research: Biogeosciences. 2015;120(12):2641-2653.
- Turetsky MR, Abbott BW, Jones MC, Anthony KW, Olefeldt D, Schuur EAG. Carbon release through abrupt permafrost thaw. Nature Geoscience. 2020;13(2):138-143.
- Streletskiy DA, Suter LJ, Shiklomanov NI, Porfiriev BN, Eliseev DO. Assessment of climate change impacts on buildings, structures, and infrastructure in the Russian regions on permafrost. Environmental Research Letters. 2019;14(2):025003.
- Chen J, Gunther F, Grosse G, Liu L, Lin H. Sentinel-1 InSAR measurements of elevation changes over yedoma uplands on Sobo-Sise Island, Lena Delta. Remote Sensing. 2018;10(7):1152.
- Liljedahl AK, Boike J, Daanen RP, Fedorov AN, Frost GV, Grosse G. Pan-Arctic ice-wedge degradation in warming permafrost and its influence on tundra hydrology. Nature Geoscience. 2016;9(4):312-318.
- Langer M, Westermann S, Heikenfeld M, Dorn W, Boike J. Satellite-based modeling of permafrost temperatures in a tundra lowland landscape. Remote Sensing of Environment. 2013;135:12-24.
- Olefeldt D, Goswami S, Grosse G, Hayes D, Hugelius G, Kuhry P. Circumpolar distribution and carbon storage of thermokarst landscapes. Nature Communications. 2016;7:13043.