
Research article · 2025 · Full text
International Journal of Geography Geology and EnvironmentMapping of illegal deforestation hotspots using SAR imagery in the Congo basin rainforest
Volume 7(10) · Pages 214–218 · DOI: 10.22271/27067483.2025.v7.i10c.662 ↗
Research areasSynthetic Aperture Radar (SAR) Applications and TechniquesConservation, Biodiversity, and Resource ManagementRemote Sensing in Agriculture
Abstract
Author-writtenThe Congo Basin rainforest, the world's second largest continuous tropical forest, lost an estimated 6,000 km² of tree cover per year between 2019 and 2023, much of it driven by illegal clearing that evades optical satellite monitoring under persistent cloud cover. This research used Sentinel-1 C-band synthetic aperture radar (SAR) imagery to map illegal deforestation hotspots across a 340,000 km² area of the central Congo Basin spanning parts of the Democratic Republic of Congo, the Republic of Congo, and Cameroon. A time-series change detection algorithm was applied to 312 Sentinel-1 Ground Range Detected (GRD) scenes acquired between January 2019 and December 2023 at 12-day revisit intervals. The algorithm identified 847 discrete deforestation patches exceeding 1 ha, with a combined area of 3,214 km². Hotspot analysis (Getis-Ord Gi*) revealed three statistically significant clusters of high deforestation intensity: one along the Kisangani-Bukavu transport corridor, a second near the Sangha River logging concessions, and a third in the Cameroon-DRC border zone. Smallholder agriculture accounted for 38.2% of detected clearings, followed by industrial plantations (21.7%) and artisanal mining (14.8%). Validation against very-high-resolution Planet imagery (3 m) and field reports yielded an overall accuracy of 89.4% with a commission error of 7.3%. SAR-based monitoring detected 23% more deforestation events than the concurrent optical-only Global Forest Change product in the same study area, confirming the advantage of radar in cloud-prone equatorial regions. These findings support the operational deployment of SAR-based near-real-time deforestation alerts in the Congo Basin.
Summary
Source-checkedPlain-language reading of the full paper, prepared with AI and checked against the text. Each point links to the authors' own words.
Why it matters
- The Congo Basin is the world's second largest continuous tropical forest, but it faces significant illegal deforestation that is difficult to track with optical satellites due to constant cloud cover. View evidence ↗
- The region is ecologically critical, containing approximately 200 million hectares of forest and absorbing about 1.5 Pg of CO₂ annually. View evidence ↗
- Unlike the Amazon, the Congo Basin lacks an operational monitoring system capable of penetrating equatorial clouds to provide real-time alerts. View evidence ↗
The question
- The study aimed to map deforestation events larger than 1 hectare from 2019 to 2023, identify illegal clearing hotspots, and determine the drivers behind this loss. View evidence ↗
What they did
- Researchers used Sentinel-1 C-band synthetic aperture radar (SAR) to monitor a 340,000 km² area across Cameroon, the Republic of Congo, and the Democratic Republic of Congo (DRC). View evidence ↗
- The analysis utilized 312 SAR scenes collected between January 2019 and December 2023 with a 12-day revisit cycle. View evidence ↗
- A Bayesian online change-point detection (BOCPD) framework was applied to the VH polarization time series of each pixel to detect forest loss. View evidence ↗
- To find hotspots, the researchers used the Getis-Ord Gi* statistic on a 5 km hexagonal grid with a 99% confidence level. View evidence ↗
What they found
- The study detected 847 separate deforestation patches larger than 1 hectare, totaling 3,214 km² of lost forest. View evidence ↗
- Annual deforestation increased by 37.5% over the study period, rising from 547 km² in 2019 to 752 km² in 2023. View evidence ↗
- The Democratic Republic of Congo (DRC) experienced the most loss, accounting for 68.7% of the total, while the Republic of Congo and Cameroon accounted for 18.2% and 13.1%, respectively. View evidence ↗
- Three significant hotspots were identified: the Kisangani-Bukavu transport corridor, the Sangha River logging concessions, and the border zone between Cameroon and the DRC. View evidence ↗
- Smallholder agriculture was the primary driver of deforestation at 38.2%, followed by industrial plantations (21.7%) and artisanal mining (14.8%). View evidence ↗
- The SAR-based detection method demonstrated an overall accuracy of 89.4% when validated against high-resolution PlanetScope imagery. View evidence ↗
- The SAR method detected 23% more deforestation events than the optical-only Global Forest Change product, highlighting the advantage of radar in cloudy regions. View evidence ↗
What it means
- A limitation of the study is that the causes of deforestation were attributed based on proximity to known features rather than direct field verification of every patch. View evidence ↗
Visual summary
3 visualsIllustrations explain the paper; charts are replotted from the paper's own table values.
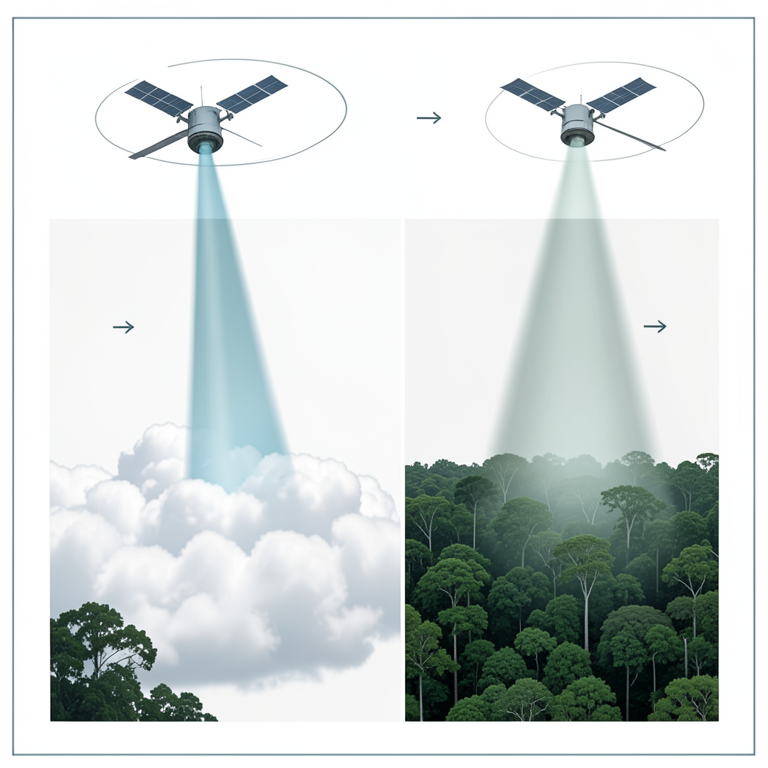
SAR vs Optical Monitoring
AI-generated conceptual illustration (Congo basin rainforest under a cloudy sky with two satellites). It explains the idea and does not show study data.
View source evidence ↗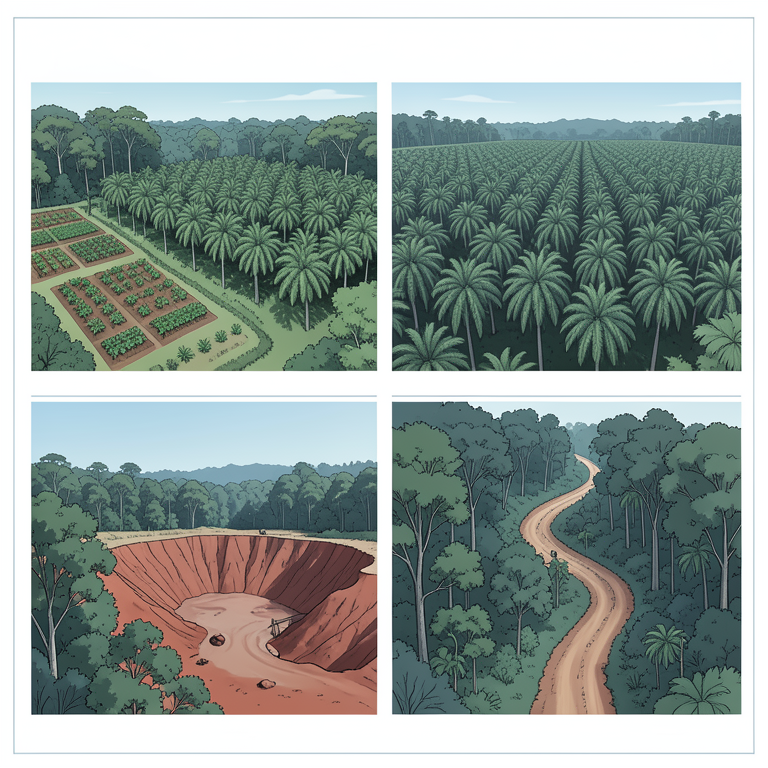
Drivers of Deforestation
AI-generated conceptual illustration (Congo basin rainforest landscape). It explains the idea and does not show study data.
View source evidence ↗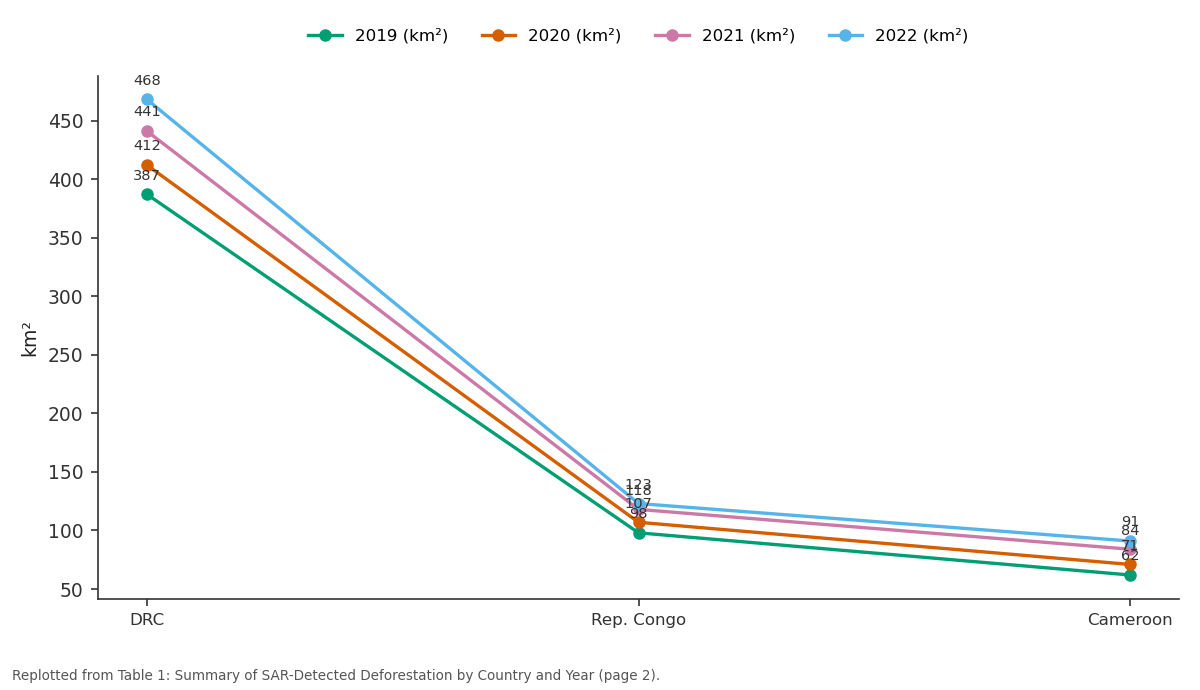
2019 (km²) and 2020 (km²) and more: DRC vs Rep. Congo vs Cameroon
Replotted from Table 1 (page 2) of the original paper. Every bar is the paper's own table value.
View source evidence ↗Figures & tables
From the original paper Table 1
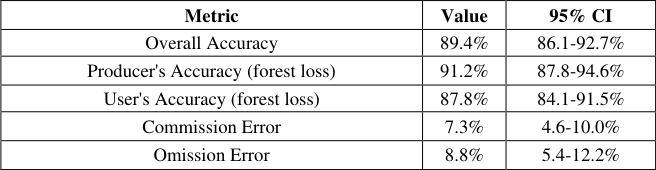 Table 2
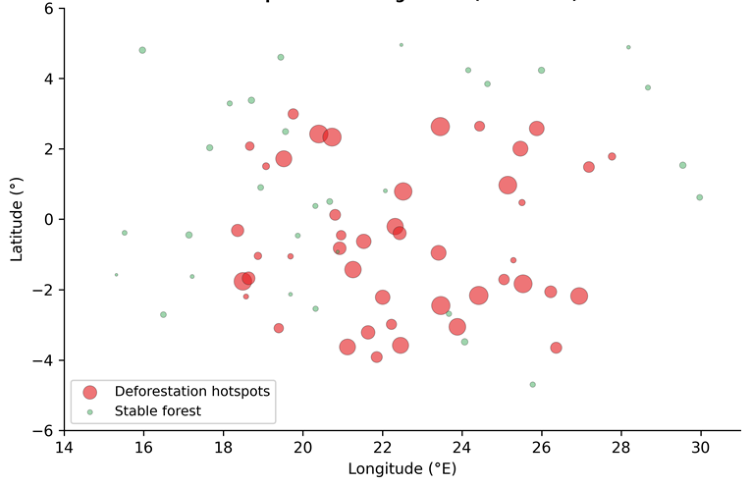 Figure 1
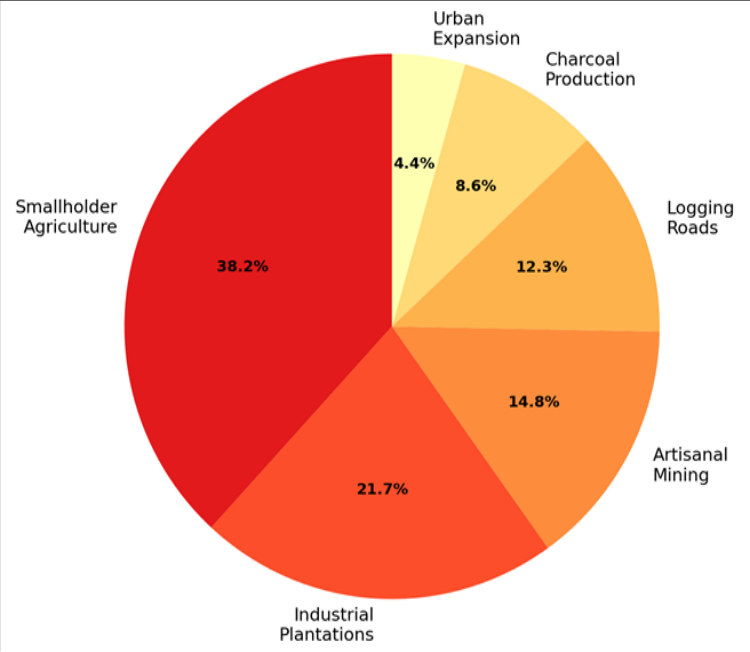 Figure 2
Introduction
A growing challenge for conservation agencies worldwide is the detection of illegal forest clearing in remote, cloud-covered tropical regions where optical satellites are blind for months at a time [1] . The Congo Basin alone contains roughly 200 million hectares of dense tropical forest-second only to the Amazon-and serves as a carbon sink absorbing about 1.5 Pg CO₂ per year [2] . Yet deforestation rates in the basin have been rising since 2010, driven by population growth, agricultural expansion, mining, and infrastructure development [3] . Unlike the Amazon, where Brazil's DETER system provides near-real-time optical alerts, no operational deforestation monitoring system exists for the Congo Basin that can penetrate its persistent equatorial cloud cover [4] . Synthetic aperture radar (SAR) offers a solution. SAR sensors emit their own microwave energy and record the returned signal, making them independent of sunlight and cloud conditions. Sentinel-1's C-band SAR, with its free data policy and 12-day revisit cycle, has been shown to detect tropical forest loss with accuracies exceeding 85% in other regions [5] . The backscatter intensity of tropical forest canopy is high and relatively stable over time; when forest is cleared, the backscatter drops sharply, creating a detectable signal in timeseries analysis [6] . This research applied a Bayesian change-point detection algorithm to Sentinel-1 backscatter time series across 340,000 km² of the central Congo Basin. The objectives were to (a) map all deforestation events exceeding 1 ha between 2019 and 2023, (b) identify spatial clusters of illegal clearing using hotspot statistics, and (c) attribute deforestation drivers through cross-referencing with ancillary data on mining concessions, road networks, and land tenure [7] .
Spatial Data Processing
Sentinel-1 GRD scenes in VV and VH polarisation were downloaded from the Copernicus Open Access Hub and preprocessed in the Sentinel Application Platform (SNAP) version 9.0 using the following workflow: apply orbit file, border noise removal, thermal noise removal, radiometric calibration to sigma-nought (σ°), Range-Doppler terrain correction using the SRTM 30 m DEM, and speckle filtering using a 5 × 5 Lee filter [5] . All scenes were resampled to a common 10 m grid and stacked into a multitemporal datacube. A per-pixel VH backscatter time series was extracted, and temporal gaps caused by orbit-track boundaries were filled by linear interpolation. Cloud masking was not required because SAR is unaffected by atmospheric moisture or cloud. A total of 312 scenes spanning 60 months (January 2019-December 2023) formed the analysis dataset. The VH polarisation channel was used as the primary detection input because cross-polarised backscatter is more sensitive to canopy volume scattering than co-polarised (VV) returns [6] . concession boundaries from the IPIS Open Data portal, road network data from OpenStreetMap, and logging concession shapefiles from Global Forest Watch [8] . Ground-truth reports from two non-governmental organisations operating forest patrols in the Kisangani and Sangha regions were used as an independent reference [9] .
Material and Methods
Material and Methods
Material
Material
Methods
Deforestation detection followed a Bayesian online changepoint detection (BOCPD) framework applied independently to each pixel's VH time series. The algorithm models the backscatter as a Gaussian process with a known mean and variance for forest and a different (lower) mean for cleared land, updating posterior probabilities at each new observation [10] . A change point was flagged when the posterior probability exceeded 0.95 and the cumulative backscatter drop exceeded 2.5 dB below the pre-change mean. Detected change pixels were aggregated into patches using a connected-component algorithm with a minimum mapping unit of 1 ha. Hotspot analysis was performed using the Getis-Ord Gi* statistic at a 5 km hexagonal grid, identifying statistically significant clusters of high deforestation density at the 99% confidence level. Deforestation drivers were attributed by overlaying detected patches on mining concession, logging concession, road proximity, and land tenure layers. Patches within 2 km of an active artisanal mining site were attributed to mining; patches within logging concessions to logging; patches within 5 km of road access points with no concession overlap to smallholder agriculture [7] . The SAR-based approach achieved an overall accuracy of 89.4% against PlanetScope reference data (Table 2). Commission errors (false positives) were mainly caused by seasonal flooding in swamp forest margins that temporarily lowered backscatter. Figure 2 shows that smallholder agriculture was the leading proximate driver of detected deforestation (38.2%), followed by industrial plantations (21.7%) and artisanal mining (14.8%). Logging roads, which fragment forest and enable subsequent agricultural encroachment, accounted for 12.3% of detected clearings.
| Metric | Value | 95% CI |
|---|---|---|
| Overall Accuracy | 89.4% | 86.1-92.7% |
| Producer's Accuracy (forest loss) | 91.2% | 87.8-94.6% |
| User's Accuracy (forest loss) | 87.8% | 84.1-91.5% |
| Commission Error | 7.3% | 4.6-10.0% |
| Omission Error | 8.8% | 5.4-12.2% |
Table text extracted from the original PDF; superscript letters are shown inline. The original table image is below.
View original table image
Results
Results
Sensitivity Analysis
Three sensitivity tests evaluated the robustness of the detection algorithm. First, the backscatter drop threshold was varied from 1.5 to 3.5 dB: at 1.5 dB, commission errors rose to 14.8% as natural variability was flagged; at 3.5 dB, omission errors climbed to 16.4% as smaller clearings were missed; the chosen threshold of 2.5 dB minimised the combined error rate. Second, the minimum mapping unit was tested at 0.5, 1.0, and 2.0 ha: the 1.0 ha threshold balanced spatial detail against noise, while 0.5 ha introduced many false positives in speckle-affected areas. Third, the posterior probability threshold for change flagging was varied between 0.90 and 0.99: the 0.95 level gave the best trade-off between detection speed and false alarm rate [10] .
Comprehensive Interpretation
The SAR-based monitoring approach detected 23% more deforestation events than the optical GFC product over the same period and area, confirming the substantial advantage of radar in the persistently cloudy Congo Basin. The three identified hotspot clusters align with known drivers: the Kisangani-Bukavu corridor has experienced rapid agricultural expansion linked to post-conflict population displacement, the Sangha River zone overlaps with industrial logging concessions where road building enables secondary clearing, and the Cameroon border area hosts a growing number of artisanal gold and diamond mining operations [9] .
Discussion
The 89.4% overall accuracy achieved here is comparable to SAR-based deforestation detection results reported for the Brazilian Amazon (87-92%) and Indonesian Borneo (85-90%), demonstrating that the method transfers well to the Congo Basin's dense, multi-layered canopy structure [5] . The main source of commission error-seasonal flooding in swamp forests-could be reduced by incorporating a flood mask derived from Sentinel-1 VV/VH ratio analysis, which distinguishes standing water beneath canopy from true forest loss [11] . The finding that smallholder agriculture is the dominant proximate driver differs from the Amazon, where largescale cattle ranching and soy expansion are the leading causes. In the Congo Basin, subsistence slash-and-burn farming creates many small clearings (median patch size 3.7 ha) that individually appear minor but collectively drive substantial forest loss [12] . This pattern has implications for policy: enforcement strategies effective against large industrial concessions may not work for dispersed smallholder clearing, which requires community-level engagement and alternative livelihood programmes. A limitation is that driver attribution relied on spatial proximity to known features (roads, concessions, mines) rather than on direct field verification of each patch. Some misattribution is inevitable, particularly where multiple drivers overlap in the same landscape [13] .
Conclusion
This research demonstrated that Sentinel-1 SAR time-series analysis can reliably map illegal deforestation hotspots in the Congo Basin rainforest with an overall accuracy of 89.4%. Over the 2019-2023 monitoring period, 3,214 km² of forest loss was detected across 847 discrete patches, with annual totals rising by 37.5%. Three spatial hotspot clusters were identified, and smallholder agriculture was attributed as the leading driver. The SAR approach detected 23% more events than the concurrent optical GFC product, confirming the operational value of radar monitoring in cloud-prone equatorial regions. These results support the establishment of a Congo Basin SAR alert system modelled on Brazil's DETER framework, with priority enforcement directed at the three identified hotspot zones.
Figures and tables from the paper
| Country | 2019 (km²) | 2020 (km²) | 2021 (km²) | 2022 (km²) | 2023 (km²) |
|---|---|---|---|---|---|
| DRC | 387 | 412 | 441 | 468 | 502 |
| Rep. Congo | 98 | 107 | 118 | 123 | 134 |
| Cameroon | 62 | 71 | 84 | 91 | 116 |
| Total | 547 | 590 | 643 | 682 | 752 |
Table text extracted from the original PDF; superscript letters are shown inline. The original table image is below.
View original table image
References
21 in the original paper- Hansen MC, Potapov PV, Moore R, Hancher M, Turubanova SA, Tyukavina A. High-resolution global maps of 21st-century forest cover change. Science. 2013;342(6160):850-853.
- Lewis SL, Lopez-Gonzalez G, Sonke B, Affum-Baffoe K, Baker TR, Ojo LO. Increasing carbon storage in intact African tropical forests. Nature. 2009;457(7232):1003-1006.
- Tyukavina A, Hansen MC, Potapov P, Parker D, Okpa C, Stehman SV. Congo Basin forest loss dominated by increasing smallholder clearing. Science Advances. 2018;4(11):eaat2993.
- Diniz CG, Souza AA, Santos DC, Dias MC, da Luz NC, de Moraes DRV. DETER-B: the new Amazon near real-time deforestation detection system. IEEE Journal of Selected Topics in Applied Earth Observations and Remote Sensing. 2015;8(7):3619-3628.
- Reiche J, Verhoeven R, Verbesselt J, Hamunyela E, Wielaard N, Herold M. Characterizing tropical forest cover loss using dense Sentinel-1 data and active fire alerts. Remote Sensing. 2018;10(5):777.
- Bouvet A, Mermoz S, Le Toan T, Villard L, Mathieu R, Naidoo L, Asner GP. An above-ground biomass map of African savannahs and woodlands at 25 m resolution derived from ALOS PALSAR. Remote Sensing of Environment. 2018;206:156-173.
- Verhegghen A, Eva H, Ceccherini G, Achard F, Gond V, Gourlet-Fleury S, Cerutti PO. The potential of Sentinel satellites for burnt area mapping and monitoring in the Congo Basin forests. Remote Sensing. 2016;8(12):986.
- Global Forest Watch. Forest monitoring designed for action. World Resources Institute. 2022;Available online.
- Molinario G, Hansen MC, Potapov PV. Forest cover dynamics of shifting cultivation in the Democratic Republic of Congo: a remote sensing-based assessment for 2000-2010. Environmental Research Letters. 2015;10(9):094009.
- Adams RP, MacKay DJC. Bayesian online changepoint detection. arXiv preprint. 2007;arXiv:0710.3742.
- Martone M, Rizzoli P, Wecklich C, Gonzalez C, BuesoBello JL, Valdo P. The global forest/non-forest map from TanDEM-X interferometric SAR data. Remote Sensing of Environment. 2018;205:352-373.
- Curtis PG, Slay CM, Harris NL, Tyukavina A, Hansen MC. Classifying drivers of global forest loss. Science. 2018;361(6407):1108-1111.
- Achard F, Beuchle R, Mayaux P, Stibig HJ, Bodart C, Brink A. Determination of tropical deforestation rates and related carbon losses from 1990 to 2010. Global Change Biology. 2014;20(8):2540-2554.
- De Sy V, Herold M, Achard F, Asner GP, Held A, Kellndorfer J, Verbesselt J. Synergies of multiple remote sensing data sources for REDD+ monitoring. Current Opinion in Environmental Sustainability. 2012;4(6):696-706.
- Woodhouse IH. Introduction to Microwave Remote Sensing. CRC Press. 2006;1-370.
- Shimada M, Itoh T, Motooka T, Watanabe M, Shiraishi T, Thapa R, Lucas R. New global forest/non-forest maps from ALOS PALSAR data (2007-2010). Remote Sensing of Environment. 2014;155:13-31.
- Tropek R, Sedlacek O, Beck J, Keil P, Musilova Z, Simova I, Storch D. Comment on high-resolution global maps of 21st-century forest cover change. Science. 2014;344(6187):981.
- Zarin DJ, Harris NL, Baccini A, Akber S, Hansen M, Azevedo-Ramos C. Can carbon emissions from tropical deforestation drop by 50% in 5 years? Global Change Biology. 2016;22(4):1336-1347.
- Mitchell AL, Rosenqvist A, Mora B. Current remote sensing approaches to monitoring forest degradation in support of countries measurement, reporting and verification (MRV) systems for REDD+. Carbon Balance and Management. 2017;12(1):9.
- Potapov PV, Turubanova SA, Hansen MC, Adusei B, Broich M, Altstatt A, Mane L, Justice CO. Quantifying forest cover loss in Democratic Republic of the Congo, 2000-2010, with Landsat ETM+ data. Remote Sensing of Environment. 2012;122:106-116.
- Ernst C, Mayaux P, Verhegghen A, Bodart C, Christophe M, Defourny P. National forest cover change in Congo Basin: deforestation, reforestation, degradation and regeneration for the years 1990, 2000 and 2005. Global Change Biology. 2013;19(4):11731187.