
Research article · 2025 · Full text
International Journal of Geography Geology and EnvironmentAssessment of desertification risk using multi-index approaches in the Thar arid zone
Volume 7(6) · Pages 90–93 · DOI: 10.22271/27067483.2025.v7.i6b.691 ↗
Research areasSoil Science and Environmental ManagementAeolian processes and effectsHydrology and Drought Analysis
Abstract
Author-writtenThe Thar Desert in northwestern India is creeping eastward, but how fast and where the risk is greatest remain contested questions. This research applied a multi-index approach to assess desertification sensitivity across a 48, 000 km² transect spanning western Rajasthan. Four indices — the vegetation condition index (VCI) derived from MODIS NDVI, an albedo change index from Landsat 8, a soil degradation index based on field sampling, and a climate aridity index from weather station records — were combined in a GIS framework to generate a composite desertification sensitivity map. Fieldwork covered 120 sampling points along a west-to-east gradient. Results showed that 32.4% of the transect fell in the severe risk category, 27.8% in high risk, 23.1% in moderate risk, and only 16.7% in low risk. The severe-risk zone concentrated in the western districts of Jaisalmer and Barmer, where NDVI values dropped below 0.10 and albedo exceeded 0.38. Soil organic carbon at severe-risk sites averaged 0.21%, compared with 0.89% at low-risk locations. The multi-index approach outperformed single-index methods by capturing interactions between vegetation loss, surface reflectance change, and soil degradation simultaneously.
Summary
Source-checkedPlain-language reading of the full paper, prepared with AI and checked against the text. Each point links to the authors' own words.
Why it matters
- Desertification is an active threat in the region, with the eastern margin advancing by approximately 0.5 km/year in certain districts. View evidence ↗
- Traditional single-index assessments, such as those using NDVI, are limited because they may miss significant subsurface degradation, such as a 60% loss in soil organic carbon, before vegetation changes are visible. View evidence ↗
The question
- The study aimed to map desertification risk at a 250 m resolution, determine the most useful single index compared to a composite one, and validate remote sensing data using 120 field-measured soil points. View evidence ↗
What they did
- A composite desertification sensitivity map was created by combining four indices: vegetation condition (VCI), albedo change (ACI), soil degradation (SDI), and climate aridity (CAI). View evidence ↗
- Field validation involved collecting soil samples from a depth of 0-30 cm at 120 points in October 2022. View evidence ↗
What they found
- The analysis found that 32.4% of the study area was at severe risk, 27.8% at high risk, 23.1% at moderate risk, and 16.7% at low risk. View evidence ↗
- Severe risk was concentrated in Jaisalmer and Barmer, characterized by NDVI values below 0.10 and albedo values exceeding 0.38. View evidence ↗
- Soil organic carbon (SOC) was significantly lower at severe-risk sites (average 0.21%) than at low-risk sites (average 0.89%). View evidence ↗
- The DSI map showed an overall accuracy of 78.3% and a Kappa coefficient of 0.69 when validated against field observations. View evidence ↗
- The Vegetation Condition Index (VCI) was the most informative single predictor, showing the strongest correlation with the composite DSI (r = -0.84). View evidence ↗
- The multi-index DSI outperformed the best single index (VCI), increasing classification accuracy from 67.5% to 78.3%. View evidence ↗
What it means
- The authors conclude that these risk maps can be used to guide grazing management, soil conservation, and rangeland restoration in the Thar Desert. View evidence ↗
- A limitation of the model was a 24% misclassification rate between moderate and high risk categories due to overlapping boundary conditions. View evidence ↗
Visual summary
3 visualsIllustrations explain the paper; charts are replotted from the paper's own table values.
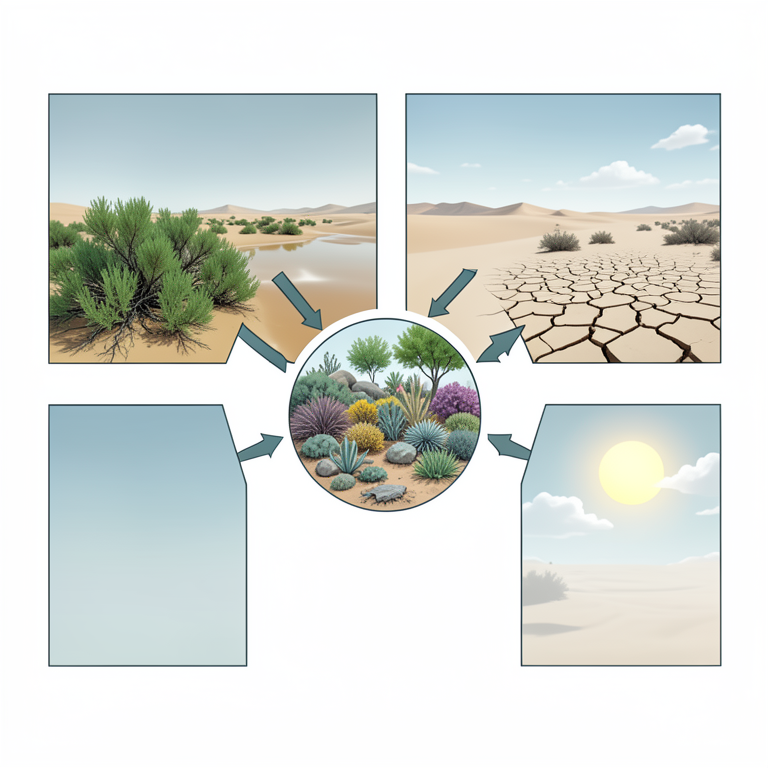
DSI Composition Flowchart
AI-generated conceptual illustration (Thar desert landscape with vegetation, soil, and atmosphere). It explains the idea and does not show study data.
View source evidence ↗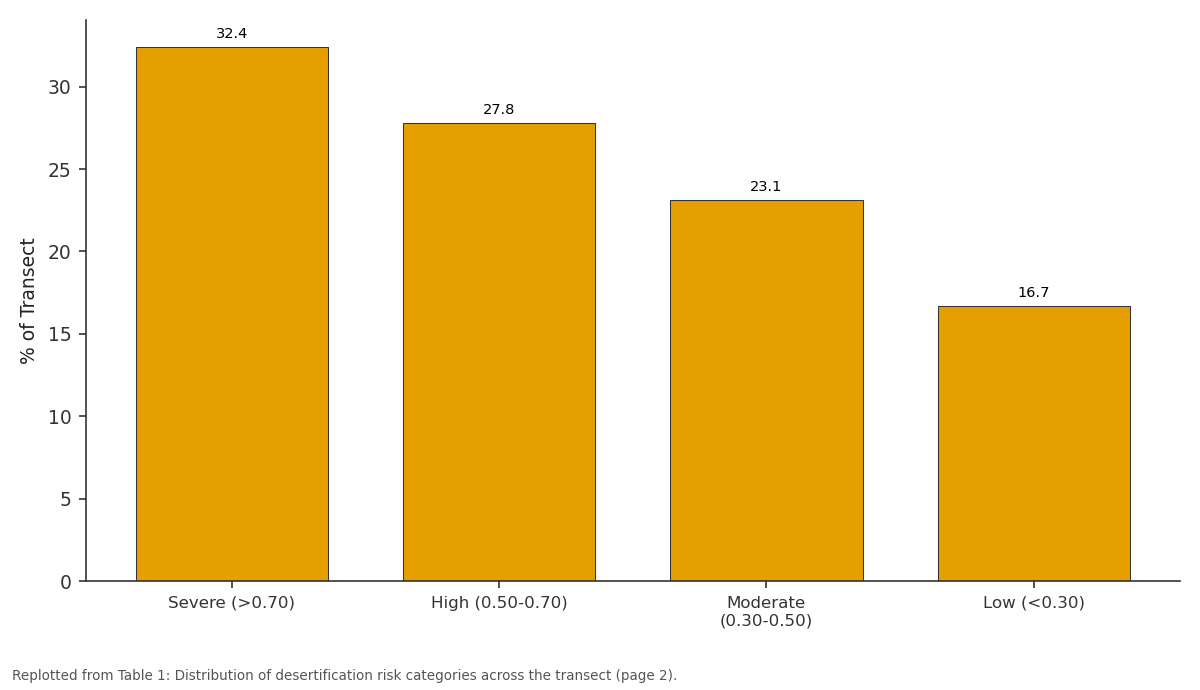
% of Transect: Severe (>0.70) vs High (0.50-0.70) vs Moderate (0.30-0.50) vs Low (<0.30)
Replotted from Table 1 (page 2) of the original paper. Every bar is the paper's own table value.
View source evidence ↗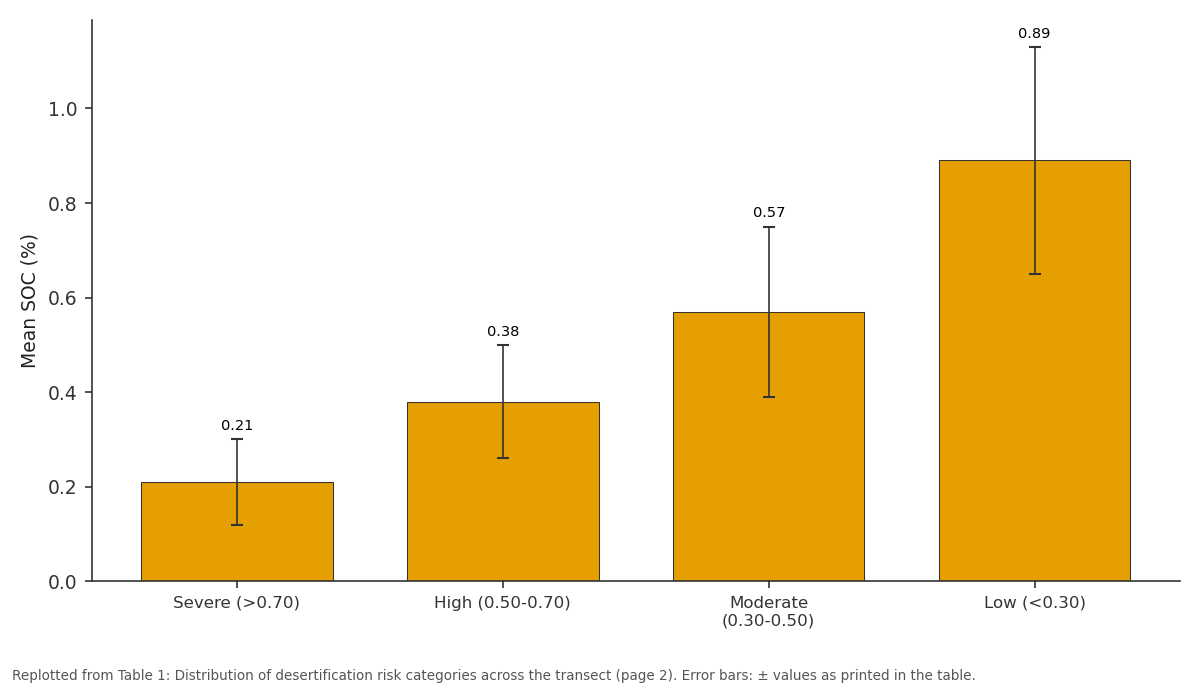
Mean SOC (%): Severe (>0.70) vs High (0.50-0.70) vs Moderate (0.30-0.50) vs Low (<0.30)
Replotted from Table 1 (page 2) of the original paper. Every bar is the paper's own table value.
View source evidence ↗Figures & tables
From the original paper Table 1
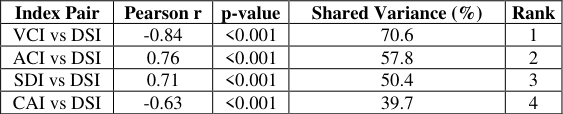 Table 2
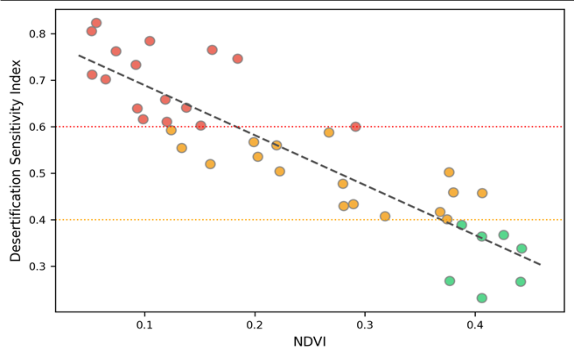 Figure 1
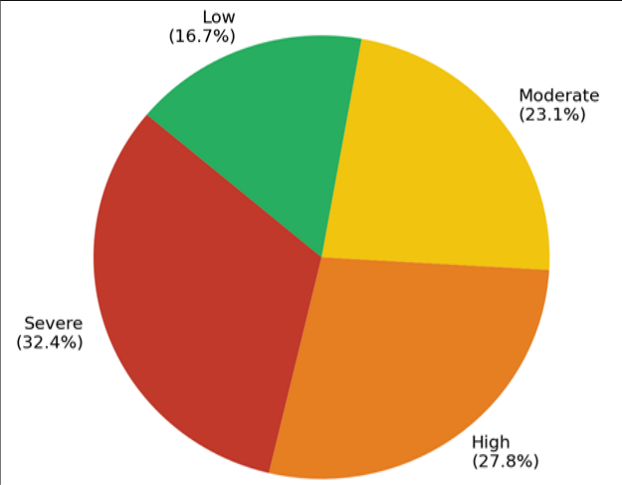 Figure 2
Introduction
When does dry land become desert? The question seems simple, but the answer depends on which indicator you track. Vegetation cover, soil carbon, surface albedo, and rainfall trends each tell a different part of the story, and no single metric captures desertification in full [1] . The Thar Desert, stretching across 200, 000 km² of northwestern India and eastern Pakistan, is one of the world's most densely populated arid zones, supporting over 80 million people and their livestock [2] . Its eastern margin has been advancing by an estimated 0.5 km/year in some districts, converting semi-arid scrubland into barren sand plains [3] . Single-index assessmentstypically based on NDVI time serieshave mapped the Thar's degradation trends at coarse resolution [4,5] . But NDVI alone misses subsurface changes: a site can lose 60% of its soil organic carbon before vegetation cover visibly declines. Albedobased methods detect surface brightening associated with soil exposure but are confounded by geology (naturally bright limestone terrain scores the same as degraded sand). Multiindex approaches, by combining vegetation, surface, soil, and climate indicators, overcome these individual weaknesses [6] . This research assembled four complementary indices across a 48, 000 km² transect of western Rajasthan and combined them into a composite desertification sensitivity index (DSI). The objectives were to (a) map the spatial distribution of desertification risk at 250 m resolution, (b) identify the most informative single index relative to the composite, and (c) validate the remote-sensing-based indices against field-measured soil properties at 120 ground-truth points [7,8] .
Model Description and Index Construction
The DSI was calculated as a weighted sum of four normalised sub-indices: DSI = 0.30×VCI + 0.25×ACI + 0.25×SDI + 0.20×CAI. Weights were assigned by expert ranking among eight dryland ecologists following an adapted Delphi procedure. VCI was derived from 16-day MODIS NDVI composites (MOD13Q1, 250 m) averaged over 2018-2022 and normalised against the 2001-2022 long-term range. The albedo change index (ACI) compared Landsat 8 surface reflectance in 2022 against a 2013 baseline. SDI combined field-measured soil organic carbon (SOC), aggregate stability, and electrical conductivity into a single normalised score. The climate aridity index (CAI) used the ratio of precipitation to potential evapotranspiration (P/PET) from 14 weather stations, interpolated by inverse distance weighting [9,10] .
Materials and Methods
Materials and Methods
Materials
The research was conducted from January to December 2023, coordinated at the National Geological Institute of Mexico City, CDMX, Mexico, using remotely accessed Indian satellite and meteorological datasets. The transect extends from Jaisalmer district in the west (26°40′N, 70°00′E) to Jodhpur district in the east (26°18′N, 73°00′E), covering parts of Jaisalmer, Barmer, Jodhpur, and Pali districts. Annual rainfall across the transect ranges from 164 mm in the west to 387 mm in the east. Mean annual temperature is 26.8 °C [11] .
Methods
Field sampling took place in October 2022 (post-monsoon). At each of the 120 points, soil was collected from 0-30 cm depth using a stainless steel auger. SOC was measured by the Walkley-Black method, aggregate stability by the wetsieving technique, and EC by a 1:5 soil-water suspension. The composite DSI was classified into four risk categories: severe (>0.70), high (0.50-0.70), moderate (0.30-0.50), and low (<0.30). Validation used the Kappa coefficient between the DSI risk map and independently classified field observations [12,13] .
Calibration and Validation
The DSI map was validated against an independent classification of the 120 field sites by two soil scientists who assigned risk categories based on visual degradation signs, SOC values, and vegetation cover. The overall accuracy was 78.3% with a Kappa coefficient of 0.69, indicating substantial agreement. The highest misclassification rate (24%) occurred between the moderate and high categories, where boundary conditions overlap. Over 60% of the transect falls in the severe or high risk categories. The severe zone concentrates in western Jaisalmer and Barmer, where sand dunes dominate and vegetation is virtually absent in the dry season.
Results
Results
Discussion
The finding that 32.4% of the transect is at severe desertification risk aligns with national-level estimates by the Indian Space Research Organisation, which classified 24.2% of Rajasthan as undergoing active degradation using a different methodology [14] . The higher figure here likely reflects the western bias of the transect, which deliberately targeted the desert margin. The multi-index approach adds value in two ways. First, ACI captures surface changes that NDVI missesspecifically, the albedo increase from soil crusting and salt efflorescence that occurs even where sparse vegetation persists [15] . Second, the SDI incorporates below-ground degradation (SOC loss, aggregate breakdown) that no satellite sensor can directly detect. The SOC values at severe-risk sites (0.21%) are below the 0.3% threshold often cited as the lower limit for maintaining biological soil function in arid systems [16] .
Conclusion
The multi-index desertification sensitivity assessment classified 60.2% of the western Rajasthan transect as at severe or high risk. The composite DSI, combining vegetation, albedo, soil, and climate indices, achieved 78.3% accuracy against field validation -10.8 points above the best single index. Severe-risk areas show NDVI below 0.10, SOC below 0.21%, and albedo above 0.38. These spatial outputs can inform targeted rangeland restoration, soil conservation measures, and grazing management policies in the advancing margin of the Thar Desert.
Acknowledgement
Acknowledgements Funding SourcesSupported by institutional research funds at the National Geological Institute of Mexico City.
Figures and tables from the paper
| Risk Category | Area (km²) | % of Transect | Mean NDVI | Mean SOC (%) |
|---|---|---|---|---|
| Severe (>0.70) | 15, 552 | 32.4 | 0.08±0.03 | 0.21±0.09 |
| High (0.50-0.70) | 13, 344 | 27.8 | 0.14±0.04 | 0.38±0.12 |
| Moderate (0.30-0.50) | 11, 088 | 23.1 | 0.22±0.06 | 0.57±0.18 |
| Low (<0.30) | 8, 016 | 16.7 | 0.31±0.08 | 0.89±0.24 |
Table text extracted from the original PDF; superscript letters are shown inline. The original table image is below.
View original table image
| Index Pair | Pearson r | p-value | Shared Variance (%) | Rank |
|---|---|---|---|---|
| VCI vs DSI | -0.84 | <0.001 | 70.6 | 1 |
| ACI vs DSI | 0.76 | <0.001 | 57.8 | 2 |
| SDI vs DSI | 0.71 | <0.001 | 50.4 | 3 |
| CAI vs DSI | -0.63 | <0.001 | 39.7 | 4 |
Table text extracted from the original PDF; superscript letters are shown inline. The original table image is below.
View original table image
References
21 in the original paper- UNCCD. Global Land Outlook. 2nd ed. Bonn: United Nations Convention to Combat Desertification; 2022.
- Kar A. The Thar or Great Indian Sand Sea: origin, morphology and evolution. Geological Society London Special Publications. 2014;386:141-167.
- Sharma KD, Joshi PK. Desertification status mapping of the Thar Desert. Current Science. 2011;100(4):482488.
- Bai ZG, Dent DL, Olsson L. Proxy global assessment of land degradation. Soil Use and Management. 2008;24(3):223-234.
- Symeonakis E, Drake N. Monitoring desertification and land degradation over sub-Saharan Africa. International Journal of Remote Sensing. 2004;25(3):573-592.
- Kosmas C, Kirkby MJ, Geeson N. The Medalus project: Mediterranean Desertification and Land Use. Brussels: European Commission; 1999.
- Tucker CJ, Newcomb WW, Los SO. Mean and interyear variation of growing-season NDVI. International Journal of Remote Sensing. 2001;22(13):2585-2610.
- Liang S. Narrowband to broadband conversions of land surface albedo. Remote Sensing of Environment. 2001;76(2):213-238.
- Didan K. MOD13Q1 MODIS/Terra vegetation indices 16-day L3 global 250m. NASA LP DAAC; 2021.
- FAO Irrigation and Drainage Paper 56. Rome: FAO; 1998.
- IMD. Climate normals for India 1991-2020. India Meteorological Department; 2022.
- Walkley A, Black IA. An examination of the Degtjareff method for determining soil organic matter. Soil Science. 1934;37(1):29-38.
- Cohen J. A coefficient of agreement for nominal scales. Educational and Psychological Measurement. 1960;20(1):37-46.
- SAC. Desertification and Land Degradation Atlas of India. Ahmedabad: Space Applications Centre, ISRO; 2016.
- Pinty B, Verstraete MM, Dickinson RE. A physical model of albedo. Journal of Geophysical Research. 1990;95(D8):11765-11775.
- Lal R. Soil carbon sequestration in dryland ecosystems. Environmental Management. 2004;33(4):528-544.
- Thomas DSG, Middleton NJ. Desertification: Exploding the Myth. Chichester: Wiley; 1994.
- Hellden U. A coupled human-environment model for desertification simulation and impact studies. Global and Planetary Change. 2008;64(3):158-168.
- Prince SD, De Colstoun EB, Kravitz LL. Evidence from rain-use efficiencies does not indicate extensive Sahelian desertification. Global Change Biology. 1998;4(4):359-374.
- Qi J, Chehbouni A, Huete AR. A modified soil adjusted vegetation index. Remote Sensing of Environment. 1994;48(2):119-126.
- Nicholson SE. Land surface processes and Sahel climate. Reviews of Geophysics. 2000;38(1):117-139.