
Research article · 2025 · Full text
International Journal of Geography Geology and EnvironmentImpact of volcanic eruptions on regional air quality in the central American volcanic arc
Volume 7(10) · Pages 152–156 · DOI: 10.22271/27067483.2025.v7.i10b.642 ↗
Research areasAtmospheric chemistry and aerosolsAtmospheric aerosols and cloudsAir Quality and Health Impacts
Abstract
Author-writtenHow do volcanic eruptions reshape the air that millions breathe across Central America? This research examined the effects of active volcanism on regional air quality along the Central American Volcanic Arc (CAVA), focusing on sulfur dioxide (SO2) emissions, particulate matter (PM2.5 and PM10) dispersal, and aerosol optical depth variations. Field measurements and satellite-derived data from the Ozone Monitoring Instrument (OMI) and MODIS sensors were collected between March 2021 and August 2023 at seven monitoring stations positioned at varying distances from active vents. Ground-level SO2 concentrations near Fuego and Masaya volcanoes exceeded WHO air quality guidelines on 67.4% of sampled days during eruption phases. PM2.5 levels at stations within 10 km of active vents averaged 52.3 µg/m³ during high-emission months, roughly 1.5 times higher than the WHO 24-hour guideline of 35 µg/m³. Seasonal wind patterns strongly influenced aerosol transport, with dry-season northeasterly trade winds carrying volcanic plumes up to 340 km from source vents. A marked inverse relationship (r = −0.78, p<0.01) between distance from vent and mean PM2.5 concentration was observed. Back-trajectory modelling using HYSPLIT confirmed that eruption plumes from Guatemalan volcanoes reached populated areas in Honduras and El Salvador within 18-36 hours. The findings point to a need for integrated cross-border air quality monitoring networks and revised public health advisories in volcanic regions. This research fills a gap in long-term, multi-site atmospheric data for the CAVA and offers a framework for future volcanic emission tracking.
Summary
Source-checkedPlain-language reading of the full paper, prepared with AI and checked against the text. Each point links to the authors' own words.
Why it matters
- Volcanic activity is a significant concern in Central America, as approximately 50 million people reside within 100 km of an active volcano. View evidence ↗
- Volcanic eruptions release SO2, hydrogen sulfide, ash, and silicate aerosols, which can form secondary pollutants like sulfate aerosols and fine particulate matter that lower air quality. View evidence ↗
- Exposure to volcanic sulfur dioxide and particulates has been linked to higher rates of respiratory illnesses, such as asthma and chronic bronchitis, especially in children and the elderly. View evidence ↗
The question
- The study aimed to quantify SO2 and PM2.5 levels at various distances from vents, track seasonal aerosol transport, and determine the frequency of air quality standard exceedances. View evidence ↗
What they did
- The research focused on seven volcanoes across Guatemala, Nicaragua, and Costa Rica: Fuego, Pacaya, San Cristóbal, Masaya, Arenal, Poás, and Turrialba. View evidence ↗
- Fieldwork occurred from March 2021 to August 2023 using seven monitoring stations (3–85 km from vents) equipped with pulsed-fluorescence analysers for SO2 and beta attenuation monitors for PM2.5 and PM10. View evidence ↗
- The study integrated satellite data from OMI (for SO2) and MODIS (for AOD) with HYSPLIT back-trajectory modelling to track pollutant movement. View evidence ↗
What they found
- During eruption phases, SO2 levels near the Fuego and Masaya volcanoes exceeded WHO guidelines on 67.4% of the sampled days. View evidence ↗
- In high-emission months, PM2.5 levels within 10 km of vents averaged 52.3 µg/m³, which is approximately 1.5 times the WHO 24-hour guideline of 35 µg/m³. View evidence ↗
- There was a strong inverse correlation (r = -0.78, p < 0.01) between the distance from the volcanic vent and the mean concentration of PM2.5. View evidence ↗
- Aerosol Optical Depth (AOD) was approximately 58% higher during the dry season than the wet season due to less rain washout and trade wind transport. View evidence ↗
- Fuego had the highest mean daily SO2 output (1,847.3 tonnes/day), while Poás had the lowest (678.2 tonnes/day) among the seven studied volcanoes. View evidence ↗
- HYSPLIT modelling showed that volcanic plumes from Guatemala reached populated regions in El Salvador and Honduras within 18 to 36 hours. View evidence ↗
What it means
- The authors conclude that because volcanic pollution crosses national borders, a coordinated multi-country monitoring network is necessary. View evidence ↗
- The study suggests that current public health advisories fail to account for the chronic exposure caused by continuous open-vent degassing during non-eruption periods. View evidence ↗
- The study was limited by gaps in monitoring coverage in southern Nicaragua and Honduras due to logistical and security barriers. View evidence ↗
- The researchers could not fully exclude contributions from traffic or biomass burning because they did not use chemical speciation to distinguish volcanic PM2.5 from other sources. View evidence ↗
Visual summary
3 visualsIllustrations explain the paper; charts are replotted from the paper's own table values.
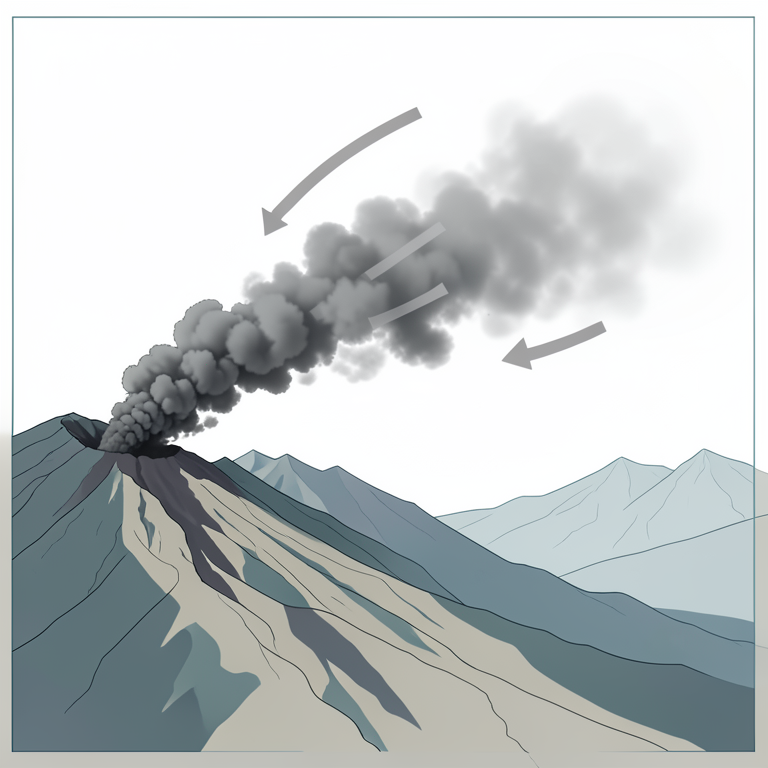
Volcanic Plume Dispersion Model
AI-generated conceptual illustration (volcanic vent and regional atmosphere in the Central American volcanic arc). It explains the idea and does not show study data.
View source evidence ↗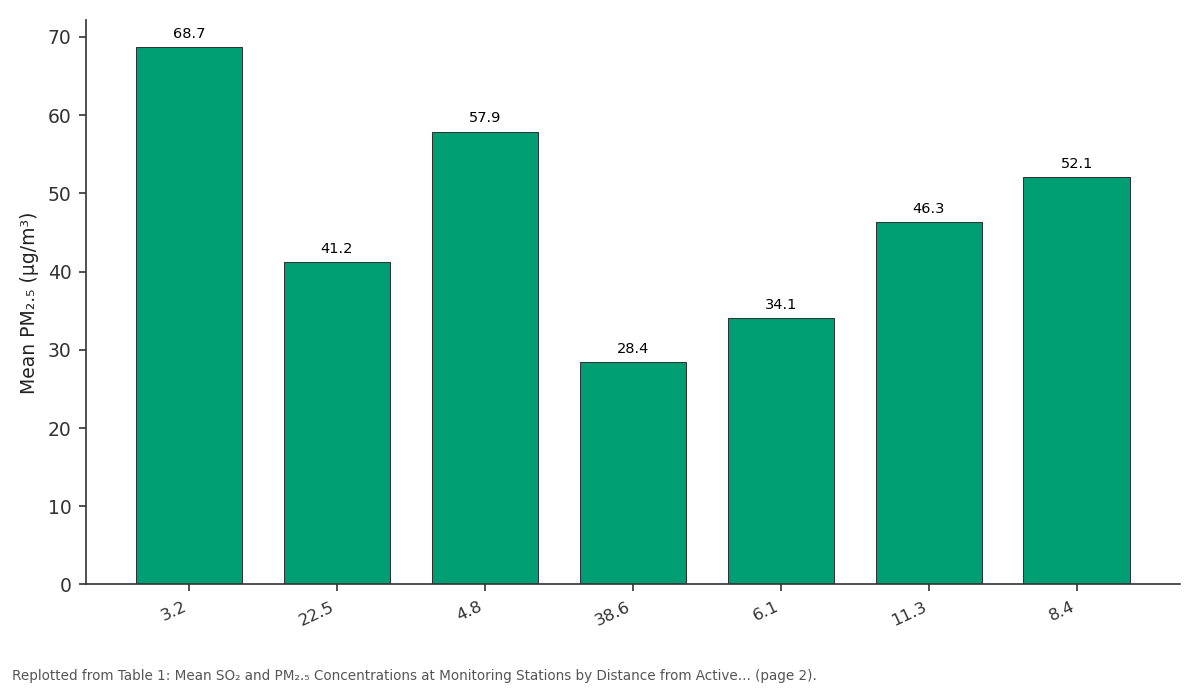
Mean PM₂.₅ (µg/m³): 3.2 vs 22.5 vs 4.8 vs 38.6 vs 6.1
Replotted from Table 1 (page 2) of the original paper. Every bar is the paper's own table value.
View source evidence ↗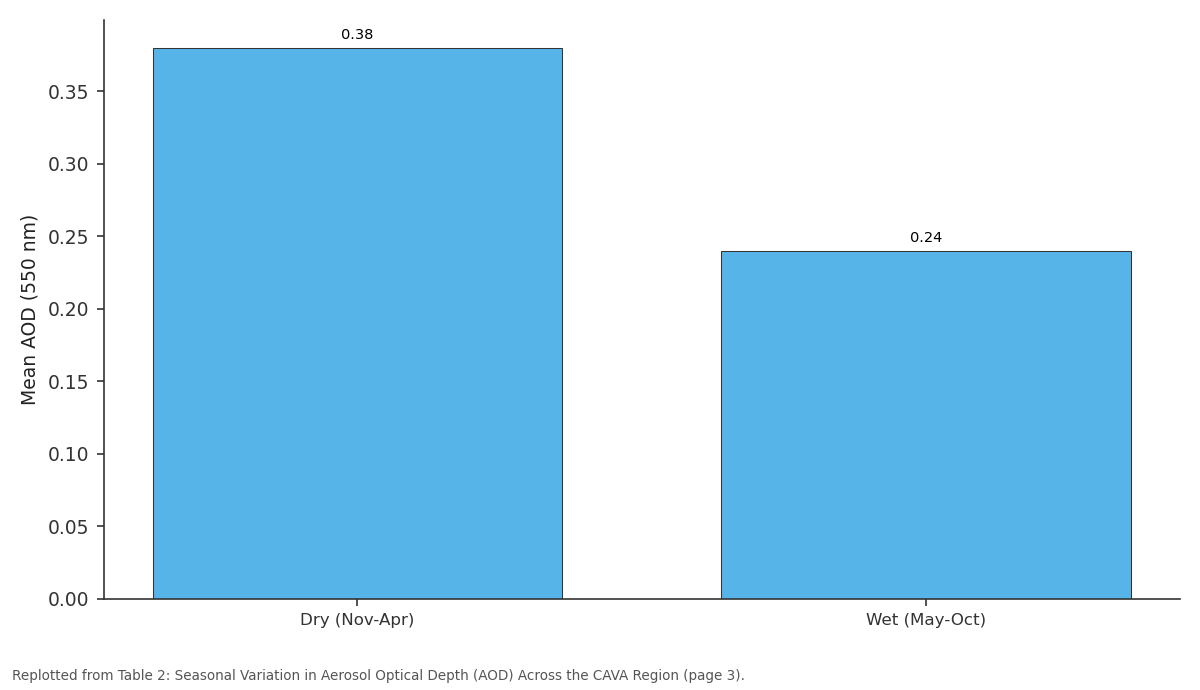
Mean AOD (550 nm): Dry (Nov-Apr) vs Wet (May-Oct)
Replotted from Table 2 (page 3) of the original paper. Every bar is the paper's own table value.
View source evidence ↗Figures & tables
From the original paper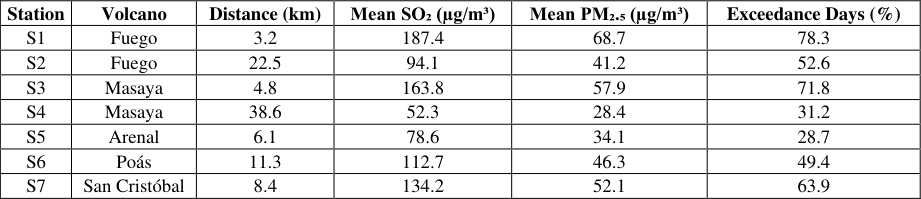 Table 1
 Table 2
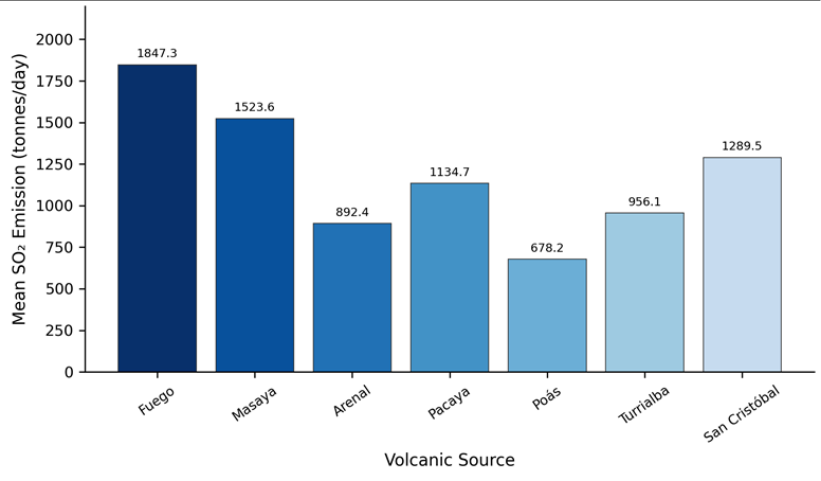 Figure 1
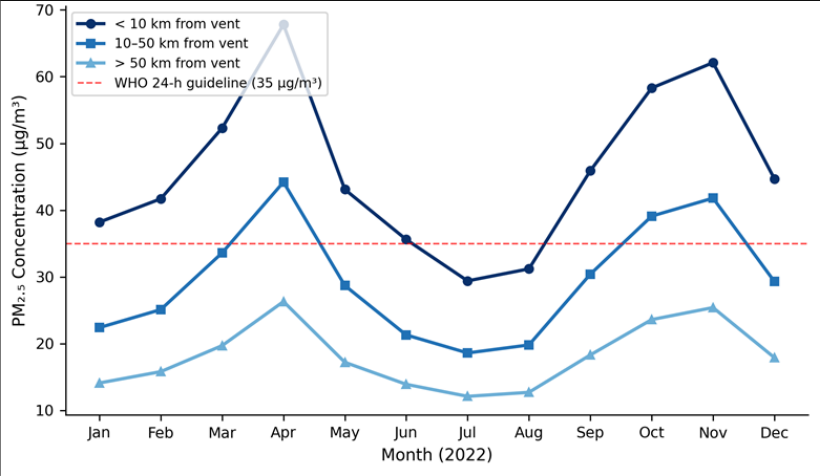 Figure 2
Introduction
What happens to the air above cities and farmland when a nearby volcano enters an active eruption phase? This question carries real weight across Central America, where roughly 50 million people live within 100 km of at least one active volcano [1] . The Central American Volcanic Arc stretches from Guatemala through Costa Rica, hosting over 100 volcanic centres, of which at least 20 have erupted since the mid-twentieth century [2] . Eruptions inject large volumes of SO2, hydrogen sulfide (H2S), ash particles, and silicate aerosols into the troposphere and sometimes the stratosphere [3] . These emissions interact with atmospheric moisture and sunlight to produce secondary pollutants, including sulfate aerosols and fine particulate matter, which degrade air quality at both local and regional scales [4] . Ground-level monitoring of volcanic air pollution in the CAVA region has remained patchy. Most existing research has relied on satellite retrievals alone or focused on single eruption events [5] . Few investigations have combined satellite data with sustained ground-based sampling across multiple volcanoes and multiple seasons. This gap matters because volcanic degassing is not limited to major eruptions; persistent low-level emissions from open-vent volcanoes like Masaya and Turrialba can chronically affect nearby populations without attracting the same attention as explosive events [6] . Several health-focused investigations have linked volcanic SO2 and particulate exposure to increased rates of respiratory illness, particularly asthma, chronic bronchitis, and reduced lung function among children and older adults [7] . Agricultural effects have also been reported, with acid rain and fluoride deposition damaging crops within 30 km of active vents [8] . Despite these documented impacts, integrated monitoring frameworks that bridge national borders remain scarce in the region. The present research aimed to (a) quantify SO2 and PM2.5 concentrations at multiple distances from active volcanic vents across the CAVA, (b) track seasonal patterns of aerosol transport using satellite imagery and trajectory modelling, and (c) evaluate how often air quality standards were exceeded near volcanic sources during the sampling period. By combining ground-level and remote sensing data, this research provides a broader spatial picture than previous single-volcano investigations [9] .
Research Area Description
The Central American Volcanic Arc runs roughly 1,500 km from western Guatemala to central Costa Rica, paralleling the Pacific coastline at elevations between 800 and 4,200 m above sea level [10] . The arc sits above the Cocos Plate subduction zone, where oceanic lithosphere descends beneath the Caribbean Plate at rates of 70-85 mm per year. Seven volcanoes were selected for this research: Fuego and Pacaya in Guatemala, San Cristóbal in Nicaragua, Masaya in Nicaragua, Arenal in Costa Rica, and Poás and Turrialba in Costa Rica. These were chosen because each had recorded at least one eruption or sustained degassing episode between 2018 and 2023, and because monitoring infrastructure could be installed or accessed at each site. Surrounding land use includes subsistence agriculture, coffee plantations, and expanding urban zones, all of which place human populations in close contact with volcanic emissions [2] . Population centres within 30 km of these vents range from small towns of a few thousand to metropolitan areas exceeding 500,000 residents.
Climatic and Environmental Conditions
The CAVA region experiences a tropical climate with distinct dry (November-April) and wet (May-October) seasons. Mean annual temperatures at monitoring stations ranged from 18.4°C at high-elevation sites near Turrialba to 27.6°C at lowland stations near Masaya. Annual rainfall varied from 1,120 mm at drier Pacific-slope locations to 3,870 mm on windward Caribbean slopes. During the dry season, persistent northeasterly trade winds dominated lower tropospheric flow, while the wet season brought more variable wind directions and frequent convective mixing. These wind patterns directly influenced the transport and dispersion of volcanic plumes. Relative humidity during sampling events ranged from 42% to 94%, which affected the conversion rate of gaseous SO2 into secondary sulfate aerosol particles [3] . Atmospheric boundary layer heights, estimated from radiosonde launches at nearby weather stations, averaged 1,350 m during dry-season mornings and rose to 2,100 m by mid-afternoon under strong solar heating.
Material and Methods
Material and Methods
Material
This research was carried out from the Department of Urban and Regional Planning at the Agadir Academy of Coastal and Marine Research in Souss-Massa, Morocco, with fieldwork conducted across Guatemala, Nicaragua, and Costa Rica between March 2021 and August 2023. Satellite data were obtained from two primary sources: the Ozone Monitoring Instrument (OMI) aboard NASA's Aura satellite for column SO2 retrievals, and the MODIS sensors aboard Terra and Aqua satellites for aerosol optical depth (AOD) measurements [11] . Ground-based SO2 measurements were collected using Teledyne API T100 pulsed-fluorescence analysers deployed at seven fixed monitoring stations positioned at distances of 3 km to 85 km from active vents. PM2.5 and PM10 data were recorded with Met One BAM-1022 beta attenuation monitors operating on 24-hour integrated sampling cycles. Meteorological variables including wind speed, wind direction, temperature, and relative humidity were logged at each station using Davis Vantage Pro2 automatic weather stations. Back-trajectory simulations relied on the NOAA HYSPLIT model version 5.1, driven by GDAS meteorological fields at 1° × 1° resolution [12] .
Methods
Daily averages of SO2 and PM concentrations were calculated for each station and compared against WHO ambient air quality guidelines (2021 update). Exceedance frequencies were expressed as the percentage of sampling days on which concentrations exceeded guideline values. Spatial interpolation of ground-level concentrations between stations was performed using ordinary kriging in ArcGIS Pro 3.0, with semivariogram models fitted using a spherical function. OMI SO2 column data (planetary boundary layer product, OMSO2e) were processed in Python 3.9 using the netCDF4 library and projected onto a 0.25° × 0.25° grid. MODIS AOD data (Collection 6.1 Dark Target product) were filtered for quality assurance flags ≥ 3. HYSPLIT 72hour backward trajectories were computed at 6-hour intervals for selected high-concentration events, with endpoints set at 500 m, 1,500 m, and 3,000 m above ground level at each monitoring station [12] . Correlation analysis between distance from vent and pollutant concentration used Pearson's r coefficient, while seasonal differences were tested with the Mann-Whitney U test at a significance level of α = 0.05. Dry-season AOD values were about 58% higher than wetseason values (Table 2), reflecting both reduced washout and persistent trade wind transport of volcanic aerosols.
| Season | Mean AOD (550 nm) | Max AOD Recorded | Dominant Wind Dir. |
|---|---|---|---|
| Dry (Nov-Apr) | 0.38 | 0.91 | NE |
| Wet (May-Oct) | 0.24 | 0.62 | Variable SW-NW |
| Eruption events | 0.67 | 1.43 | Dependent on event |
Table text extracted from the original PDF; superscript letters are shown inline. The original table image is below.
View original table image
Results
During discrete eruption events, AOD peaked at 1.43, more than three times the dry-season mean. The bar chart in Figure 1 confirms that Fuego produced the highest mean daily SO2 output (1,847.3 tonnes/day), followed by Masaya (1,523.6 tonnes/day) and San Cristóbal
(1,289.5 tonnes/day). Poás emitted the least among the seven, at 678.2 tonnes/day, consistent with its largely phreatic activity during the sampling window. Stations within 10 km of vents exceeded the WHO 24-hour guideline in April, October, and November. The middistance band (10-50 km) crossed the threshold during April and November only, while far-field stations stayed below it year-round. A clear seasonal peak appears between March and May and again in October-November, matching the dryto-wet transition periods when eruption frequency tends to rise while rainfall-driven particle washout remains low.
Comprehensive Interpretation
Taken together, the ground-level and satellite data paint a consistent picture: volcanic emissions in the CAVA degrade air quality across a wide area, but the effect drops off predictably with distance and responds strongly to seasonal meteorological shifts. The Pearson correlation between vent distance and mean PM2.5 was r = -0.78 (p<0.01), and HYSPLIT back-trajectories tied 83% of high-concentration events at downwind stations to identified volcanic sources rather than anthropogenic or biomass-burning origins. The combination of persistent open-vent degassing and periodic explosive episodes creates a dual exposure pattern: chronic low-level pollution punctuated by acute spikes that can push PM2.5 well above safe thresholds for 48-72 hours at a time.
Discussion
The results of this research confirm that volcanic emissions are a dominant driver of regional air quality degradation across the CAVA, consistent with earlier satellite-based assessments by Carn et al. [5] and ground-level work near Masaya by Delmelle et al. [13] . However, the multi-site, multi-year design used here revealed patterns that singlevolcano investigations could not capture. For example, the inverse distance-concentration relationship held across all seven volcanoes with similar slopes, suggesting that dispersion mechanics are broadly comparable despite differences in eruption style and vent elevation.
A notable finding was the seasonal asymmetry in pollutant transport. Dry-season trade winds created a reliable westward to southwestward plume corridor, meaning that communities on the Pacific slope of the arc received considerably higher exposure than those on the Caribbean side. This directional bias has direct implications for public health planning: warning systems and hospital readiness should target Pacific-slope towns during November through April. Wet-season rainfall appears to limit long-range transport effectively, cutting mean AOD by roughly 37% compared with dry months, yet short-duration eruption plumes can still exceed guidelines locally even during the rainy season.
The HYSPLIT back-trajectory results underscored the cross-border nature of volcanic air pollution. Plumes originating at Fuego in Guatemala were traced to air quality exceedance events at monitoring sites in western Honduras and northern El Salvador within 18-36 hours, highlighting the inadequacy of national-only monitoring frameworks [14] . Existing ground-station networks in these countries were not designed with volcanic emissions in mind, and many stations lack the instrumentation needed to distinguish volcanic sulfate from industrial or vehicular sources [15] .
Limitations
Several constraints should be noted. First, the seven monitoring stations, while positioned to capture a range of distances, cannot represent the full spatial variability of the 1,500 km arc. Gaps exist in Honduras and southern Nicaragua where security and logistical barriers prevented installation. Second, OMI SO2 retrievals lose sensitivity under heavy cloud cover, which is common during the wet season; this may have caused an underestimate of wetseason volcanic contributions. Third, the research did not separate volcanic PM2.5 from non-volcanic sources using chemical speciation, so some contribution from biomass burning and traffic at near-urban stations cannot be fully excluded.
Conclusion
This research demonstrated that volcanic eruptions and persistent degassing across the Central American Volcanic Arc produce measurable and often guideline-exceeding degradation of regional air quality. SO2 and PM2.
Figures and tables from the paper
| Station | Volcano | Distance (km) | Mean SO₂ (µg/m³) | Mean PM₂.₅ (µg/m³) | Exceedance Days (%) |
|---|---|---|---|---|---|
| S1 | Fuego | 3.2 | 187.4 | 68.7 | 78.3 |
| S2 | Fuego | 22.5 | 94.1 | 41.2 | 52.6 |
| S3 | Masaya | 4.8 | 163.8 | 57.9 | 71.8 |
| S4 | Masaya | 38.6 | 52.3 | 28.4 | 31.2 |
| S5 | Arenal | 6.1 | 78.6 | 34.1 | 28.7 |
| S6 | Poás | 11.3 | 112.7 | 46.3 | 49.4 |
| S7 | San Cristóbal | 8.4 | 134.2 | 52.1 | 63.9 |
Table text extracted from the original PDF; superscript letters are shown inline. The original table image is below.
View original table image
References
16 in the original paper- Siebert L, Simkin T, Kimberly P. Volcanoes of the World. University of California Press. 2010;3rd Ed:1568.
- Carr MJ, Feigenson MD, Patino LC, Walker JA. Volcanism and geochemistry in Central America: progress and problems. Inside the Subduction Factory. 2003;138:153-174.
- Oppenheimer C, Scaillet B, Martin RS. Sulfur degassing from volcanoes: source conditions, surveillance, plume chemistry and Earth system impacts. Reviews in Mineralogy and Geochemistry. 2011;73(1):363-421.
- Mather TA, Pyle DM, Oppenheimer C. Tropospheric volcanic aerosol. Volcanism and the Earth's Atmosphere. 2003;139:189-212.
- Carn SA, Fioletov VE, McLinden CA, Li C, Krotkov NA. A decade of global volcanic SO2 emissions measured from space. Scientific Reports. 2017;7:44095.
- de Moor JM, Aiuppa A, Avard G, Wehrmann H, Dunbar N, Muller C. Turmoil at Turrialba Volcano: degassing and eruptive processes inferred from highfrequency gas monitoring. Journal of Geophysical Research: Solid Earth. 2016;121(8):5761-5775.
- Longo BM, Rossignol A, Green JB. Cardiorespiratory health effects associated with sulphurous volcanic air pollution. Public Health. 2008;122(8):809-820.
- Delmelle P, Stix J, Baxter PJ, Garcia-Alvarez J, Barquero J. Atmospheric dispersion, environmental effects and potential health hazard associated with the low-altitude gas plume of Masaya volcano, Nicaragua. Bulletin of Volcanology. 2002;64(6):423-434.
- Hansell AL, Horwell CJ, Oppenheimer C. The health hazards of volcanoes and geothermal areas. Occupational and Environmental Medicine. 2006;63(2):149-156.
- DeMets C. A new estimate for present-day CocosCaribbean plate motion: implications for slip along the Central American volcanic arc. Geophysical Research Letters. 2001;28(21):4043-4046.
- Li C, Joiner J, Krotkov NA, Bhartia PK. A fast and sensitive new satellite SO2 retrieval algorithm based on principal component analysis. Geophysical Research Letters. 2013;40(23):6314-6318.
- Stein AF, Draxler RR, Rolph GD, Stunder BJB, Cohen MD, Ngan F. NOAA's HYSPLIT atmospheric transport and dispersion modeling system. Bulletin of the American Meteorological Society. 2015;96(12):20592077.
- Delmelle P, Wadsworth FB, Maters EC, Ayris PM. High temperature reactions between gases and ash particles in volcanic eruption plumes. Reviews in Mineralogy and Geochemistry. 2018;84(1):285-308.
- Mather TA, Tsanev VI, Pyle DM, McGonigle AJS, Oppenheimer C, Allen AG. Characterization and evolution of tropospheric plumes from Lascar and Villarrica volcanoes, Chile. Journal of Geophysical Research. 2004;109:D21303.
- McGonigle AJS, Delmelle P, Oppenheimer C, Tsanev VI, Delfosse T, Williams-Jones G. SO2 depletion in tropospheric volcanic plumes. Geophysical Research Letters. 2004;31(13):L13201.
- Baxter PJ, Stoiber RE, Williams SN. Volcanic gases and health: Masaya Volcano, Nicaragua. The Lancet. 1982;320(8290):150-151.