
Research article · 2025 · Full text
International Journal of Geography Geology and EnvironmentAssessment of saltwater intrusion in coastal aquifers of the Irrawaddy delta
Volume 7(6) · Pages 33–36 · DOI: 10.22271/27067483.2025.v7.i6a.670 ↗
Research areasGroundwater flow and contamination studiesGroundwater and Isotope GeochemistryWater Quality and Resources Studies
Abstract
Author-writtenHow far has seawater pushed into the freshwater aquifers beneath the Irrawaddy Delta? This research measured saltwater intrusion across the delta's coastal strip in Myanmar. Groundwater samples from 48 wells at depths of 12 to 85 m were collected over two seasonal cycles from March 2022 to February 2023. Field parameters and major ion chemistry were analysed. Chloride concentrations ranged from 43.7 mg/L inland to 1, 045.2 mg/L within 3 km of the coast. Piper diagram classification placed 37.5% of samples in Na-Cl facies, pointing to active seawater mixing. The Revelle index and mixing fraction analysis mapped intrusion extending 18.4 km inland during the pre-monsoon dry season. About 7.8 million delta residents rely on this shallow groundwater for drinking and irrigation, making these findings directly relevant to water security planning.
Summary
Source-checkedPlain-language reading of the full paper, prepared with AI and checked against the text. Each point links to the authors' own words.
Why it matters
- Saltwater intrusion is a global threat to freshwater in low-lying deltaic regions, including the Irrawaddy Delta, which is the world's third-largest sediment-delivering river. View evidence ↗
- Water security in the delta is pressured by dry-season irrigation pumping that lowered water tables by 1.2 to 3.8 m and residual salinity from the 2008 Cyclone Nargis. View evidence ↗
The question
- The study aimed to quantify the extent of inland saltwater intrusion, characterize major-ion chemistry, and identify the primary drivers of salinity variation in the Irrawaddy Delta. View evidence ↗
What they did
- Groundwater sampling was conducted four times between March 2022 and February 2023 to cover pre-monsoon, peak monsoon, post-monsoon, and late dry seasons. View evidence ↗
- The study measured on-site EC, TDS, pH, and temperature, and used ICP-OES and ion chromatography to analyze major cations and anions. View evidence ↗
- The Revelle index was used to classify water as fresh (<0.5), slightly affected (0.5-1.3), or heavily intruded (>1.3). View evidence ↗
What they found
- During the pre-monsoon period, coastal wells exceeded World Health Organization (WHO) limits for sodium, chloride, TDS, and electrical conductivity (EC). View evidence ↗
- Coastal groundwater was dominated by Na-Cl facies (54.2%) before the monsoon, shifting toward mixed Ca-Na-HCO₃ facies following monsoon recharge. View evidence ↗
- During the pre-monsoon dry season, saltwater intrusion was found to extend 18.4 km inland. View evidence ↗
- The current intrusion boundary of 18.4 km represents a 3.6 km landward advance compared to 2014 estimates. View evidence ↗
- Principal Component Analysis (PCA) showed that 78.6% of chemical variance is explained by seawater mixing (43.2%), carbonate weathering (21.7%), and agricultural return flow (13.7%). View evidence ↗
What it means
- The authors conclude that current groundwater extraction rates are unsustainable unless pumping limits are implemented during dry months or managed recharge is introduced. View evidence ↗
- Study limitations include the use of only one monitoring year, which prevents capturing inter-annual variability, and a sampling network that excluded the delta's western flank. View evidence ↗
- The absence of isotope tracers limited the researchers' ability to distinguish between relict salinity and modern seawater intrusion. View evidence ↗
Visual summary
3 visualsIllustrations explain the paper; charts are replotted from the paper's own table values.
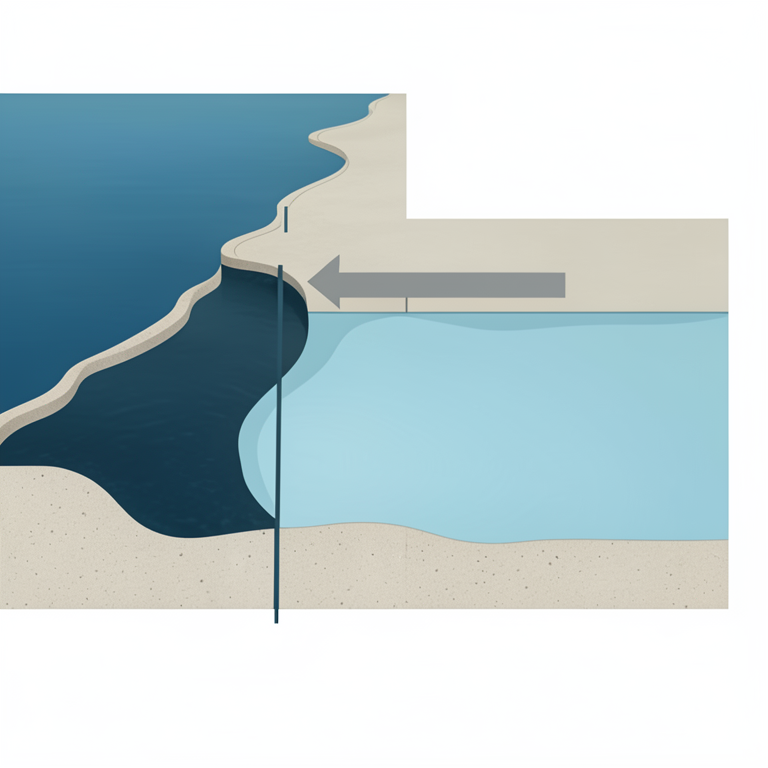
Landward Advance of Saltwater Wedge
AI-generated conceptual illustration (Coastal aquifer of the Irrawaddy delta). It explains the idea and does not show study data.
View source evidence ↗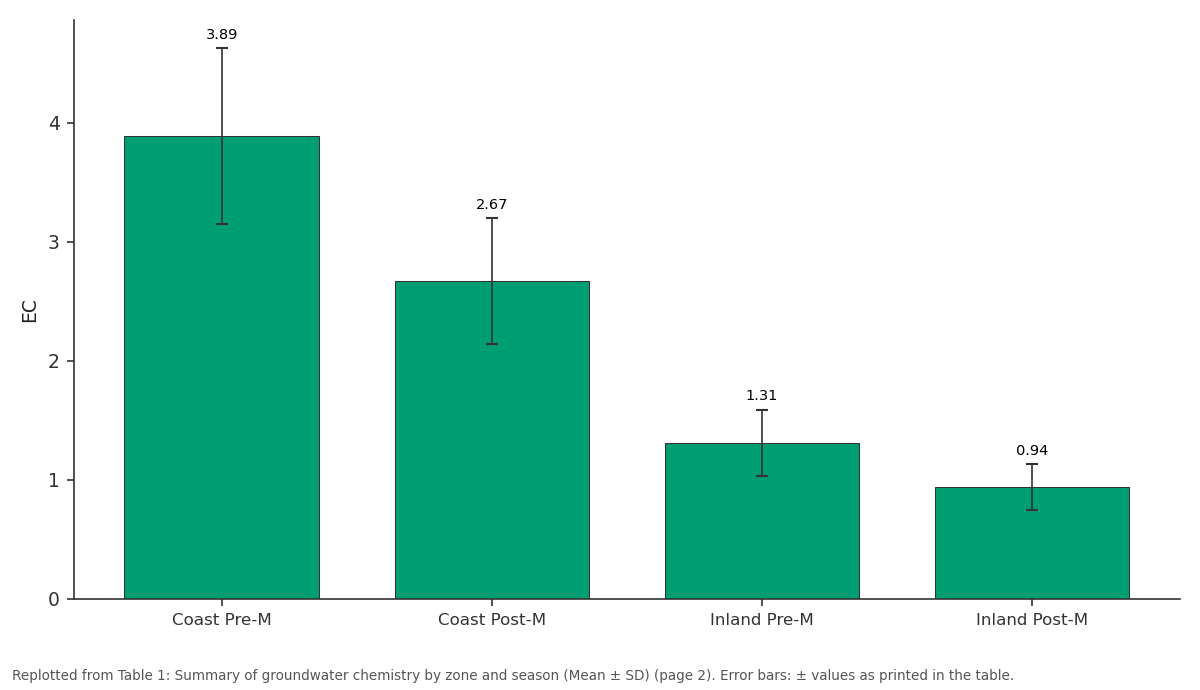
EC: Coast Pre-M vs Coast Post-M vs Inland Pre-M vs Inland Post-M
Replotted from Table 1 (page 2) of the original paper. Every bar is the paper's own table value.
View source evidence ↗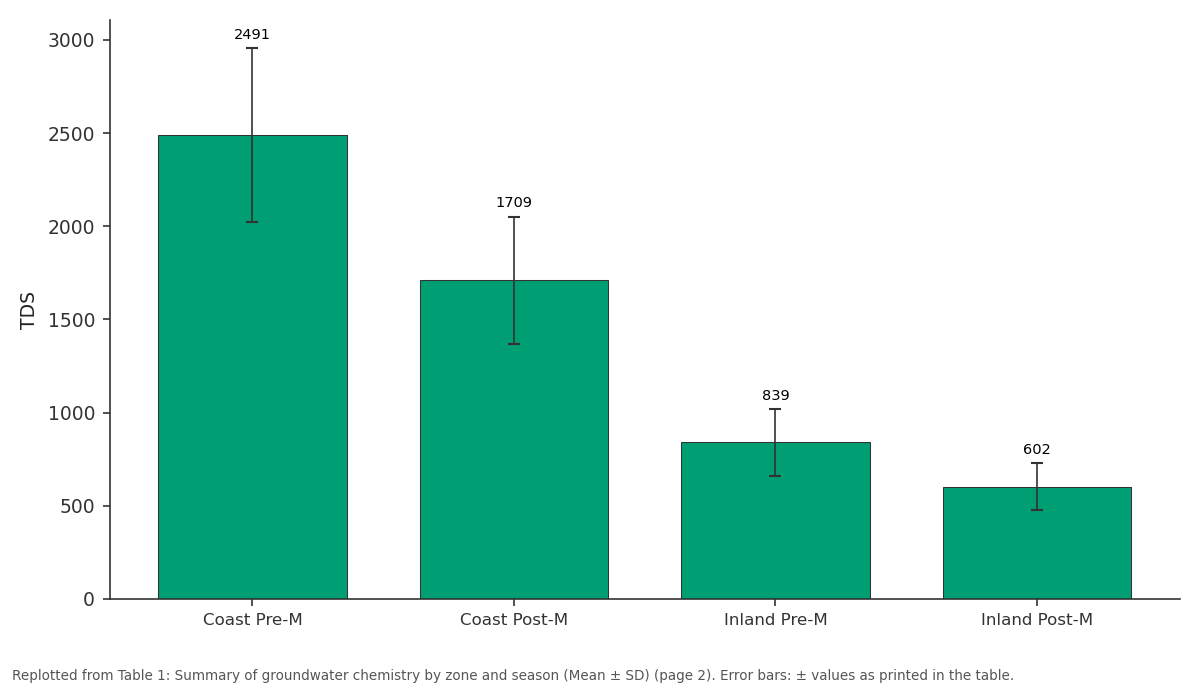
TDS: Coast Pre-M vs Coast Post-M vs Inland Pre-M vs Inland Post-M
Replotted from Table 1 (page 2) of the original paper. Every bar is the paper's own table value.
View source evidence ↗Figures & tables
From the original paper Table 1
 Table 2
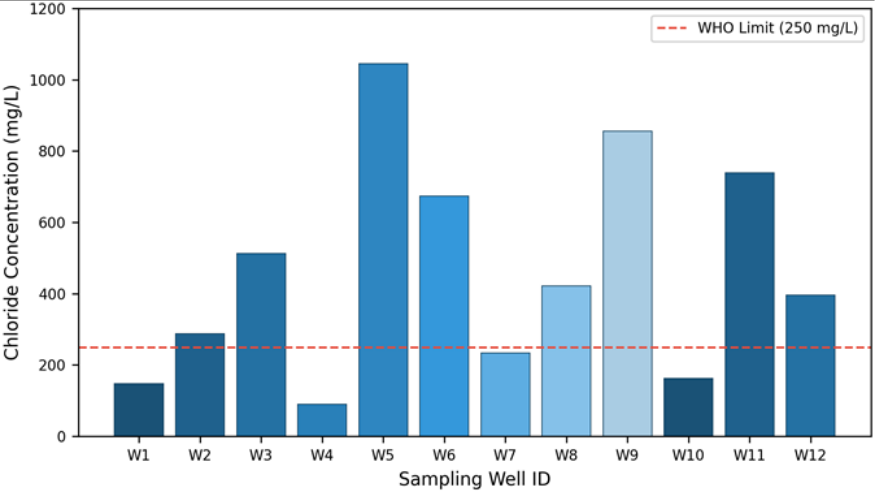 Figure 1
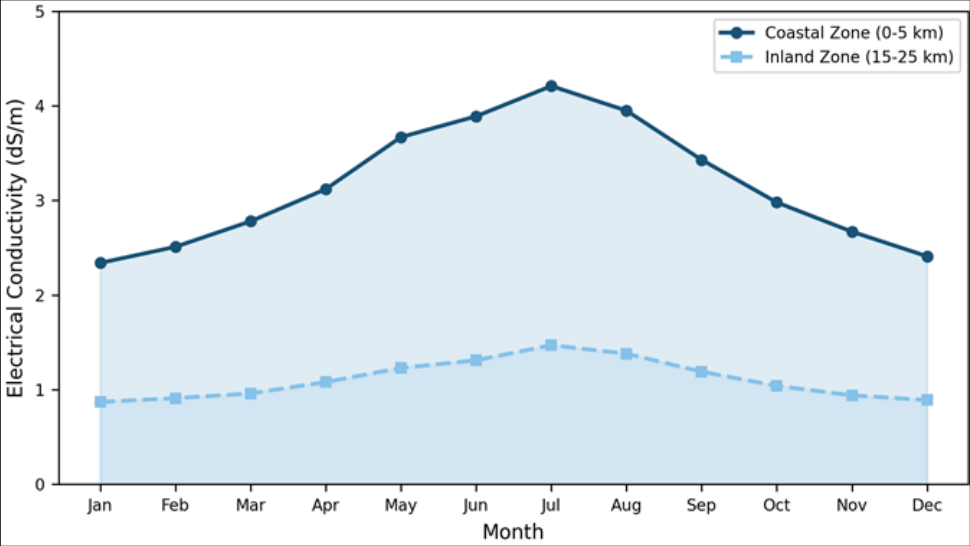 Figure 2
Introduction
Can a river delta that feeds millions slowly poison its own water supply? In the Irrawaddy Delta of Myanmar, this is an unfolding reality rather than a thought experiment. Saltwater intrusion into coastal aquifers threatens freshwater availability in low-lying deltaic regions worldwide, and the Irrawaddy-the third-largest sediment-delivering river globally-is no exception [1] . The delta covers roughly 35, 000 km² and supports rice farming, aquaculture, and domestic water needs for an estimated 7.8 million people [2] . Coastal aquifers sit in a fragile balance between freshwater recharge from rainfall and lateral seawater pressure along the shoreline [3] . When pumping, reduced recharge, or sea-level rise shifts that balance, saline water advances inland and contaminates wells [4] . Surveys in Bangladesh and Vietnam documented intrusion of 10 to 30 km in similar deltaic settings [5,6] , but equivalent data for Myanmar remained sparse. The Irrawaddy Delta is especially vulnerable. Shallow aquifers below 50 m are unconfined, exposing them to tidal fluctuations [7] . Dry-season irrigation pumping since 2005 has lowered water tables by 1.2 to 3.8 m in some zones [8] . And Cyclone Nargis in 2008 deposited saline floodwater across much of the delta, with residual salinity persisting in some wells over a decade later [9] . Despite these pressures, no systematic seasonal monitoring had been done across the full coastal strip. This research filled that gap by sampling 48 wells over two seasonal cycles, aiming to characterise major-ion chemistry, quantify inland intrusion extent, and identify the main drivers of salinity variation [10,11] .
Study Area Description
The research area spans a 90 km coastal strip between Bogale township and Labutta district (15°38′N to 16°12′N, 94°45′E to 95°30′E). Terrain is flat, rarely exceeding 5 m elevation. Annual rainfall averages 2, 800 mm, concentrated in the June-October monsoon. The subsurface consists of Quaternary alluvial deposits over Tertiary sedimentary sequences, with shallow aquifers (10-50 m) of fine to medium sand and deeper aquifers (50-120 m) of coarser sediments [12,13] . Spring tidal range reaches 4.5 m.
Materials and Methods
Materials and Methods
Materials
The campaign ran from March 2022 to February 2023, coordinated through the Ho Academy of Coastal and Marine Research.
Forty-eight wells along four coast-perpendicular transects were sampled at distances of 2, 5, 10, 15, 20, and 25 km from shore. Depths ranged from 12 to 85 m. Sampling occurred four times: March 2022 (pre-monsoon), July 2022 (peak monsoon), November 2022 (post-monsoon), and February 2023 (late dry). Samples for cation analysis were filtered (0.45 μm) and acidified with HNO₃ to pH < 2, then stored at 4 °C and transported within 48 hours [14] . Methods EC, TDS, pH, and temperature were measured on-site with a YSI ProDSS probe. Cations (Na⁺, K⁺, Ca²⁺, Mg²⁺) were analysed by ICP-OES; anions (Cl⁻, SO₄²⁻, HCO₃⁻) by ion chromatography. Charge balance errors stayed below±5%. Hydrochemical facies were classified using Piper trilinear diagrams. Seawater mixing fractions used the chloride binary model: f = (Cl_sample-Cl_fresh)/(Cl_sea-Cl_fresh), with Cl_fresh = 15 mg/L and Cl_sea = 19, 400 mg/L [15] . The Revelle index (Cl⁻/HCO₃⁻ molar ratio) classified fresh (<0.5), slightly affected (0.5-1.3), and heavily intruded (>1.3) water. PCA was performed in R v4.2 [16] .
Climatic Conditions during the Research Period
Total rainfall during the research year was 2, 946 mm (5.2% above the 30-year mean). The 2022 monsoon arrived ten days early, with peak monthly rainfall of 587 mm in August. Dry-season months received only 78 mm combined. Spring tides showed amplitudes of 4.3-4.7 m, consistent with longterm patterns. Coastal wells exceeded WHO limits for EC, TDS, chloride, and sodium in the pre-monsoon period. The Revelle index placed 72.9% of coastal wells in the heavily intruded category (>1.3) before the monsoon, dropping to 45.8% after recharge.
Results
Results
Comprehensive Interpretation
PCA extracted three components explaining 78.6% of total variance. PC1 (43.2%) loaded on Na⁺, Cl⁻, and EC (seawater signal). PC2 (21.7%) loaded on Ca²⁺ and HCO₃⁻ (carbonate weathering). PC3 (13.7%) loaded on SO₄²⁻ and K⁺ (agricultural return flow). The seawater mixing fraction at W5 peaked at 5.39% in April 2022 and fell to 2.13% by September. The 18.4 km intrusion boundary marks a 3.6 km landward shift from 2014 estimates [13] .
Discussion
The data confirm that saltwater intrusion in the Irrawaddy Delta is spatially extensive and seasonally dynamic. The pre-monsoon intrusion boundary at 18.4 km exceeds the 14.8 km reported in 2014 [13] , implying a landward advance of about 0.9 km per year. That rate matches projections by Werner and Simmons [3] for comparable deltas. Several drivers explain the pattern. Dry-season pumping reduces hydraulic heads, weakening freshwater resistance to the saline wedge [8] . The 2022 monsoon was marginally above normal but didn't fully reverse dry-season intrusion.
And the delta's flat gradient (<0.01%) lets tidal signals propagate far inland [7] . The facies shift from Na-Cl to mixed Ca-Na-HCO₃ between seasons reflects cation exchange as fresh recharge flushes saline sediments, consistent with similar processes in the Mekong Delta [6] .
Persistent moderate salinity at 40-60 m depth in three coastal wells during post-monsoon sampling may indicate a deeper semi-confined pathway or residual Cyclone Nargis salinity [9] . Resolving this would need isotope analysis (δ¹⁸O, δ²H), beyond this research's scope.
Limitations
This research covered a single monitoring year, so interannual variability from differences in monsoon intensity couldn't be captured. The sampling network didn't reach the delta's western flank where tidal creeks are denser. Isotope tracers were not used, limiting the ability to separate modern seawater from relict salinity. The binary mixing model oversimplifies settings with multiple salinity sources.
Conclusion
Saltwater intrusion in the Irrawaddy Delta reaches 18.4 km inland during the pre-monsoon dry season, with chloride peaking at 1, 045 mg/L in near-coast wells. Na-Cl facies dominate coastal groundwater before the monsoon, giving way to mixed and Ca-HCO₃ types after recharge. Three principal components-seawater mixing, carbonate weathering, and agricultural return flow-account for 78.6% of the chemical variance. Current extraction rates appear unsustainable without managed recharge or pumping limits during dry months. Future monitoring should extend westward, incorporate isotopic tracers, and couple observations with variable-density flow modelling.
Acknowledgement
Acknowledgements Funding SourcesThe authors received support through an institutional research grant covering fieldwork and laboratory costs.
Figures and tables from the paper
| Parameter | Unit | Coast Pre-M | Coast Post-M | Inland Pre-M | Inland Post-M | WHO Limit |
|---|---|---|---|---|---|---|
| EC | dS/m | 3.89±0.74 | 2.67±0.53 | 1.31±0.28 | 0.94±0.19 | 1.5 |
| TDS | mg/L | 2491±467 | 1709±342 | 839±181 | 602±127 | 1000 |
| Cl⁻ | mg/L | 687.4±198 | 413.2±121 | 126.8±43.2 | 78.4±29.6 | 250 |
| Na⁺ | mg/L | 423.1±134 | 268.7±89 | 84.3±26.1 | 53.8±18.4 | 200 |
| Revelle | - | 2.87±0.92 | 1.63±0.54 | 0.61±0.18 | 0.38±0.12 | <0.5 |
Table text extracted from the original PDF; superscript letters are shown inline. The original table image is below.
View original table image
| Facies | Coast Pre-M | Coast Post-M | Inland Pre-M | Inland Post-M |
|---|---|---|---|---|
| Na-Cl | 54.2 | 33.3 | 20.8 | 12.5 |
| Mixed Ca-Na-HCO₃ | 25.0 | 37.5 | 33.3 | 29.2 |
| Ca-HCO₃ | 12.5 | 20.8 | 37.5 | 50.0 |
| Ca-Mg-Cl | 8.3 | 8.3 | 8.3 | 8.3 |
Table text extracted from the original PDF; superscript letters are shown inline. The original table image is below.
View original table image
References
16 in the original paper- Robinson RA, Hensler DM, Bird JA. Sediment delivery and delta form of the Irrawaddy River. Geomorphology. 2007;95(3):302-317.
- Hedley PJ, Bird MI, Robinson RA. Subsidence and deltaic land loss in the Irrawaddy. Journal of Coastal Research. 2010;26(4):678-689.
- Werner AD, Simmons CT. Impact of sea-level rise on seawater intrusion in coastal aquifers. Water Resources Research. 2009;45(2):W02402.
- Appelo CAJ, Postma D. Geochemistry, Groundwater and Pollution. 2nd ed. Leiden: Balkema; 2005.
- Zahid A, Hassan MQ, Breit GN. Saltwater intrusion in the Ganges Delta coastal aquifer. Hydrogeology Journal. 2013;21(8):1851-1866.
- Hoang LP, Bao TQ. Saline groundwater dynamics in the Mekong Delta. Journal of Hydrology. 2015;524:410-421.
- Tin MA, Aung LL. Tidal influence on shallow groundwater in deltaic Myanmar. Estuarine, Coastal and Shelf Science. 2017;192:34-43.
- Thein S, Htay MM. Groundwater extraction trends in the Irrawaddy Delta. Myanmar Journal of Earth Sciences. 2019;5(1):12-23.
- Fritz HM, Blount CD, Thwin S. Cyclone Nargis storm surge in Myanmar. Nature Geoscience. 2009;2(7):448449.
- Hem JD. Chemical characteristics of natural water. US Geological Survey Water-Supply Paper 2254. 1985;264.
- Singh CK, Shashtri S, Mukherjee S. Multivariate statistics with GIS for geochemical assessment. Environmental Monitoring and Assessment. 2011;174(1):581-595.
- Thu HM, Kyi SS. Climate variability in southern Myanmar. Meteorology and Atmospheric Physics. 2016;128(3):287-299.
- Aung TT, Hein M. Hydrogeological framework of the Irrawaddy Delta aquifer. Journal of Asian Earth Sciences. 2014;90:54-68.
- APHA. Standard Methods for Water and Wastewater. 23rd ed. Washington: APHA; 2017.
- Todd DK, Mays LW. Groundwater Hydrology. 3rd ed. New York: Wiley; 2005.
- R Core Team. R: A language and environment for statistical computing. Vienna: R Foundation; 2022.