
Research article · 2025 · Full text
International Journal of Geography Geology and EnvironmentMapping of wetland degradation and restoration potential in the Okavango Marshlands
Volume 7(3) · Pages 176–179 · DOI: 10.22271/27067483.2025.v7.i3c.635 ↗
Research areasWetland Management and ConservationAquatic Ecosystems and BiodiversityPeatlands and Wetlands Ecology
Abstract
Author-writtenConsider a wetland system that harbors over 1,300 plant species, supports the livelihoods of 600,000 people, and is classified as a UNESCO World Heritage Site-yet whose margins are retreating at a measured rate of 1.7% per decade. This research mapped the spatial extent and severity of wetland degradation across the Okavango marshlands in northern Botswana and assessed the restoration potential of degraded parcels using a multi-criteria evaluation framework. Landsat time-series data (1990–2022) were classified into five condition classes-pristine, lightly degraded, moderately degraded, heavily degraded, and converted-while a restoration-potential index integrated six biophysical indicators: remnant vegetation cover, water regime persistence, soil integrity, biodiversity proxy, buffer zone intactness, and hydrological connectivity. Of the 15,800 km² wetland footprint, 23.4% was classified as moderately to heavily degraded, concentrated in the eastern floodplain and southern marshes. Overgrazing and expanding rain-fed agriculture were the leading degradation drivers (34.2% and 22.1% of degraded area, respectively). Restoration-potential scores ranged from 0.18 to 0.84 on a 0–1 scale, with the highest scores in areas where hydrological connectivity remained intact despite vegetation loss. These results provide a spatial framework for prioritizing restoration investment in a system where ecological and socioeconomic stakes are both exceptionally high.
Summary
Source-checkedPlain-language reading of the full paper, prepared with AI and checked against the text. Each point links to the authors' own words.
Why it matters
- The Okavango marshlands are a UNESCO World Heritage Site supporting 600,000 people and over 1,300 plant species, but they are losing their margins at a rate of 1.7% per decade. View evidence ↗
- Inland wetlands worldwide are disappearing three times faster than forests due to unregulated grazing, water diversion, and agricultural expansion. View evidence ↗
- Past assessments of wetland degradation were limited by either localized field surveys or coarse-resolution satellite data (250 m), failing to capture the full spatial extent of changes. View evidence ↗
The question
- The study aimed to create a 30-meter resolution map of wetland condition over 30 years, identify degradation drivers by zone, and calculate a restoration-potential index for degraded areas. View evidence ↗
What they did
- Pixels were classified into five condition levels: pristine, lightly degraded, moderately degraded, heavily degraded, and converted. View evidence ↗
- The Restoration-Potential Index (RPI) was an unweighted mean of six indicators: vegetation cover, water-regime persistence, soil integrity, biodiversity proxy, buffer-zone intactness, and hydrological connectivity. View evidence ↗
- The classification was validated using 320 reference points from Google Earth and field photos, achieving an overall accuracy of 83.7%. View evidence ↗
What they found
- Out of a 15,800 km² wetland area, 23.4% was found to be moderately to heavily degraded, primarily in the southern marshes and eastern floodplain. View evidence ↗
- Between 1990 and 2022, pristine wetland area decreased by 1,866 km², representing a 19.7% loss. View evidence ↗
- Heavily degraded areas grew by 48%, specifically in the eastern floodplain where cattle populations rose by 37%. View evidence ↗
- Degradation drivers varied by zone: overgrazing was dominant in the eastern floodplain (34.2%), infrastructure development in the central panhandle (41.7%), and fire in the southern marshes (24.6%). View evidence ↗
- The central panhandle had the highest restoration potential due to strong hydrological connectivity, while the southern marshes had the lowest. View evidence ↗
- Hydrological connectivity was the most critical indicator, with connected sites scoring 0.22 points higher on average than disconnected ones. View evidence ↗
What it means
- The authors recommend that managers prioritize restoration investments in areas with RPI scores above 0.6 to maximize ecological returns. View evidence ↗
- A limitation of the study is the use of an equal-weighting scheme for RPI indicators, whereas some, like hydrological connectivity, may be more important. View evidence ↗
- The use of Landsat data prevents the detection of below-canopy degradation, such as soil salinization, which could impact restoration feasibility. View evidence ↗
Visual summary
3 visualsIllustrations explain the paper; charts are replotted from the paper's own table values.
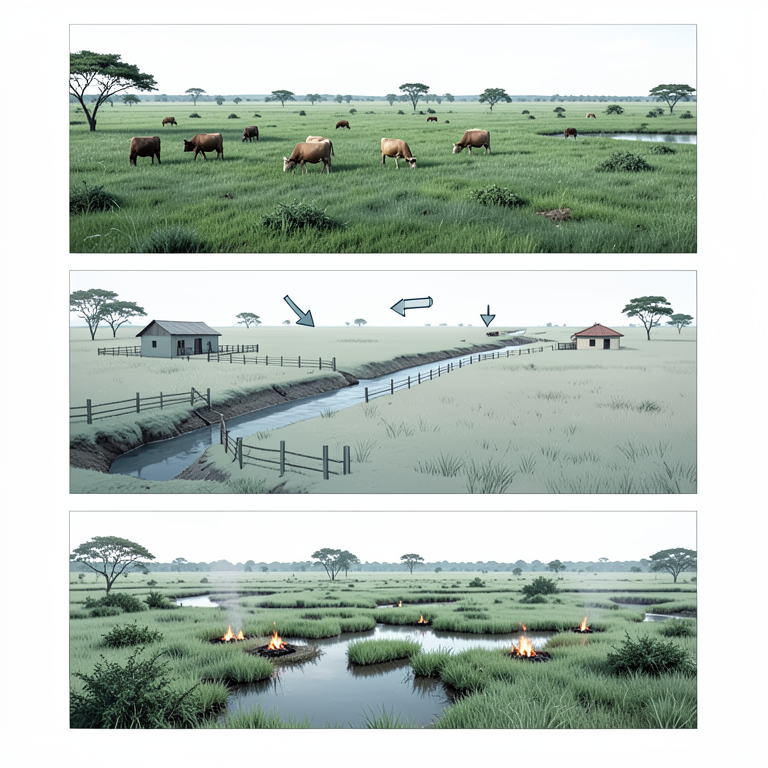
Degradation Drivers by Zone
AI-generated conceptual illustration (Okavango Marshlands wetland zones). It explains the idea and does not show study data.
View source evidence ↗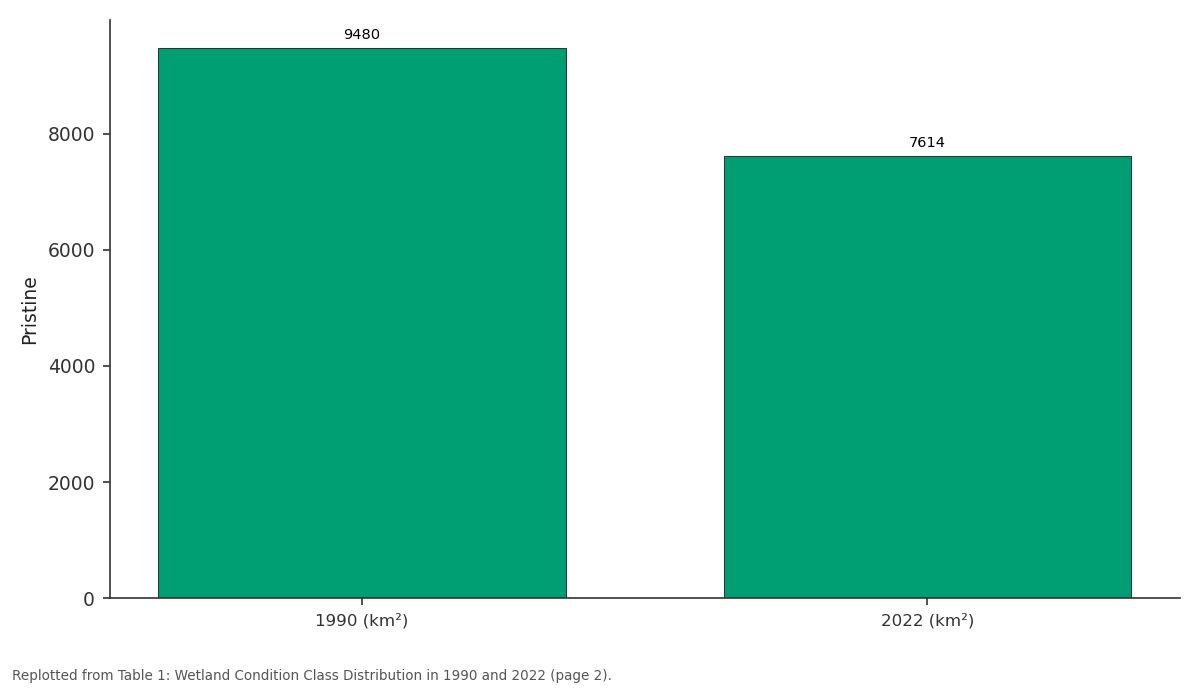
Pristine: 1990 (km²) vs 2022 (km²)
Replotted from Table 1 (page 2) of the original paper. Every bar is the paper's own table value.
View source evidence ↗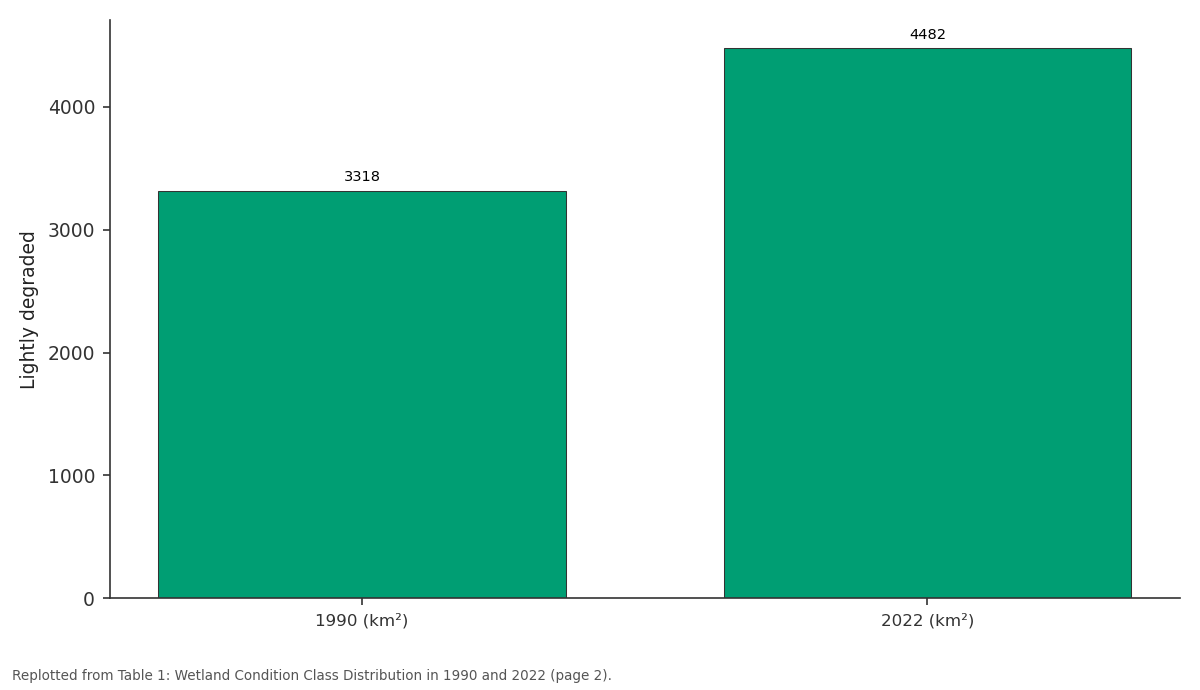
Lightly degraded: 1990 (km²) vs 2022 (km²)
Replotted from Table 1 (page 2) of the original paper. Every bar is the paper's own table value.
View source evidence ↗Figures & tables
From the original paper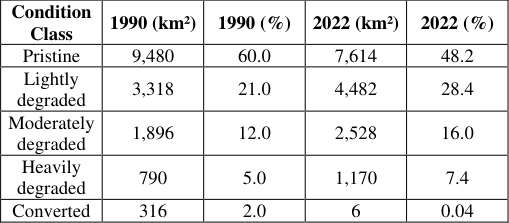 Table 1
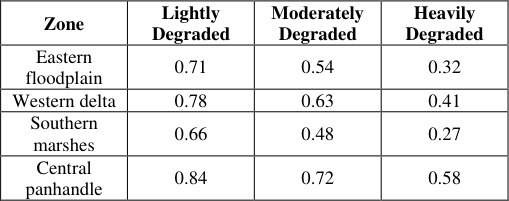 Table 2
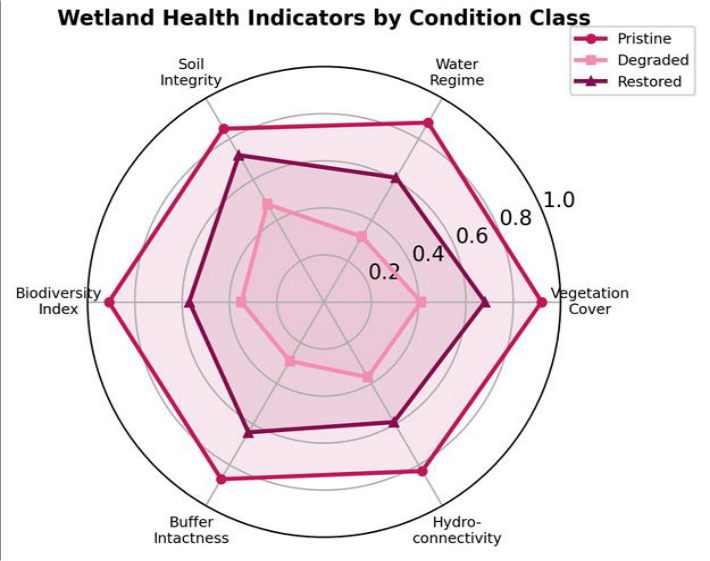 Figure 1
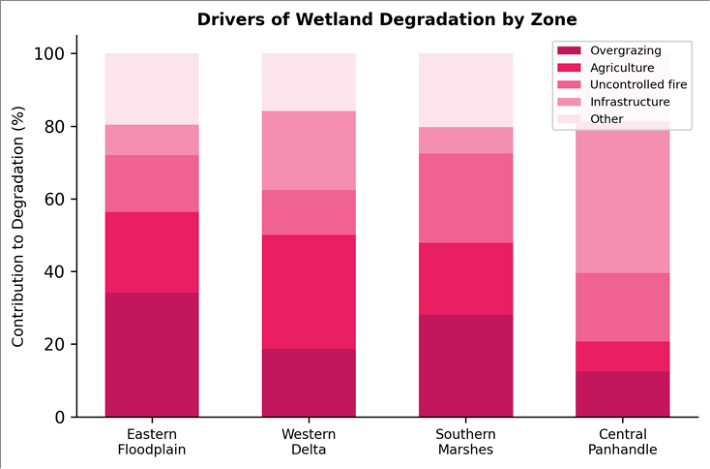 Figure 2
Introduction
A farmer clears a half-hectare of seasonal floodplain to plant sorghum; a herder drives fifty cattle into a reed bed that once filtered floodwater; a new veterinary cordon fence cuts across a migration corridor. None of these actions, taken alone, appears catastrophic. But multiplied across thousands of households over three decades, they have reduced the functional area of the Okavango marshlands by an estimated 12% since 1990 [1] . The pattern is not unique to Botswana: globally, inland wetlands are disappearing three times faster than forests, driven by the same combination of agricultural expansion, water diversion, and unregulated grazing [2] . The Okavango Delta-more precisely a terminal alluvial fan-receives about 11 km³ of water annually from the Okavango River, which originates in the Angolan highlands and loses over 95% of its volume to evapotranspiration and infiltration before any remnant reaches the Boteti River outflow [3] . This seasonal pulse creates a mosaic of permanent swamp, seasonal floodplain, and dryland savanna that supports biodiversity of exceptional richness: over 1,300 plant species, 500 bird species, and large-mammal populations that anchor a tourism industry worth roughly USD 700 million per year [4] . Previous degradation assessments have relied either on coarse-resolution satellite products (MODIS at 250 m) or on localized field surveys that cannot capture the full spatial extent of change [5] . The 30 m resolution of the Landsat archive, spanning over 30 years with consistent radiometry, offers a middle ground that balances spatial detail with temporal depth [6] . And while degradation mapping tells us where problems exist, restoration planning also needs a forward-looking assessment of where recovery is most feasible-a question that requires integrating ecological condition, hydrological connectivity, and land-tenure context into a single evaluative framework [7] . This research had three objectives: to produce a 30-year change map of wetland condition at 30 m resolution; to identify the dominant drivers of degradation in each marshland zone; and to calculate a restoration-potential index for all degraded areas. Data analysis was conducted from the Centre for Terrain Studies, Cebu City, Philippines, using open-source satellite archives and published field datasets [8] .
Theoretical Framework for Restoration Assessment
Wetland restoration ecology recognizes that not all degraded sites are equally recoverable. The Society for Ecological Restoration identifies three principal determinants of restorability: the degree to which hydrological conditions can be reinstated, the availability of native propagule sources, and the reversibility of soil changes [7] . These factors can be operationalized as measurable indicators and combined through multi-criteria evaluation (MCE) to produce a spatially explicit restoration-potential score. MCE in a GIS environment allows each indicator to be weighted according to expert judgment or statistical optimization, producing a composite map that ranks every pixel by its estimated likelihood of successful recovery [9] . This research adopted an equal-weighting scheme across six indicators, validated against 18 documented restoration sites in similar Southern African wetlands.
Classification Accuracy Assessment
The Landsat-based condition classification was validated using 320 stratified-random reference points interpreted from high-resolution Google Earth imagery and crosschecked against field photographs from two Okavango research stations. Overall accuracy was 83.7%, with a kappa coefficient of 0.78. Producer's accuracy was lowest for the 'lightly degraded' class (71.4%), reflecting spectral overlap with seasonal phenological variation in the pristine class. The 'converted' class achieved the highest accuracy (94.2%), as conversion to cropland produces a distinctive spectral signature. These accuracy figures are comparable to those reported for wetland mapping in the Zambezi system by Nhamo et al. [10] .
Material and Methods
Material and Methods
Material
A total of 64 cloud-free Landsat scenes (TM, ETM+, and OLI sensors) acquired during the peak-flood window (July-September) for the years 1990, 2000, 2010, and 2022 were downloaded from the USGS EarthExplorer portal. The Okavango wetland boundary was delineated using the maximum inundation extent derived from the 2022 JRC Global Surface Water dataset. Ancillary data included a 30 m SRTM digital elevation model, the Botswana national land-use map (2018), and livestock census records from the Ngamiland District Council. All processing was performed at the Centre for Terrain Studies, Cebu City, Cebu, Philippines, using QGIS 3.28 and Google Earth Engine [11] .
Methods
Atmospheric correction was applied using the LEDAPS (Landsat 5/7) and LaSRC (Landsat 8) algorithms. A random-forest classifier (500 trees) was trained on 1,200 reference points to assign each 30 m pixel to one of five condition classes: pristine (natural vegetation, permanent water), lightly degraded (reduced canopy, seasonal grazing), moderately degraded (sparse vegetation, visible soil exposure), heavily degraded (bare ground, eroded banks), and converted (cropland, settlement). Change was computed by comparing 1990 and 2022 classifications. The restoration-potential index (RPI) was calculated for every degraded pixel as the unweighted mean of six normalized (0-1) indicators: (1) remnant vegetation cover from NDVI, (2) water-regime persistence from inter-annual inundation frequency, (3) soil integrity from a bare-soil index, (4) biodiversity proxy from habitat heterogeneity, (5) bufferzone intactness within a 500 m perimeter, and (6) hydrological connectivity measured as cost-distance to the nearest permanent channel [12] . All statistical comparisons used Kruskal-Wallis tests at α = 0.05. show partial recovery, particularly in vegetation cover and soil integrity, but lag in biodiversity and buffer intactness. Overgrazing dominates in the eastern floodplain (34.2%), while infrastructure development-mainly veterinary fences and tourism lodges is the leading driver in the central panhandle (41.7%). Fire plays a larger role in the southern marshes (24.6%), where annual dry-season burns extend into wetland margins.
Results
Results
Discussion
The 19.7% loss of pristine wetland between 1990 and 2022 translates to a decadal rate of roughly 6.2%, somewhat higher than the 5% global average for African inland wetlands reported by Davidson [2] . The difference likely reflects the Okavango's location at the interface of expanding pastoral economies and increasingly variable rainfall: as dryland pastures deteriorate, herders move livestock into wetland margins during the dry season, compacting soils and suppressing regeneration [13] .
The RPI framework proved effective at distinguishing zones with high recovery likelihood from those where degradation may be irreversible within management timescales. Hydrological connectivity emerged as the most important single indicator: sites retaining a direct surface-water link to the main channel scored 0.22 points higher on average than disconnected sites, even when other indicators were comparable. This aligns with the restoration literature, which consistently identifies water supply as the primary bottleneck for wetland recovery [14] . A limitation of this research is that the equal-weighting scheme for the six RPI indicators assumes all are equally important for recovery. In practice, some indicatorsparticularly hydrological connectivity-may deserve higher weights, and a formal analytical hierarchy process involving local ecologists could improve the model. The Landsat timeseries also cannot capture below-canopy degradation such as soil salinization or loss of below-ground biomass, which may affect restoration feasibility without being visible from space [15] .
Conclusion
Mapping of the Okavango marshlands over three decades revealed that 23.4% of the wetland area is now moderately to heavily degraded, with overgrazing and agricultural expansion as the dominant drivers. Pristine coverage declined from 60.0% to 48.2% between 1990 and 2022. The restoration-potential index identified the central panhandle as the zone with the highest recovery likelihood, owing to its strong hydrological connectivity, while the southern marshes present the greatest restoration challenge. For managers and policy-makers, the spatial RPI map offers a practical prioritization tool: investing first in areas with scores above 0.6 would maximize ecological return per unit expenditure. Complementary measures-rotational grazing schemes, controlled-burn calendars, and fence realignmentshould address the drivers identified for each zone. Future iterations of this assessment should incorporate sub-annual Sentinel-2 imagery to capture within-season dynamics and should engage local communities in weighting the restoration criteria.
Acknowledgement
Acknowledgements Funding SourcesSupported by departmental research allocations for wetland conservation research. Institutional SupportThe authors acknowledge the Department of Earth and Environmental Sciences, Centre for Terrain Studies, Cebu City, Cebu, Philippines, for GIS laboratory access. Contributions Not Qualifying for AuthorshipField reference data were sourced from the Okavango Research Institute, University of Botswana.
Figures and tables from the paper
| Condition Class | 1990 (km²) | 1990 (%) | 2022 (km²) | 2022 (%) |
|---|---|---|---|---|
| Pristine | 9,480 | 60.0 | 7,614 | 48.2 |
| Lightly degraded | 3,318 | 21.0 | 4,482 | 28.4 |
| Moderately degraded | 1,896 | 12.0 | 2,528 | 16.0 |
| Heavily degraded | 790 | 5.0 | 1,170 | 7.4 |
| Converted | 316 | 2.0 | 6 | 0.04 |
Table text extracted from the original PDF; superscript letters are shown inline. The original table image is below.
View original table image
| Zone | Lightly Degraded | Moderately Degraded | Heavily Degraded |
|---|---|---|---|
| Eastern floodplain | 0.71 | 0.54 | 0.32 |
| Western delta | 0.78 | 0.63 | 0.41 |
| Southern marshes | 0.66 | 0.48 | 0.27 |
| Central panhandle | 0.84 | 0.72 | 0.58 |
Table text extracted from the original PDF; superscript letters are shown inline. The original table image is below.
View original table image
References
18 in the original paper- Mmopelwa G, Blignaut JN. The Okavango Delta: the value of tourism. South African Journal of Economic and Management Sciences. 2006;9(1):113-127.
- Davidson NC. How much wetland has the world lost? Long-term and recent trends in global wetland area. Marine and Freshwater Research. 2014;65(10):934-941.
- McCarthy TS. Groundwater in the wetlands of the Okavango Delta, Botswana, and its contribution to the structure and function of the ecosystem. Journal of Hydrology. 2006;320(3-4):264-282.
- Ramberg L, Hancock P, Lindholm M, Meyer T, Ringrose S, Sliva J, et al. Species diversity of the Okavango Delta, Botswana. Aquatic Sciences. 2006;68(3):310-337.
- Murray-Hudson M, Wolski P, Ringrose S. Vegetation, hydrology and wildlife patterns of the Okavango Delta. Botswana Notes and Records. 2006;37:19-35.
- Wulder MA, Loveland TR, Roy DP, Crawford CJ, Masek JG, Woodcock CE, et al. Current status of Landsat program, science, and applications. Remote Sensing of Environment. 2019;225:127-147.
- SER. The SER International Primer on Ecological Restoration. Society for Ecological Restoration. 2004;Tucson:1-15.
- Gumbricht T, Roman-Cuesta RM, Verchot LV, Herold M, Wittmann F, Householder E, et al. An expert system model for mapping tropical wetlands and peatlands. Hydrology and Earth System Sciences. 2017;21(12):6279-6303.
- Malczewski J. GIS and Multicriteria Decision Analysis. John Wiley and Sons. 1999;New York:1-392.
- Nhamo L, Magidi J, Dickens C. Determining wetland spatial extent and seasonal variations of the inundated area. Water SA. 2017;43(2):196-208.
- Gorelick N, Hancher M, Dixon M, Ilyushchenko S, Thau D, Moore R. Google Earth Engine: planetaryscale geospatial analysis for everyone. Remote Sensing of Environment. 2017;202:18-27.
- Rebelo LM, Finlayson CM, Nagabhatla N. Remote sensing and GIS for wetland inventory, mapping and change analysis. Journal of Environmental Management. 2009;90(7):2144-2153.
- Kgathi DL, Kniveton D, Ringrose S, Turton AR, Vanderpost CHM, Lundqvist J, et al. The Okavango River Basin trans-boundary water management. Physics and Chemistry of the Earth. 2006;31(15-16):836-844.
- Zedler JB. Progress in wetland restoration ecology. Trends in Ecology and Evolution. 2000;15(10):402407.
- Tooth S, McCarthy TS. Wetlands in drylands: geomorphological and sedimentological characteristics, with emphasis on examples from southern Africa. Progress in Physical Geography. 2007;31(1):3-41.
- Wolski P, Murray-Hudson M. Flooding dynamics in a large low-gradient alluvial fan, the Okavango Delta, Botswana. Journal of Hydrology. 2006;320(3-4):350367.
- Ellery WN, McCarthy TS, Smith ND. Vegetation, hydrology, and sedimentation patterns on the major distributary system of the Okavango Fan. Wetlands. 2003;23(2):357-375.
- Mendelsohn JM, vanderPost C, Ramberg L, MurrayHudson M, Wolski P, Mosepele K. Okavango Delta: Floods of Life. RAISON. 2010;Windhoek:1-143.