
Research article · 2025 · Full text
International Journal of Geography Geology and EnvironmentStratigraphic architecture and sequence stratigraphy of the cretaceous Benue trough
Volume 7(12) · Pages 156–158 · DOI: 10.22271/27067483.2025.v7.i12b.666 ↗
Research areasGeological formations and processesGeological Studies and ExplorationGeological and Geophysical Studies
Abstract
Author-writtenReconstructing the depositional history of intracratonic rift basins requires a sequence stratigraphic framework, yet the Cretaceous Benue Trough of Nigeria lacks a unified model integrating all sub-basins. This research established the stratigraphic architecture for six Cretaceous formations spanning the Lower, Middle, and Upper Benue Trough and the Abakaliki Anticlinorium. Outcrop sections from 32 localities were combined with well-log data from 14 boreholes to define depositional sequences, systems tracts, and bounding surfaces. Six third-order sequences were recognised, bounded by unconformities tied to Cenomanian through Maastrichtian sea-level events. Marine facies indices varied markedly between sub-basins, reaching 9.2 in the Abakaliki sector during Nkporo Shale deposition but dropping to 2.3 during Ajali Sandstone time. Sediment thickness partitioning among systems tracts revealed no single tract dominating across all formations, pointing to local tectonic controls superimposed on eustatic signals. The framework provides a basin-wide reference for hydrocarbon exploration.
Summary
Source-checkedPlain-language reading of the full paper, prepared with AI and checked against the text. Each point links to the authors' own words.
Why it matters
- The Benue Trough is an intracratonic rift that formed during the Early Cretaceous South Atlantic opening and contains up to 6,000 meters of sediment. View evidence ↗
- Research in Nigerian basins has been hindered by the lack of a unified sequence stratigraphic model that covers the entire Benue Trough. View evidence ↗
- Existing local stratigraphic frameworks for the Benue Trough sub-basins often contradict each other on key details like sequence counts and the placement of flooding surfaces. View evidence ↗
The question
- The study aimed to create a unified stratigraphic framework by integrating outcrop and well-log data to understand the relationship between tectonic and eustatic controls. View evidence ↗
What they did
- The researchers measured sections at 32 outcrop localities across four sub-basin divisions during field campaigns in 2021 and 2022. View evidence ↗
- The study utilized digitized well-log data from 14 NNPC boreholes. View evidence ↗
- Correlation panels were developed using three transects: a 340-km dip section, a 280-km along-strike section, and a 210-km section across the Upper Benue. View evidence ↗
- The researchers identified six third-order depositional sequences bounded by unconformities linked to sea-level events from the Cenomanian to the Maastrichtian. View evidence ↗
What they found
- Marine facies indices showed significant variation, peaking at 9.2 in the Abakaliki sector during Nkporo Shale deposition and falling to 2.3 during Ajali Sandstone deposition. View evidence ↗
- A reciprocal pattern of marine influence was found: the Lower Benue and Abakaliki peaked during Asu River and Nkporo times, whereas the Upper Benue peaked during Awgu and Ajali deposition. View evidence ↗
- No single systems tract dominated the entire basin; for example, the Asu River Group was 50% lowstand (LST) dominated, while the Awgu formation was 44% highstand (HST) dominated. View evidence ↗
- The observed stratigraphic asymmetries are best explained by a combination of tectonic and eustatic controls, specifically the Santonian inversion event around 84 Ma that redirected marine and sediment pathways. View evidence ↗
What it means
- The authors conclude that the best lowstand sandstone reservoirs are in the Lower Benue Asu River Group and Nkporo Shale, while the most continuous transgressive source-rock shales are in the Middle Benue Eze-Aku Formation. View evidence ↗
- The authors state that future research should include seismic data to better refine the subsurface geometry of sequence boundaries. View evidence ↗
Visual summary
3 visualsIllustrations explain the paper; charts are replotted from the paper's own table values.
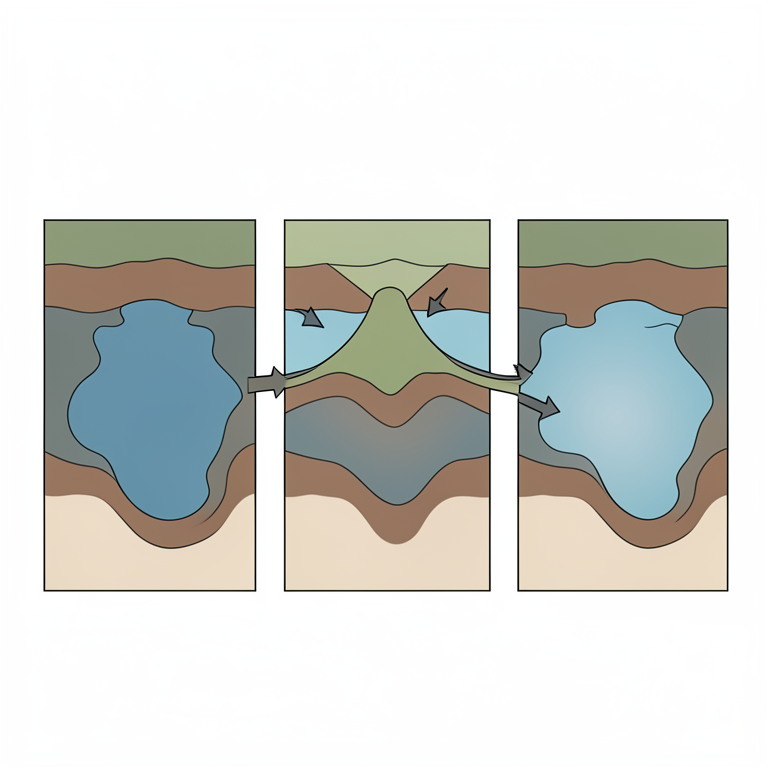
Reciprocal Marine Influence Model
AI-generated conceptual illustration (Cretaceous Benue Trough sedimentary basin). It explains the idea and does not show study data.
View source evidence ↗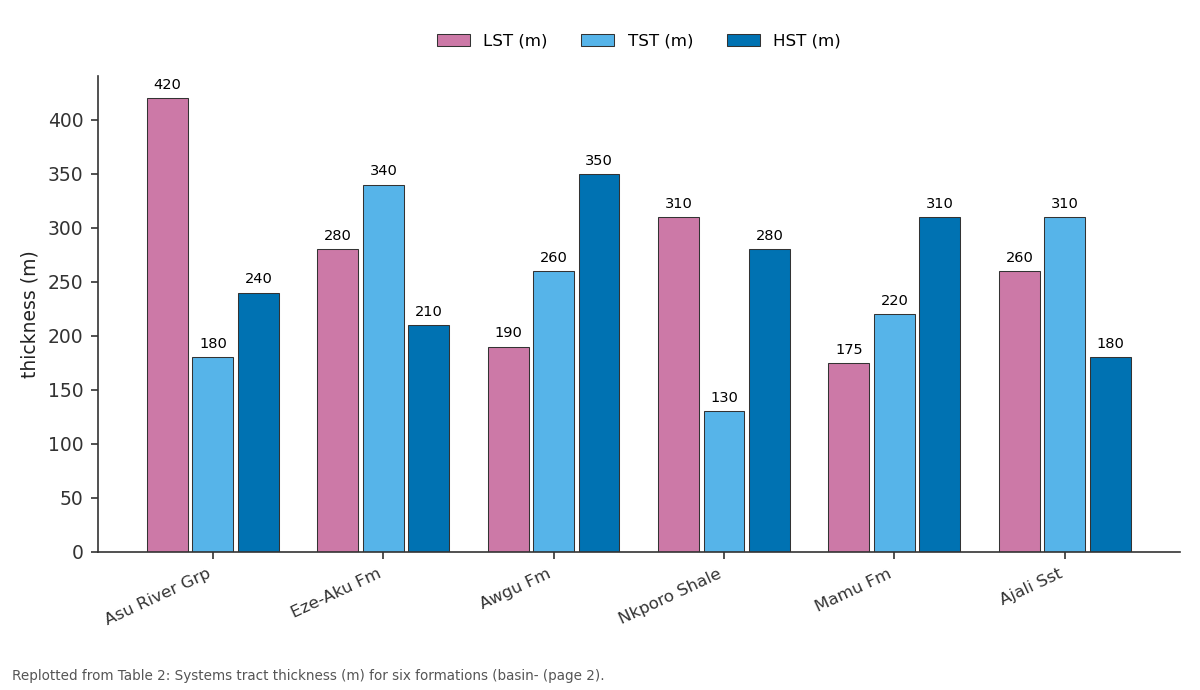
LST (m) and TST (m) and more: Asu River Grp vs Eze-Aku Fm vs Awgu Fm vs Nkporo Shale vs Mamu Fm
Replotted from Table 2 (page 2) of the original paper. Every bar is the paper's own table value.
View source evidence ↗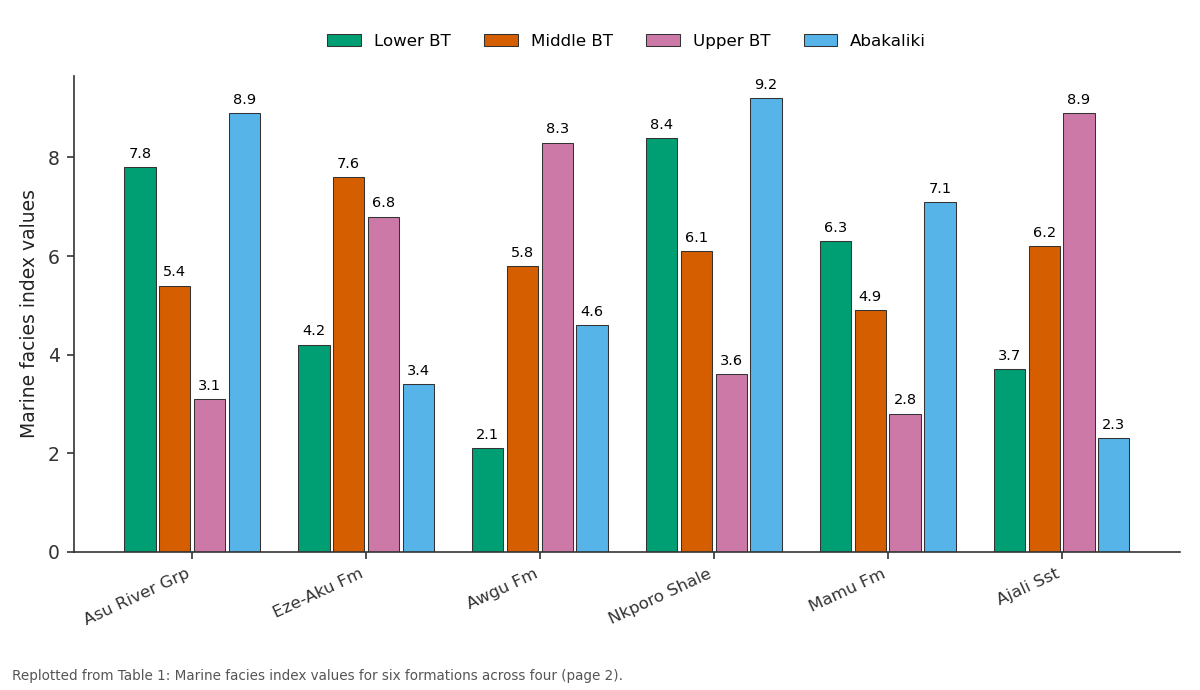
Lower BT and Middle BT and more: Asu River Grp vs Eze-Aku Fm vs Awgu Fm vs Nkporo Shale vs Mamu Fm
Replotted from Table 1 (page 2) of the original paper. Every bar is the paper's own table value.
View source evidence ↗Figures & tables
From the original paper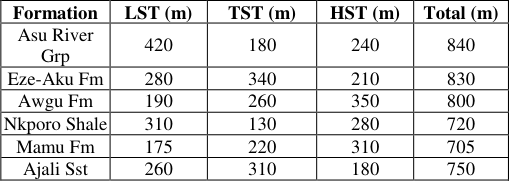 Table 2
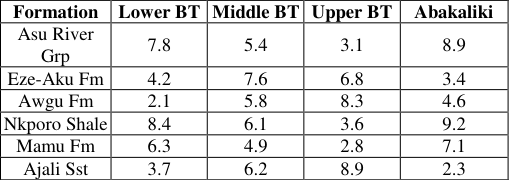 Table 1
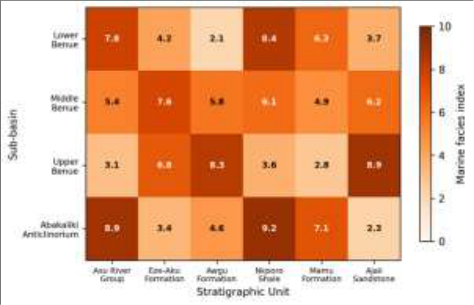 Figure 1
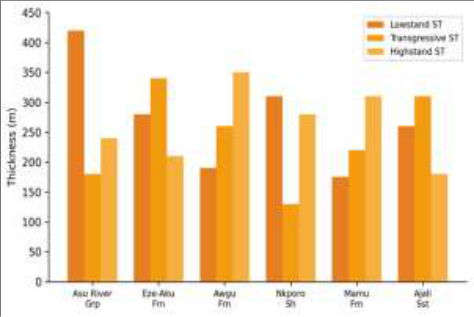 Figure 2
Introduction
A persistent problem in Nigerian basin research has been the absence of a coherent sequence stratigraphic model spanning the entire Benue Trough from its southern terminus near the Niger Delta to its northern extension toward the Chad Basin [1] . Individual workers have proposed local frameworks for specific sub-basins, but these often contradict one another regarding depositional sequence count, placement of maximum flooding surfaces, and significance of intra-Cretaceous unconformities [2] . The Benue Trough formed as an intracratonic rift during Early Cretaceous South Atlantic opening, accumulating up to 6,000 m of sediment from the Albian through the Maastrichtian [3] . It is divided into the Lower, Middle, and Upper Benue sub-basins, plus the Abakaliki Anticlinorium-a structurally inverted zone separating the Lower and Middle segments [4] . Sequence stratigraphy offers a framework to overcome correlation problems by identifying genetically related strata bounded by chronostratigraphically significant surfaces [5] . Nwajide [6] applied sequence concepts to parts of the Lower Benue, and Obaje et al. [7] proposed a framework for the Middle Benue. But neither attempted a basin-wide synthesis. Benkhelil [8] provided a tectonic overview connecting rifting phases to sedimentation but stopped short of formal sequence definition. This research aimed to construct a unified framework by integrating outcrop and well-log data, identifying bounding surfaces traceable across sub-basins, and interpreting the interplay between eustatic and tectonic controls.
Sequence Stratigraphic Model Framework
The analysis followed the depositional sequence model of Hunt and Tucker [9] , recognising lowstand (LST), transgressive (TST), highstand (HST), and falling-stage systems tracts. Sequence boundaries were placed at subaerial unconformities. Maximum flooding surfaces were identified from gamma-ray log peaks and faunal abundance maxima. The Haq et al. [10] global sea-level curve served as the chronostratigraphic reference for correlating third-order sequences.
Tectonic Scenario Analysis
Three scenarios were evaluated to explain thickness and facies asymmetries. Scenario 1 attributed variation to differential subsidence from basement fault reactivation during the Santonian inversion. Scenario 2 assumed uniform subsidence with variable sediment supply. Scenario 3 combined both mechanisms. Each was tested against observed systems tract thickness ratios across all 32 localities.
Material and Methods Material
The research was coordinated from the Centre for Terrain Studies, Hanoi, Vietnam. Sections were measured at 32 outcrop localities across four sub-basin divisions during field campaigns in June 2021 and February 2022. Bed-bybed logging recorded lithology, grain size, sedimentary structures, and fossil content. Published well-log data from 14 NNPC boreholes were digitised from Obaje [11] and Nwajide [6] .
Methods
Correlation panels were constructed along three transects: a 340-km dip section, a 280-km along-strike section through the Abakaliki Anticlinorium, and a 210-km section across the Upper Benue. Facies analysis grouped beds into 11 lithofacies associations from fluvial to outer shelf. A marine facies index (0-10) was computed per formation per subbasin. Systems tract identification combined stacking pattern analysis with gamma-ray log shape classification [12] . Marine facies indices showed a reciprocal pattern: the Lower Benue and Abakaliki peaked during Asu River and Nkporo times, while the Upper Benue reached maximum marine conditions during Awgu and Ajali deposition [13] .
Results
' No single systems tract dominated across all formations. The Asu River Group was LST-dominated (50%), while Awgu was HST-dominated (44%), supporting combined tectonic-eustatic control [14] .
Fig 2: Systems tract thickness distribution across six Cretaceous formations
The bar chart highlights the absence of a basin-wide dominant systems tract, consistent with Scenario 3 (combined tectonic-eustatic control).
Discussion
The six third-order sequences correspond with global sealevel events documented by Haq et al. [10] . The Cenomanian and Turonian transgressions match the two most prominent Cretaceous highstands. However, these transgressions reached different sub-basins at different intensities-the Upper Benue showing maximum marine influence during the Turonian while Abakaliki peaked earlier during the Albian-arguing for tectonic modulation of the eustatic signal [15] . Scenario 3 best explained the observed asymmetries. The Santonian inversion event, which folded and uplifted the Abakaliki Anticlinorium, redirected sediment routing and marine incursion pathways after roughly 84 Ma [8] . Before this event, Abakaliki received the deepest marine influence; after it, the Upper Benue became the main marine depocenter. The framework has direct exploration implications: LST sandstone reservoirs are best developed in the Lower Benue Asu River Group and Nkporo Shale, while TST source-rock shales are most continuous in the Middle Benue Eze-Aku Formation [16] .
Conclusion
This research established a unified sequence stratigraphic framework for the Cretaceous Benue Trough, identifying six third-order depositional sequences across four sub-basins. Marine facies indices revealed a reciprocal transgressive pattern between southern and northern arms, with the Santonian inversion as the pivot. Systems tract thickness analysis supported a combined tectonic-eustatic control model. The framework identifies Lower Benue lowstand sandstones and Middle Benue transgressive shales as the most persistent reservoir and source-rock targets. Future work should incorporate seismic data to refine subsurface geometry of sequence boundaries [17] .
Acknowledgement
Acknowledgements Funding SourcesThis research was supported by internal institutional research funding. Institutional SupportThe authors thank the Centre for Terrain Studies, Hanoi, for field logistics and laboratory access. Contributions Not Qualifying for AuthorshipStaff from the Nigerian Geological Survey Agency assisted with field access and outcrop identification.
Figures and tables from the paper
| Formation | LST (m) | TST (m) | HST (m) | Total (m) |
|---|---|---|---|---|
| Asu River Grp | 420 | 180 | 240 | 840 |
| Eze-Aku Fm | 280 | 340 | 210 | 830 |
| Awgu Fm | 190 | 260 | 350 | 800 |
| Nkporo Shale | 310 | 130 | 280 | 720 |
| Mamu Fm | 175 | 220 | 310 | 705 |
| Ajali Sst | 260 | 310 | 180 | 750 |
Table text extracted from the original PDF; superscript letters are shown inline. The original table image is below.
View original table image
| Formation | Lower BT | Middle BT | Upper BT | Abakaliki |
|---|---|---|---|---|
| Asu River Grp | 7.8 | 5.4 | 3.1 | 8.9 |
| Eze-Aku Fm | 4.2 | 7.6 | 6.8 | 3.4 |
| Awgu Fm | 2.1 | 5.8 | 8.3 | 4.6 |
| Nkporo Shale | 8.4 | 6.1 | 3.6 | 9.2 |
| Mamu Fm | 6.3 | 4.9 | 2.8 | 7.1 |
| Ajali Sst | 3.7 | 6.2 | 8.9 | 2.3 |
Table text extracted from the original PDF; superscript letters are shown inline. The original table image is below.
View original table image
References
17 in the original paper- Olade MA. Evolution of Nigeria's Benue Trough: a tectonic model. Earth Planet Sci Lett. 1975;25(3):287295.
- Murat RC. Stratigraphy and paleogeography of the Cretaceous and Lower Tertiary in southern Nigeria. In: Dessauvagie TFJ, editor. African Geology. Ibadan: Ibadan University Press; 1972. p. 251-266.
- Benkhelil J. The origin and evolution of the Cretaceous Benue Trough. J Afr Earth Sci. 1989;8(2-4):251-282.
- Nwajide CS. Geology of Nigeria's Sedimentary Basins. Lagos: CSS Bookshops; 2013.
- Catuneanu O. Principles of Sequence Stratigraphy. Amsterdam: Elsevier; 2006.
- Nwajide CS. A lithostratigraphic analysis of the Nanka Sands. Nig J Min Geol. 1979;16(2):103-109.
- Obaje NG, Wehner H, Scheeder G, Abubakar MB, Jauro A. Hydrocarbon prospectivity of Nigeria's inland basins. AAPG Bull. 2004;88(3):325-353.
- Benkhelil J. Structure et evolution geodynamique du bassin de la Benoue. Bull Centres Rech Explor-Prod Elf-Aquitaine. 1988;12(1):29-128.
- Hunt D, Tucker ME. Stranded parasequences and forced regressive wedge systems tract. Sediment Geol. 1992;81(1-2):1-9.
- Haq BU, Hardenbol J, Vail PR. Chronology of fluctuating sea levels since the Triassic. Science. 1987;235(4793):1156-1167.
- Obaje NG. Geology and Mineral Resources of Nigeria. Berlin: Springer; 2009.
- Van Wagoner JC, Posamentier HW, Mitchum RM, Vail PR, Sarg JF, Loutit TS. Fundamentals of sequence stratigraphy. SEPM Spec Publ. 1988;42:39-45.
- Petters SW. Central West African Cretaceous-Tertiary benthic foraminifera. Palaeontographica Abt A. 1982;179:1-104.
- Ladipo KO. Tidal shelf depositional model for the Ajali Sandstone. J Afr Earth Sci. 1986;5(2):177-185.
- Reyment RA. Aspects of the Geology of Nigeria. Ibadan: Ibadan University Press; 1965.
- Ekweozor CM, Gormly JR. Petroleum geochemistry of late Cretaceous and early Tertiary shales. J Petrol Geol. 1983;6(2):207-216.
- Ajayi CO, Ajakaiye DE. Origin and peculiarities of the Nigerian Benue Trough from gravity data. Tectonophysics. 1981;80(1-4):285-303.