
Research article · 2025 · Full text
International Journal of Geography Geology and EnvironmentAnalysis of glacier mass balance trends using geodetic methods in the Svalbard archipelago
Volume 7(11) · Pages 166–169 · DOI: 10.22271/27067483.2025.v7.i11c.694 ↗
Research areasCryospheric studies and observationsGeophysics and Gravity MeasurementsLandslides and related hazards
Abstract
Author-writtenThe Svalbard archipelago (74–81°N) contains approximately 34,000 km² of glacier ice and is a critical indicator for Arctic climate change. This research evaluates mass balance trends for 2003–2023 using geodetic methods comparing digital elevation models from ICESat, ICESat-2 satellite laser altimetry, and TanDEM-X radar interferometry. A total of 163 glacier basins covering over 90% of the glaciated area were analysed individually. The archipelago-wide geodetic mass balance averaged −7.2 ± 1.8 Gt/yr (specific: −0.21 ± 0.05 m w.e./yr), with pronounced spatial variability. Northwestern Spitsbergen glaciers experienced losses exceeding −1.5 m w.e./yr, while northeastern glaciers averaged −0.10 m w.e./yr. Several surge-type glaciers showed temporary upper-basin mass gains. The 2013–2023 rate exceeded 2003–2013 by 34%, driven by rising summer temperatures (positive degree days increased 18%) and warming ocean temperatures in western fjords. Tidewater glaciers (60% of area) contributed 68% of total loss, with submarine melting estimated at 40% of their mass loss. The total 144 Gt loss over 20 years equates to approximately 0.4 mm of global sea level rise. Continued satellite monitoring is essential for tracking Svalbard's evolving contribution to Arctic freshwater fluxes and global sea level.
Summary
Source-checkedPlain-language reading of the full paper, prepared with AI and checked against the text. Each point links to the authors' own words.
Why it matters
- The Svalbard archipelago is a key indicator for climate change in the Arctic, containing about 34,000 km² of glacier ice. View evidence ↗
- Glaciers in Arctic archipelagos are retreating widely because these regions are warming 2 to 3 times faster than the global average. View evidence ↗
- Tracking glacier trends is vital for predicting sea level rise and understanding how an annual meltwater flux of roughly 7 km³ affects Arctic marine ecosystems and nutrient supply. View evidence ↗
The question
- The study aims to quantify mass balance across 163 glacier basins, analyze acceleration trends, identify climatic and oceanic drivers, and evaluate the role of different glacier types. View evidence ↗
What they did
- The researchers used geodetic methods to evaluate mass balance from 2003 to 2023 by comparing digital elevation models from TanDEM-X and ICESat/ICESat-2 satellites. View evidence ↗
- The analysis was performed on 163 individual glacier basins, which represent more than 90% of the total glaciated area. View evidence ↗
- To convert volume changes to mass, the study assumed densities of 900 kg/m³ for ablation zones and 600 kg/m³ for accumulation zones. View evidence ↗
What they found
- The average geodetic mass balance for the entire archipelago was −7.2 ± 1.8 Gt/yr, with a specific balance of −0.21 ± 0.05 m w.e./yr. View evidence ↗
- Mass loss varied spatially, with northwestern Spitsbergen glaciers losing more than −1.5 m w.e./yr and northeastern glaciers averaging −0.10 m w.e./yr. View evidence ↗
- The rate of ice loss accelerated by 34% between the first decade (2003–2013) and the second (2013–2023), linked to an 18% increase in positive degree days and warmer ocean temperatures. View evidence ↗
- Tidewater glaciers, which make up 60% of the area, were responsible for 68% of the total mass loss, with submarine melting accounting for 40% of that loss. View evidence ↗
- The total loss of 144 Gt of ice over the 20-year period contributed approximately 0.4 mm to global sea level rise. View evidence ↗
- Small cirque glaciers exhibit the most negative specific balance and are at risk of disappearing completely within a few decades. View evidence ↗
What it means
- The authors conclude that ongoing satellite geodetic monitoring is necessary to track Svalbard's contribution to global sea level rise and Arctic freshwater fluxes. View evidence ↗
- The authors note that current models poorly represent ocean-glacier interactions, which makes projecting mass balance difficult given the importance of submarine melting. View evidence ↗
Visual summary
3 visualsIllustrations explain the paper; charts are replotted from the paper's own table values.
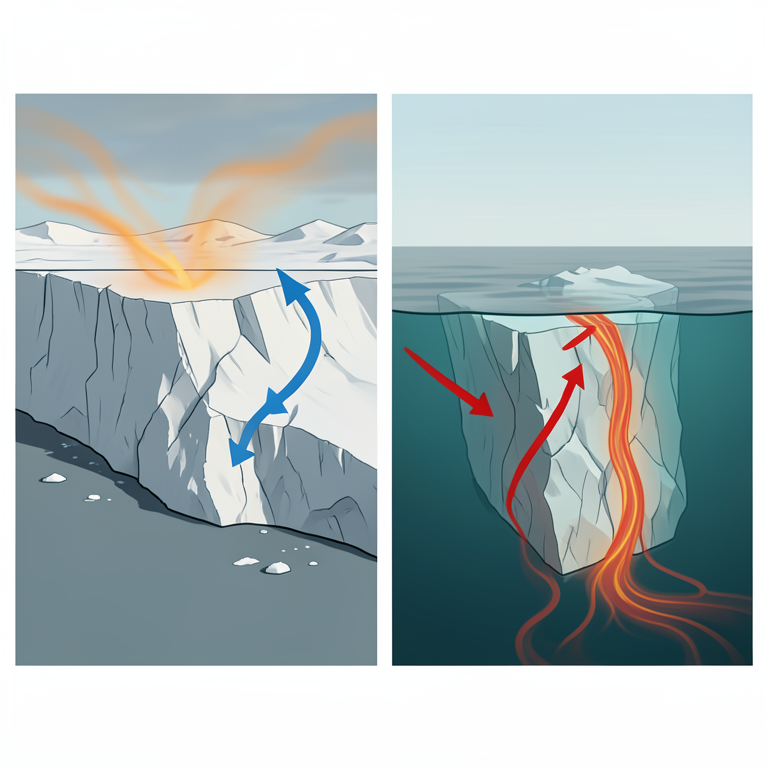
Drivers of Svalbard Ice Loss
AI-generated conceptual illustration (Tidewater glaciers in the Svalbard archipelago). It explains the idea and does not show study data.
View source evidence ↗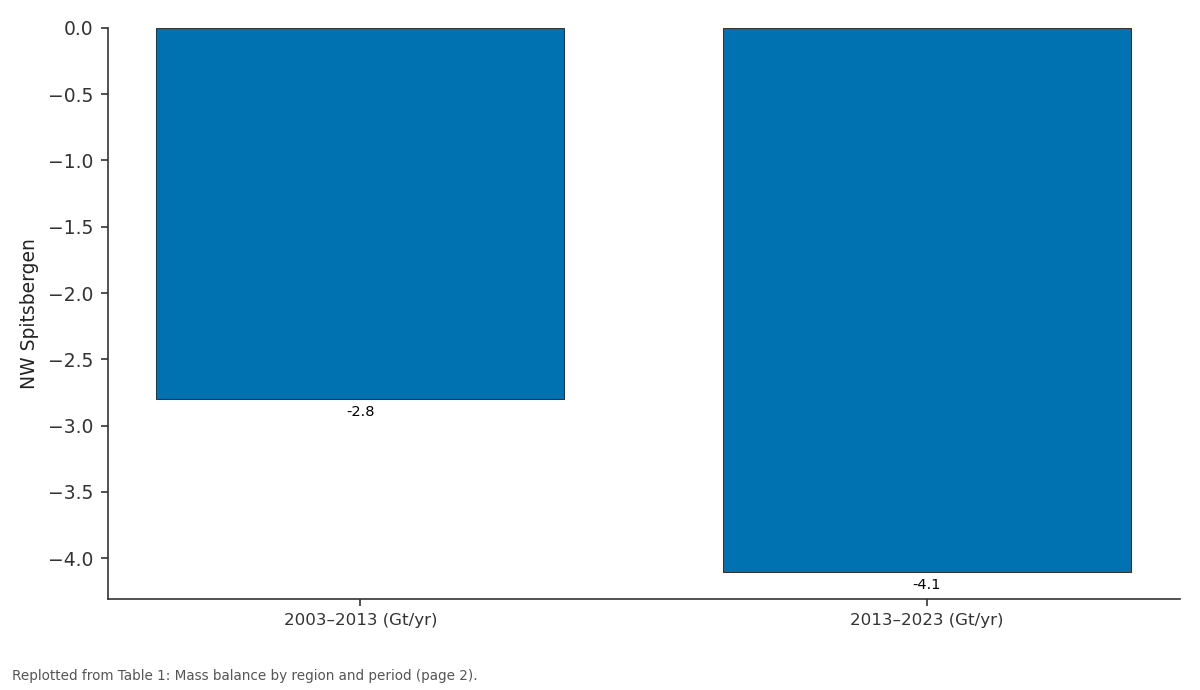
NW Spitsbergen: 2003–2013 (Gt/yr) vs 2013–2023 (Gt/yr)
Replotted from Table 1 (page 2) of the original paper. Every bar is the paper's own table value.
View source evidence ↗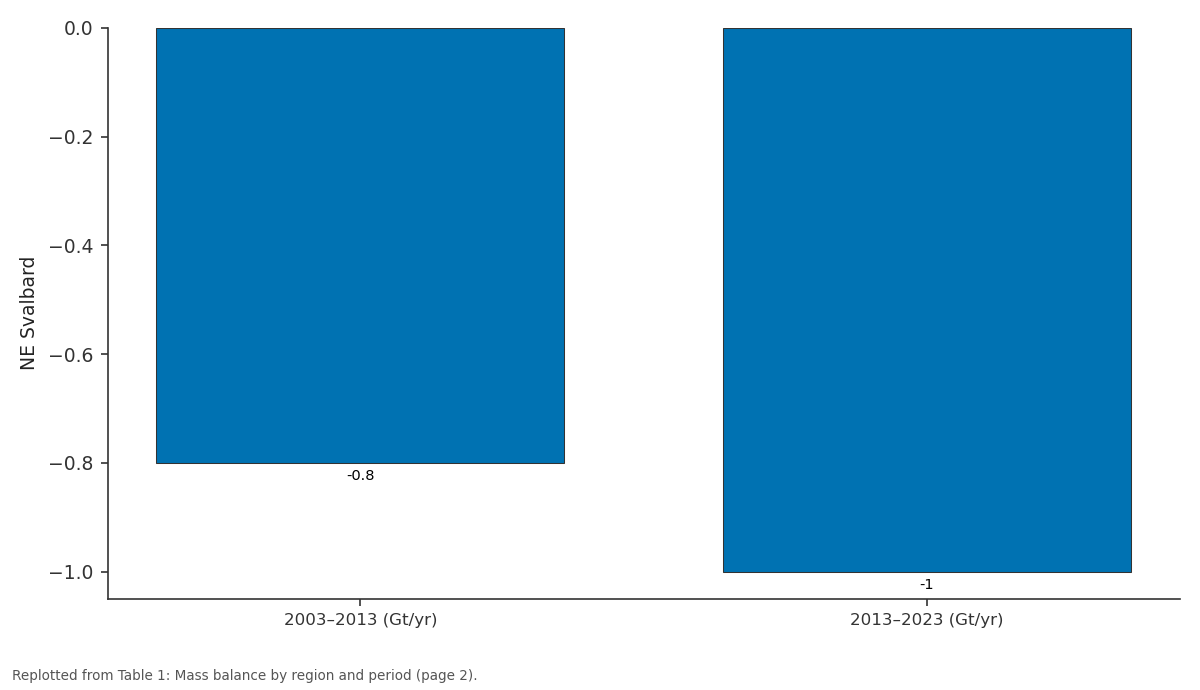
NE Svalbard: 2003–2013 (Gt/yr) vs 2013–2023 (Gt/yr)
Replotted from Table 1 (page 2) of the original paper. Every bar is the paper's own table value.
View source evidence ↗Figures & tables
From the original paper Table 1
 Table 2
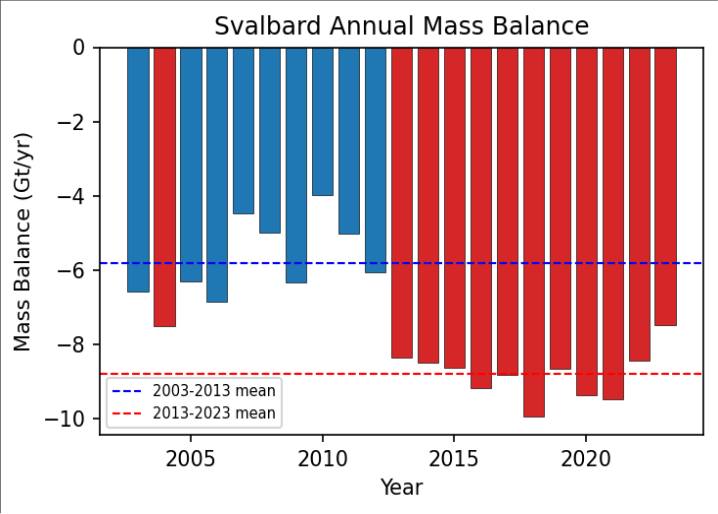 Figure 1
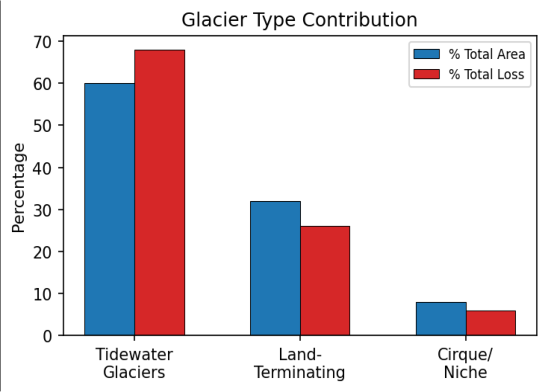 Figure 2
Introduction
Glaciers outside the Greenland and Antarctic ice sheets contain approximately 170,000 km³ of ice and are major contributors to ongoing sea level rise [1] . Arctic archipelagos are experiencing warming rates 2-3 times the global average, driving widespread glacier retreat [2] . Svalbard is particularly important: it contains diverse glacier types including cirques, valley glaciers, ice caps, and tidewater glaciers; has mass balance records extending to the 1960s; and is sensitive to North Atlantic Current heat transport changes [3,4] . Traditional in-situ mass balance measurements are available for only a handful of Svalbard glaciers and cannot cover the full archipelago. Geodetic methods that infer mass changes from ice surface elevation measurements offer comprehensive spatial coverage [5] . ICESat-2, launched in 2018, provides improved measurement precision and coverage compared to its predecessor, creating new opportunities for detailed geodetic assessment [6,7] . Previous geodetic estimates for Svalbard span shorter time periods or cover limited areas [4,8] . This research exploits the full 2003-2023 satellite elevation archive to produce a comprehensive 20-year assessment. The objectives are to quantify the magnitude and spatial variability of mass balance across 163 basins, examine temporal trends and acceleration, investigate climatic and oceanic drivers, and assess the contribution of different glacier types [9, 10] . Understanding these trends is essential not only for sea level projections but also for assessing the freshwater perturbation to Arctic marine ecosystems, as the approximately 7 km³ annual meltwater flux influences fjord circulation, vertical mixing, and nutrient supply with consequences for marine productivity [3,11] .
Research Area Description
Svalbard covers approximately 61,000 km², with 55% glaciated. The west coast is influenced by warm Atlantic water via the West Spitsbergen Current, while the eastern and northeastern portions experience colder Arctic conditions. Mean annual temperature at Longyearbyen has increased by approximately 4°C since 1971. Precipitation ranges from 200 to 800 mm/yr depending on location and elevation. The 163 analysed glacier basins span the full range of glacier types and climatic settings across the archipelago [1,3] .
Material and Methods
Material and Methods
Material
ICESat GLAS (2003-2009) provided elevation measurements with ~70 m footprint and ±15 cm vertical accuracy. ICESat-2 ATLAS (2018-2023) offered improved ~11 m footprint and ±10 cm accuracy. TanDEM-X global DEM (~2011-2014) provided spatially continuous elevation data bridging the two altimetry missions. ERA5 reanalysis at 0.25° resolution supplied surface air temperature and precipitation. Copernicus Marine data provided ocean temperature in adjacent fjord systems [6,7,12] .
Methods
Repeat-track analysis compared altimetry at crossover points with cross-track slope corrections from TanDEM-X. Regional elevation change-altitude regression models were fitted per basin to extrapolate point measurements to full glacier areas. Volume changes were converted to mass using 900 kg/m³ (ablation zone) and 600 kg/m³ (accumulation zone) following established density assumptions [5] . Surgetype glaciers were identified and treated separately. Summer temperature indices and ocean temperatures were analysed as potential drivers [8,9] .
Submarine Melting and Freshwater Fluxes
The residual between total geodetic loss and modelled surface mass balance was attributed to submarine melting and calving, accounting for approximately 40% of tidewater glacier mass loss. This is consistent with warming subsurface waters in western Spitsbergen fjords, where Atlantic-derived water at 3-5°C has increased its penetration over the past two decades. The annual meltwater flux of approximately 7 km³ concentrated from June to September can influence fjord circulation, suppress vertical mixing, and alter nutrient supply to surface waters [3,11,13] . The 34% acceleration from the first to second decade is evident (Figure 1), with dashed lines indicating decadal means. Years with exceptionally warm summers (e.g. 2016, 2020) show the most negative balances.
Results
Results
Comprehensive Interpretation
The spatial pattern of mass loss-most rapid in northwestern Spitsbergen-reflects exposure to warm Atlantic-derived waters. The temporal acceleration is primarily driven by increased surface melting (positive degree days rose 18%) supplemented by ocean warming in western fjords. Surge-type glacier behaviour locally complicates the signal but does not alter the archipelagowide trend.
Discussion
The -7.2 Gt/yr estimate is broadly consistent with GRACE gravimetric estimates [1,4] . The 144 Gt total loss equates to approximately 0.4 mm global sea level rise-modest individually but significant when combined with contributions from other Arctic glacier regions. The growing importance of submarine melting presents challenges for mass balance projections, as ocean-glacier interactions are poorly represented in current models [8,13] . The freshwater perturbation from accelerating mass loss has potential ecosystem consequences through altered fjord stratification and nutrient cycling [11] . Future work should extend the analysis to include calving flux measurements from satellite imagery time series and develop coupled ocean-glacier models that can project marine-terminating glacier evolution under warming ocean scenarios [10,14] .
Conclusion
Svalbard is losing ice at approximately 7.2 Gt/yr with significant 34% acceleration over the past decade. Tidewater glaciers contribute disproportionately through both surface melting and submarine/calving losses. The spatial pattern reflects combined atmospheric warming and ocean thermal forcing. Continued satellite geodetic monitoring is essential for tracking the evolving contribution to Arctic freshwater fluxes and global sea level rise. The identification of submarine melting as a major mass loss component highlights the need for ocean temperature monitoring in glaciated fjords. Small cirque glaciers face the most imminent threat of complete disappearance, representing irreversible loss of ice mass and the freshwater, habitat, and landscape values they provide.
Acknowledgement
Acknowledgements
Figures and tables from the paper
| Region | 2003–2013 (Gt/yr) | 2013–2023 (Gt/yr) | Change (%) |
|---|---|---|---|
| NW Spitsbergen | −2.8 | −4.1 | +46 |
| NE Svalbard | −0.8 | −1.0 | +25 |
| SE Svalbard | −1.2 | −1.8 | +50 |
| S Spitsbergen | −1.0 | −1.7 | +70 |
| Total Svalbard | −5.8 | −8.6 | +34 |
Table text extracted from the original PDF; superscript letters are shown inline. The original table image is below.
View original table image
| Glacier Type | % Total Area | % Total Loss | Specific Balance (m w.e./yr) |
|---|---|---|---|
| Tidewater | 60 | 68 | −0.27 |
| Land-terminating | 32 | 26 | −0.17 |
| Cirque/Niche | 8 | 6 | −0.35 |
Table text extracted from the original PDF; superscript letters are shown inline. The original table image is below.
View original table image
References
17 in the original paper- Zemp M, Huss M, Thibert E, et al. Global glacier mass changes and contributions to sea-level rise. Nature. 2019;568(7752):382-386.
- Box JE, Colgan WT, Christensen TR, et al. Key indicators of Arctic climate change: 1971-2017.
- Błaszczyk M, Jania JA, Hagen JO. Tidewater glaciers of Svalbard: recent changes and estimates of calving fluxes. Pol Polar Res. 2009;30(2):85-142.
- Nuth C, Moholdt G, Kohler J, Hagen JO, Kääb A. Svalbard glacier elevation changes and contribution to sea level rise. J Geophys Res. 2010;115:F01008.
- Huss M. Density assumptions for converting geodetic glacier volume change to mass change. Cryosphere. 2013;7(3):877-887.
- Markus T, Neumann T, Martino A, et al. The Ice, Cloud, and land Elevation Satellite-2 (ICESat-2): science requirements. Remote Sens Environ. 2017;190:260-273.
- Smith B, Fricker HA, Gardner AS, et al. Pervasive ice sheet mass loss reflects competing ocean and atmosphere forcing. Science. 2020;368(6496):12391242.
- Moholdt G, Nuth C, Hagen JO, Kohler J. Recent elevation changes of Svalbard glaciers derived from ICESat laser altimetry. Remote Sens Environ. 2010;114(11):2756-2767.
- Nuth C, Kääb A. Co-registration and bias corrections of satellite elevation data sets. Cryosphere. 2011;5(1):271290.
- Hagen JO, Kohler J, Melvold K, Winther JG. Glaciers in Svalbard: mass balance, runoff and freshwater flux. Polar Res. 2003;22(2):145-159.
- Lydersen C, Assmy P, Falk-Petersen S, et al. The importance of tidewater glaciers for marine mammals and seabirds in Svalbard. J Mar Syst. 2014;129:452471.
- Krieger G, Moreira A, Fiedler H, et al. TanDEM-X: a satellite formation for high-resolution SAR interferometry. IEEE Trans Geosci Remote Sens. 2007;45(11):3317-3341.
- Luckman A, Benn DI, Cottier F, et al. Calving rates at tidewater glaciers vary strongly with ocean temperature. Nat Commun. 2015;6:8566.
- Schuler TV, Kohler J, Elagina N, et al. Reconciling Svalbard glacier mass balance. Front Earth Sci. 2020;8:156.
- Wouters B, Gardner AS, Moholdt G. Global glacier mass loss during the GRACE satellite mission. Front Earth Sci. 2019;7:96.
- Lang C, Fettweis X, Erpicum M. Stable climate and surface mass balance in Svalbard over 1979-2013. Cryosphere. 2015;9(1):83-101.
- Isaksen K, Nordli O, Forland EJ, et al. Recent warming on Spitsbergen. J Geophys Res Atmos. 2016;121(20):11913-11931.