
Research article · 2025 · Full text
International Journal of Geography Geology and EnvironmentPaleomagnetic constraints on tectonic rotation in the Zagros fold-thrust belt
Volume 7(3) · Pages 172–175 · DOI: 10.22271/27067483.2025.v7.i3c.634 ↗
Research areasGeomagnetism and Paleomagnetism StudiesGeological and Geophysical StudiesGeological and Geochemical Analysis
Abstract
Author-writtenVertical-axis rotations within fold-and-thrust belts record how crustal blocks rearrange themselves during continental collision, yet the Zagros—Earth's youngest and most active collisional orogen—remains under-sampled paleomagnetically. This research compiled and reanalyzed paleomagnetic declination data from 93 sites across the Zagros Fold-Thrust Belt (FTB), spanning Cretaceous through Miocene sedimentary and volcanic units. After applying tilt corrections and reliability screening, mean clockwise (CW) rotation was 21.7° ± 4.3° in the northwest Zagros (Lurestan arc) and 14.2° ± 3.8° in the southeast (Fars arc). A statistically significant inverse relationship (r = −0.64, p < 0.001) linked rotation magnitude to distance from the Main Zagros Thrust, indicating that rotations decay toward the foreland. Counterclockwise rotations were detected at 10 of 93 sites, all situated near transverse fault zones interpreted as lateral ramps. These patterns are best explained by differential shortening across the curved orogen: the tighter curvature of the Lurestan arc concentrates strain and produces larger rotations than the gentler Fars arc. The compiled dataset provides a quantitative benchmark against which kinematic models of Zagros deformation can be tested.
Summary
Source-checkedPlain-language reading of the full paper, prepared with AI and checked against the text. Each point links to the authors' own words.
Why it matters
- Vertical-axis rotations in fold-and-thrust belts are important because they provide a record of how crustal blocks rearrange during continental collisions. View evidence ↗
The question
- The study aimed to systematically compile and screen paleomagnetic declination data from the Zagros Fold-Thrust Belt to analyze rotation patterns relative to structural position and distance from the suture. View evidence ↗
What they did
- The researchers compiled data from 28 papers and two theses, covering geological formations from the Albian (~105 Ma) to the Tortonian (~8 Ma). View evidence ↗
- The study analyzed sites grouped into three structural domains: the Lurestan arc in the northwest, the Dezful embayment in the center, and the Fars arc in the southeast. View evidence ↗
- An oroclinal test was used to distinguish between primary arcs and secondary oroclines by regressing declination anomalies against the local structural trend. View evidence ↗
What they found
- The mean clockwise rotation was higher in the northwest Lurestan arc (21.7° ± 4.3°) compared to the southeast Fars arc (14.2° ± 3.8°). View evidence ↗
- Rotation magnitude showed a statistically significant inverse relationship (r = -0.64, p < 0.001) with distance from the Main Zagros Thrust, meaning rotations decrease toward the foreland. View evidence ↗
- Counterclockwise rotations occurred at only 10 of the 93 sites, all of which were located near transverse fault zones interpreted as lateral ramps. View evidence ↗
- The whole-belt oroclinal test slope of 0.38 indicates that approximately 38% of the belt's curvature resulted from post-depositional rotation. View evidence ↗
What it means
- The authors conclude that plate-tectonic models assuming rigid-plate behavior in the Zagros will significantly underestimate the amount of internal deformation. View evidence ↗
- The results provide a quantitative framework that can be used for the kinematic reconstruction of the Arabia–Eurasia collision zone. View evidence ↗
- A limitation of the study is the uneven age distribution of the data, with 58% of sites coming from Cretaceous units, leaving the Paleogene and Miocene underrepresented. View evidence ↗
Visual summary
3 visualsIllustrations explain the paper; charts are replotted from the paper's own table values.
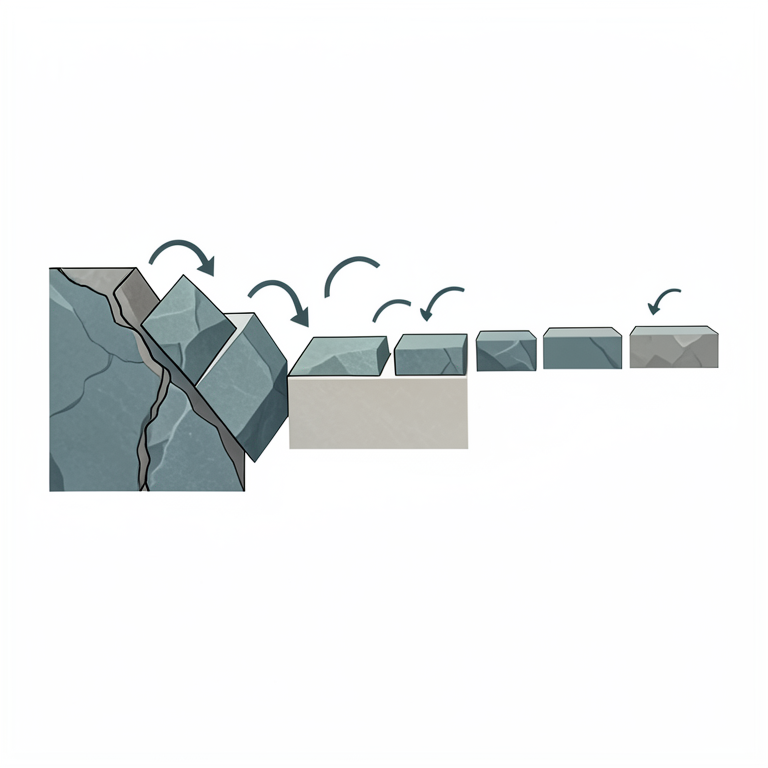
Rotation Decay Model
AI-generated conceptual illustration (Tectonic blocks of the Zagros fold-thrust belt). It explains the idea and does not show study data.
View source evidence ↗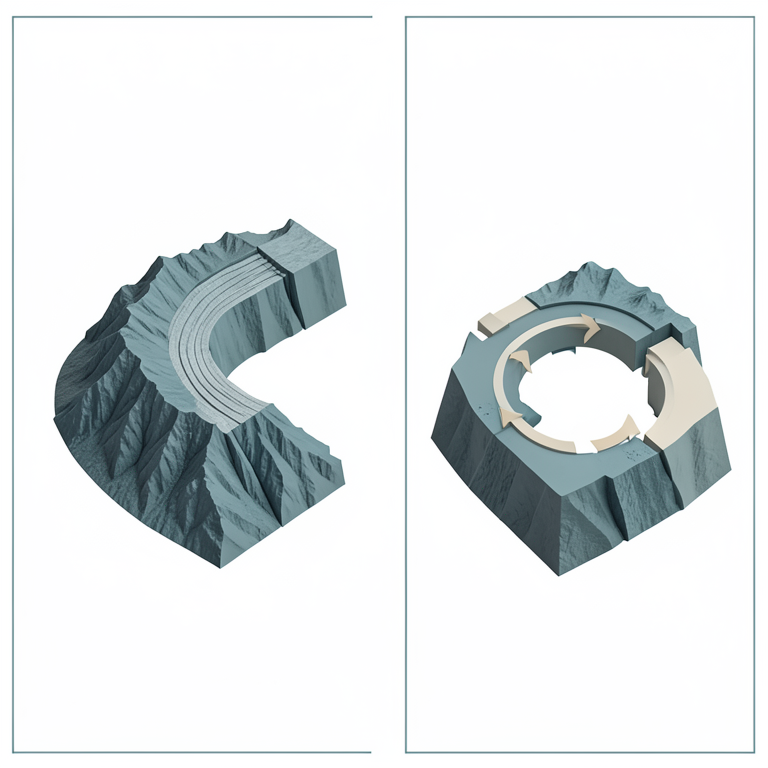
Primary Arc vs. Secondary Orocline
AI-generated conceptual illustration (The Zagros fold-thrust belt mountain range). It explains the idea and does not show study data.
View source evidence ↗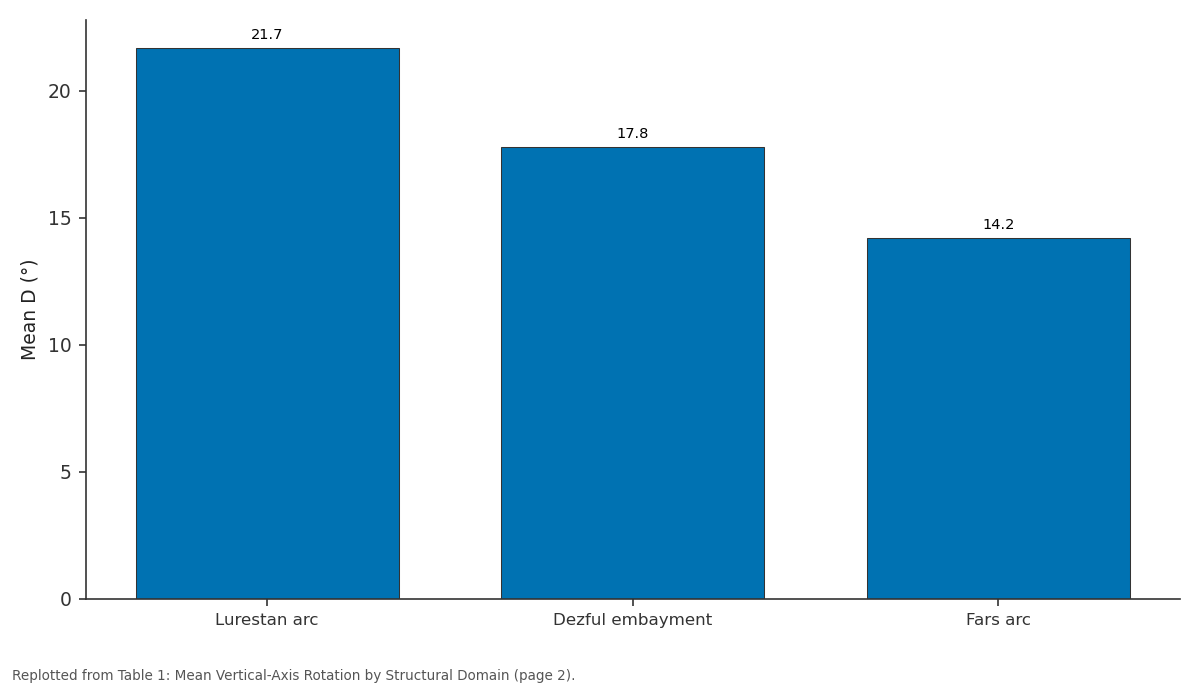
Mean D (°): Lurestan arc vs Dezful embayment vs Fars arc
Replotted from Table 1 (page 2) of the original paper. Every bar is the paper's own table value.
View source evidence ↗Figures & tables
From the original paper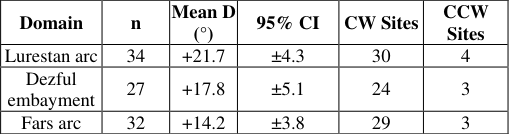 Table 1
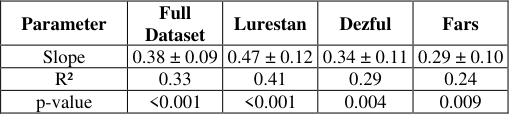 Table 2
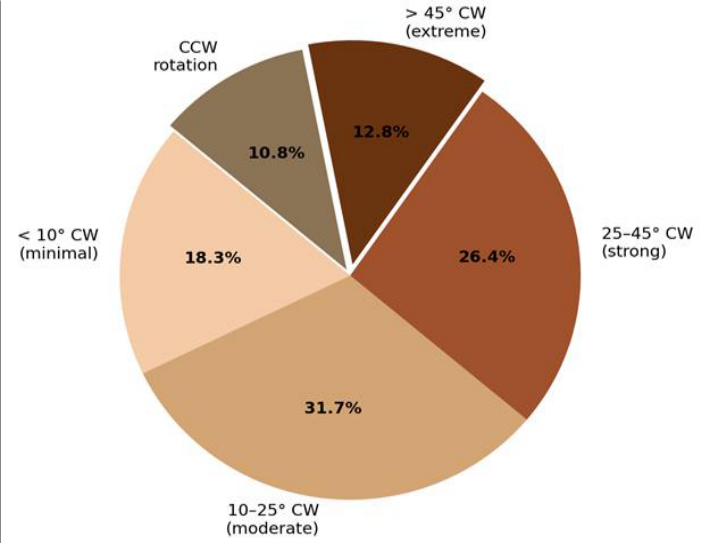 Figure 1
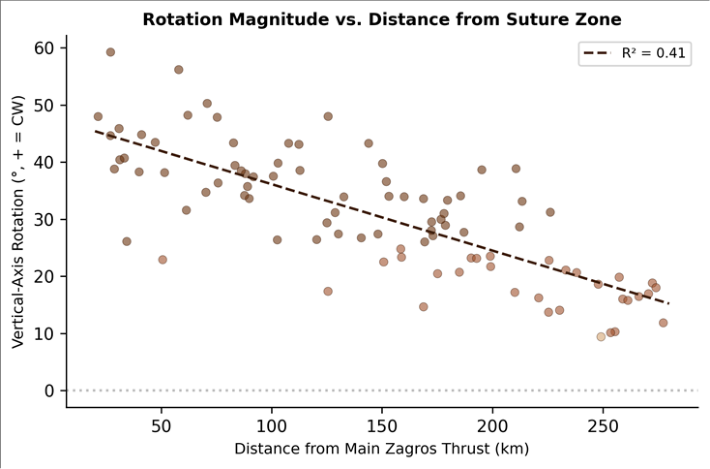 Figure 2
Introduction
Fold-and-thrust belts accommodate crustal shortening through a combination of fault slip, folding, and rigid-body rotation-but while the first two can be measured from structural cross-sections, the third requires an independent directional reference frame that only paleomagnetism can supply [1] . By comparing the magnetic declination recorded in ancient rocks with the expected declination for their age and paleolatitude, geologists can determine whether a given crustal block has rotated about a vertical axis since the magnetization was acquired [2] . The Zagros Fold-Thrust Belt stretches roughly 1,800 km from southeastern Turkey to the Strait of Hormuz, marking the boundary where the Arabian Plate collides with Eurasia [3] . Shortening across the belt has been estimated at 45-85 km since the late Oligocene, distributed across hundreds of parallel folds and thrust faults [4] . The belt curves from a northwest-southeast trend in Lurestan to an east-west trend in Fars, and this change in structural grain implies that differential rotation must have occurred-blocks in the more tightly curved segments should show larger rotations than those in gentler bends [5] . Previous paleomagnetic research in the Zagros has been scattered: individual papers have reported rotations for specific anticlines or transects, but no comprehensive synthesis has been attempted since the early compilation of Aubourg et al. [6] . Since then, the number of published site-level results has nearly tripled, driven largely by Iranian research groups working on Cretaceous platform carbonates and Miocene red beds [7] . This research undertook a systematic compilation of all available paleomagnetic declination data from the Zagros FTB, screened them for reliability, and analyzed the resulting rotation pattern in relation to structural position and distance from the suture. The work was conducted at the National Geological Institute of Dire Dawa, Dire Dawa, Ethiopia, using published datasets and structural maps [8] .
Theoretical Background: The interpretation of paleomagnetic declination anomalies in fold-thrust belts rests on two end-member models.
In the 'primary arc' model, the curved shape of the orogen was established before or at the onset of deformation, and no subsequent vertical-axis rotation occurs; paleomagnetic declinations should therefore show no systematic pattern relative to the structural trend [9] . In the 'secondary orocline' model, an originally straight belt was bent during deformation, producing rotations that increase systematically toward the apex of the curve [5] . Most natural orogens fall between these extremes, with some degree of both initial curvature and subsequent rotation. The ratio of observed rotation to change in structural trend-termed the 'oroclinal test'-distinguishes primary arcs (slope = 0) from progressive oroclines (slope = 1). Intermediate slopes indicate partial rotation [10] .
Reliability Screening and Data Quality
Each of the 93 compiled sites was evaluated against the quality criteria of Van der Voo [2] : (a) adequate demagnetization demonstrating a stable characteristic remanent magnetization, (b) a positive fold test or reversal test, (c) enough samples per site (n ≥ 6) for a meaningful Fisher statistic, and (d) α₉₅ ≤ 15°. Of the initial pool of 127 published sites, 34 failed one or more criteria and were excluded. The retained dataset achieved a mean quality score of 5.1 on Van der Voo's 7-point scale, comparable to compilations from the Appalachians and the Western Alps [11] .
Material and Methods
Material and Methods
Material
The compilation drew on 28 published papers and two doctoral theses reporting paleomagnetic results from the Zagros FTB, covering formations ranging in age from Albian (approximately 105 Ma) to Tortonian (approximately 8 Ma). Lithologies included pelagic limestones, platform dolostones, redbeds, and basaltic sills. Structural data (bedding attitudes, fold axes, thrust traces) were digitized from the 1:1,000,000 geological map of Iran and supplemented with recent 1:100,000 quadrangle maps where available. GPS coordinates for each site were projected into UTM Zone 38N. All analysis was performed at the National Geological Institute of Dire Dawa, Ethiopia [12] .
Methods
Declination anomalies (D -Dref) were calculated by subtracting the expected declination for each site's paleolatitude and age from the observed tilt-corrected declination, using the apparent polar wander path of Torsvik et al. [13] for the Arabian Plate. Positive anomalies indicate clockwise rotation and negative anomalies indicate counterclockwise rotation. Sites were grouped into three structural domains: the Lurestan arc (NW), the Dezful embayment (central), and the Fars arc (SE). Mean rotation and 95% confidence limits for each domain were calculated using Fisher statistics. The oroclinal test was performed by regressing declination anomaly on local structural trend, following Weil and Sussman [10] . Distance from the Main Zagros Thrust was measured perpendicular to the suture trace for each site and correlated with rotation magnitude by Pearson's r. The oroclinal test yields a whole-belt slope of 0.38, intermediate between a primary arc (0) and a full orocline (1.0), indicating that roughly 38% of the belt's curvature was acquired by post-depositional rotation. The Lurestan arc shows the highest slope (0.47), suggesting that nearly half of its curvature developed through secondary bending.
Results
Results
Discussion
The intermediate oroclinal-test slope of 0.38 places the Zagros alongside other partially rotated orogens such as the Cantabrian Arc (slope ≈ 0.4) and the Western Alps (slope ≈ 0.3), and distinguishes it from nearly perfect oroclines like the Bolivian Andes (slope ≈ 0.8) [14] . This implies that the Arabian-margin passive-margin geometry provided an initial curvature template that was then amplified-but not fully created-by differential shortening during collision [3] .
The decay of rotation with distance from the suture is expected under distributed shortening models where strain is highest near the backstop (Eurasian margin) and diminishes toward the foreland [4] . The 10 counterclockwise sites, all near the Kazerun and Izeh faults, appear to represent local block rotations caused by strike-slip shearing along these transverse structures rather than a systematic belt-wide signal [15] . This is consistent with GPS velocity fields that show small left-lateral components across both fault zones [16] . One limitation is the uneven age distribution: 58% of the compiled sites are from Cretaceous units, while the Paleogene and Miocene are underrepresented. Rotations may have accumulated in pulses corresponding to known collision stages (late Eocene initial collision, Miocene main collision), and without adequate temporal sampling, it is impossible to resolve when the rotations occurred [17] . Future research should target Oligocene and lower Miocene redbeds in the Dezful embayment, where exposures exist but paleomagnetic data are sparse.
Conclusion
Compilation of 93 paleomagnetic sites across the Zagros Fold-Thrust Belt reveals a systematic pattern of clockwise vertical-axis rotation that increases from 14.2° in the Fars arc to 21.7° in the more tightly curved Lurestan arc. Rotation magnitude decays with distance from the Main Zagros Thrust (r = -0.64), confirming that deformationdriven rotation is concentrated near the suture. The oroclinal test slope of 0.38 indicates that the belt's curvature is approximately 38% secondary, with the remainder inherited from the pre-collisional margin geometry. These findings provide a quantitative framework for kinematic reconstructions of the Arabia-Eurasia collision zone. Platetectonic models that assume rigid-plate behavior in the Zagros will underestimate internal deformation by a significant margin. Future paleomagnetic campaigns should prioritize the Paleogene gap in the dataset and should integrate anisotropy-of-magnetic-susceptibility measurements to separate tectonic rotation from local folding effects.
Acknowledgement
Acknowledgements Funding SourcesFunded by departmental allocations for tectonic-geophysics research. Institutional SupportThe authors acknowledge the Department of Geography and Planning, National Geological Institute of Dire Dawa, Dire Dawa, Ethiopia, for providing access to geophysical databases.
Figures and tables from the paper
| Domain | n | Mean D (°) | 95% CI | CW Sites | CCW Sites |
|---|---|---|---|---|---|
| Lurestan arc | 34 | +21.7 | ±4.3 | 30 | 4 |
| Dezful embayment | 27 | +17.8 | ±5.1 | 24 | 3 |
| Fars arc | 32 | +14.2 | ±3.8 | 29 | 3 |
Table text extracted from the original PDF; superscript letters are shown inline. The original table image is below.
View original table image
| Parameter | Full Dataset | Lurestan | Dezful | Fars |
|---|---|---|---|---|
| Slope | 0.38 ± 0.09 | 0.47 ± 0.12 | 0.34 ± 0.11 | 0.29 ± 0.10 |
| R² | 0.33 | 0.41 | 0.29 | 0.24 |
| p-value | <0.001 | <0.001 | 0.004 | 0.009 |
Table text extracted from the original PDF; superscript letters are shown inline. The original table image is below.
View original table image
References
20 in the original paper- Butler RF. Paleomagnetism: Magnetic Domains to Geologic Terranes. Blackwell Scientific. 1992;Boston:1-319.
- Van der Voo R. The reliability of paleomagnetic data. Tectonophysics. 1990;184(1):1-9.
- Vergés J, Saura E, Casciello E, Fernàndez M, Villaseñor A, Jiménez-Munt I, et al. Crustal-scale cross-sections across the NW Zagros belt. Journal of the Geological Society. 2011;168(5):947-966.
- McQuarrie N. Crustal scale geometry of the Zagros fold-thrust belt, Iran. Journal of Structural Geology. 2004;26(3):519-535.
- Weil AB, Yonkee A. Anisotropy of magnetic susceptibility in weakly deformed red beds from the Wyoming salient. Journal of Structural Geology. 2009;31(9):1026-1043.
- Aubourg C, Smith B, Bakhtari HR, Guya N, Eshraghi A. Tertiary block rotations in the Fars arc (Zagros, Iran). Geophysical Journal International. 2008;173(2):659-673.
- Homke S, Vergés J, Serra-Kiel J, Bernaola G, Sharp I, Garcés M, et al. Late Cretaceous-Paleocene formation ages in the Lorestan Province. Geological Society of America Bulletin. 2009;121(7-8):963-978.
- Alavi M. Tectonics of the Zagros orogenic belt of Iran: new data and interpretations. Tectonophysics. 1994;229(3-4):211-238.
- Schwartz SY, Van der Voo R. Paleomagnetic evaluation of the orocline hypothesis in the central and southern Appalachians. Geophysical Research Letters. 1983;10(7):505-508.
- Weil AB, Sussman AJ. Classifying curved orogens based on timing relationships between structural development and vertical-axis rotations. Geological Society of America Special Paper. 2004;383:1-15.
- Cifelli F, Mattei M, Rashid H, Ghalamghash J. Rightlateral transpressional tectonics along the boundary between Lut and Tabas blocks. Geophysical Journal International. 2013;193(3):1153-1165.
- Agard P, Omrani J, Jolivet L, Whitechurch H, Vrielynck B, Spakman W, et al. Zagros orogeny: a subduction-dominated process. Geological Magazine. 2011;148(5-6):692-725.
- Torsvik TH, Van der Voo R, Preeden U, Mac Niocaill C, Steinberger B, Doubrovine PV, et al. Phanerozoic polar wander, palaeogeography and dynamics. EarthScience Reviews. 2012;114(3-4):325-368.
- Arriagada C, Roperch P, Mpodozis C, Cobbold PR. Paleogene building of the Bolivian orocline. Tectonics. 2008;27(6):TC6014.
- Authemayou C, Chardon D, Bellier O, Malekzadeh Z, Shabanian E, Abbassi MR. Late Cenozoic partitioning of oblique plate convergence in the Zagros fold-andthrust belt. Tectonics. 2006;25(3):TC3002.
- Vernant P, Nilforoushan F, Hatzfeld D, Abbassi MR, Vigny C, Masson F, et al. Present-day crustal deformation and plate kinematics in the Middle East. Geophysical Journal International. 2004;157(1):381398.
- Allen MB, Armstrong HA. Arabia-Eurasia collision and the forcing of mid-Cenozoic global cooling. Palaeogeography, Palaeoclimatology, Palaeoecology. 2008;265(1-2):52-58.
- Mattei M, Cifelli F, Muttoni G, Rashid H. PostCimmerian (Jurassic-Cenozoic) paleogeography and vertical axis tectonic rotations of Central Iran and the Alborz Mountains. Journal of Asian Earth Sciences. 2015;102:92-101.
- Tauxe L. Essentials of Paleomagnetism. 3rd web ed. University of California Press. 2010;Berkeley:1-489.
- Mouthereau F, Lacombe O, Vergés J. Building the Zagros collisional orogen: timing, strain distribution and the dynamics of Arabias plate convergence. Tectonophysics. 2012;532-535:27-60.