
Research article · 2025 · Full text
International Journal of Geography Geology and EnvironmentGeographic accessibility analysis of clean water sources in rural Sub-Saharan communities
Volume 7(10) · Pages 157–161 · DOI: 10.22271/27067483.2025.v7.i10b.648 ↗
Research areasWater Resource Management and QualityWater Quality and Resources StudiesEnvironmental Science and Water Management
Abstract
Author-writtenAn estimated 319 million people in Sub-Saharan Africa still lack access to a basic drinking water source, according to figures published before 2024. This research assessed the geographic accessibility of clean water sources across six rural sub-regions in Sub-Saharan Africa using GIS-based network analysis and household survey data collected between January 2020 and December 2022. A total of 347 water points were mapped across parts of West Africa (Ghana, Burkina Faso), East Africa (Kenya, Tanzania), Central Africa (Democratic Republic of Congo), and Southern Africa (Malawi). Accessibility was measured as the travel time from household clusters to the nearest improved water source, with a 30-minute one-way threshold used as the benchmark following Joint Monitoring Programme guidelines. The research found that 41.8% of surveyed households exceeded this threshold during the dry season, compared with 26.3% during peak wet-season months. Protected wells and boreholes together accounted for 46.7% of all mapped sources, while unprotected springs and river intakes made up 38.3%. Spatial clustering analysis (Getis-Ord Gi*) identified statistically significant cold spots of low accessibility in the Sahel zone of West Africa and lowland areas of East Africa, where mean travel times reached 53.7 minutes during dry periods. Elevation, road density, and population density were the three strongest predictors of accessibility in a geographically weighted regression model (adjusted R² = 0.71). Seasonal water table fluctuations caused 12.6% of protected wells to become non-functional during extended dry spells, further restricting access. These findings indicate that infrastructure investment alone is not enough; maintenance capacity and seasonal planning are equally important for ensuring year-round access to safe water in rural Sub-Saharan communities.
Summary
Source-checkedPlain-language reading of the full paper, prepared with AI and checked against the text. Each point links to the authors' own words.
Why it matters
- A significant portion of the population in Sub-Saharan Africa, estimated at 319 million people, lacks access to basic drinking water sources. View evidence ↗
- Lack of reliable water access is linked to negative health, educational, and economic outcomes, including increased diarrhoeal disease and lower school attendance for girls. View evidence ↗
- Seasonal water table drops, particularly in the Sahel, can make shallow wells non-functional, meaning communities may lose water access for several months a year. View evidence ↗
The question
- The study aimed to map water sources across six sub-regions, quantify seasonal travel times to improved sources, and identify variables that predict accessibility. View evidence ↗
What they did
- The research analyzed a total area of approximately 34,200 km², mapping 347 water points and 2,814 household clusters. View evidence ↗
- Travel times were calculated using a cost-distance algorithm in ArcGIS Pro 3.0, with walking speeds adjusted for slope and land cover. View evidence ↗
- The study used a 30-minute one-way travel time as the benchmark to distinguish between adequate and inadequate water access. View evidence ↗
- A geographically weighted regression (GWR) model was used to analyze how elevation, road density, population density, market distance, and water point density predicted travel times. View evidence ↗
What they found
- Protected wells and boreholes were the most common sources (46.7%), while unprotected springs and river intakes accounted for 38.3% of sources. View evidence ↗
- The highest rates of inadequate dry-season access were found in the West African Sahel (58.3%), East African lowlands (51.6%), and Central Africa (48.9%). View evidence ↗
- Statistically significant 'cold spots' of low accessibility were identified in the Sahel and East African lowlands, where mean dry-season travel times reached 53.7 minutes. View evidence ↗
- The GWR model explained 71% of the spatial variation in travel time, identifying road density and water point density as the strongest negative predictors (meaning higher density reduced travel time). View evidence ↗
- Approximately 12.6% of protected wells became non-functional during extended dry spells due to seasonal water table fluctuations. View evidence ↗
What it means
- The authors conclude that infrastructure alone is insufficient; they recommend improving road networks, strengthening community maintenance, and scheduling well rehabilitation before the dry season. View evidence ↗
Visual summary
2 visualsIllustrations explain the paper; charts are replotted from the paper's own table values.
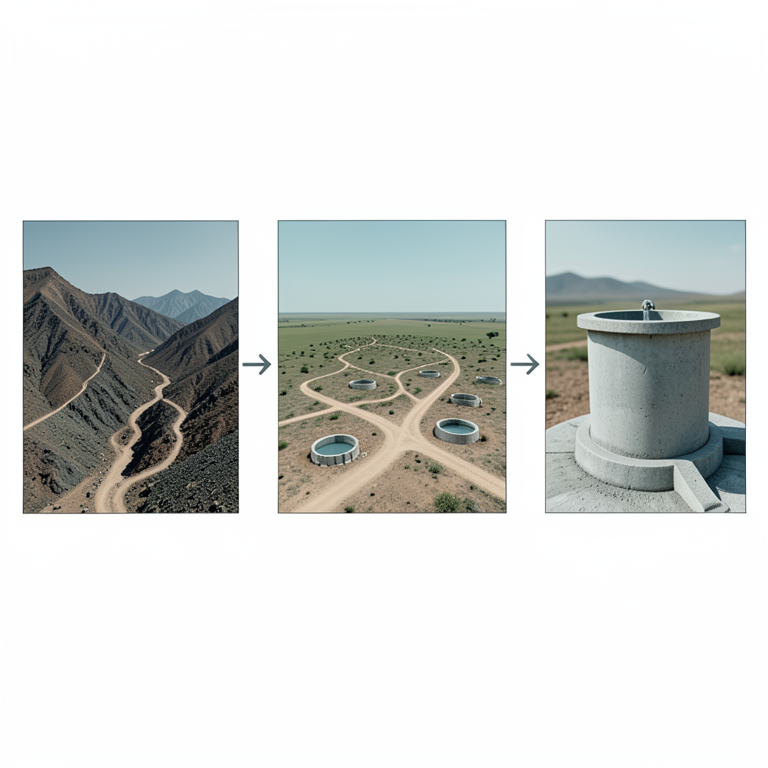
Predictors of Water Accessibility
AI-generated conceptual illustration (Rural Sub-Saharan landscape with water wells and roads). It explains the idea and does not show study data.
View source evidence ↗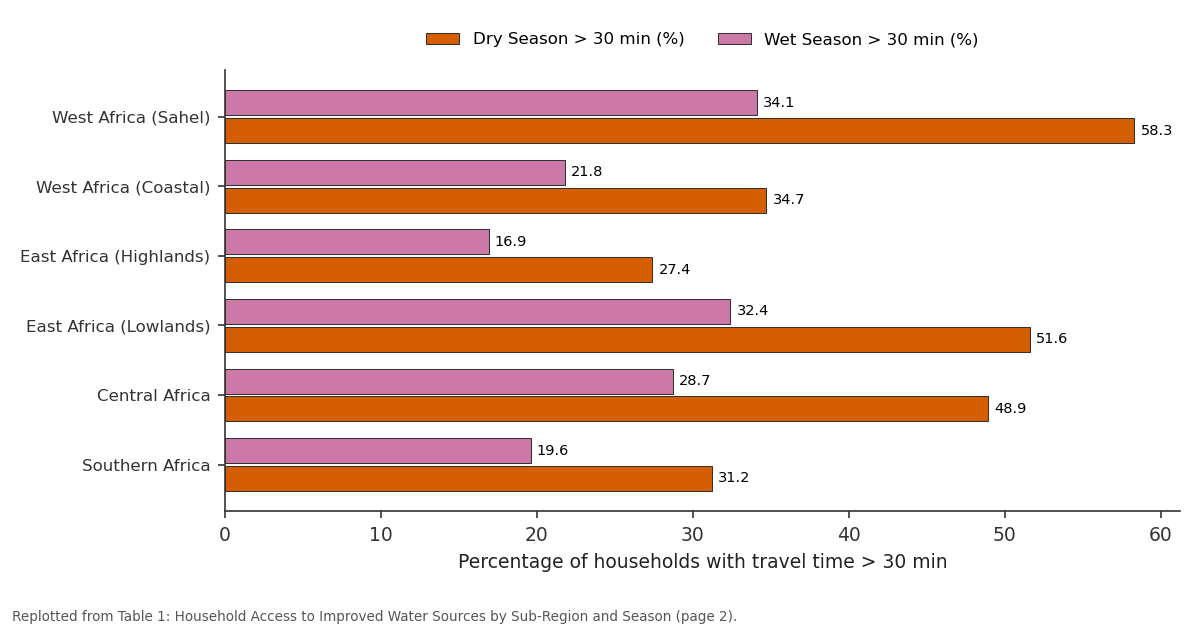
Dry Season > 30 min (%) and Wet Season > 30 min (%): West Africa (Sahel) vs West Africa (Coastal) vs East Africa (Highlands) vs East Africa (Lowlands) vs Central Africa
Replotted from Table 1 (page 2) of the original paper. Every bar is the paper's own table value.
View source evidence ↗Figures & tables
From the original paper Table 1
 Table 2
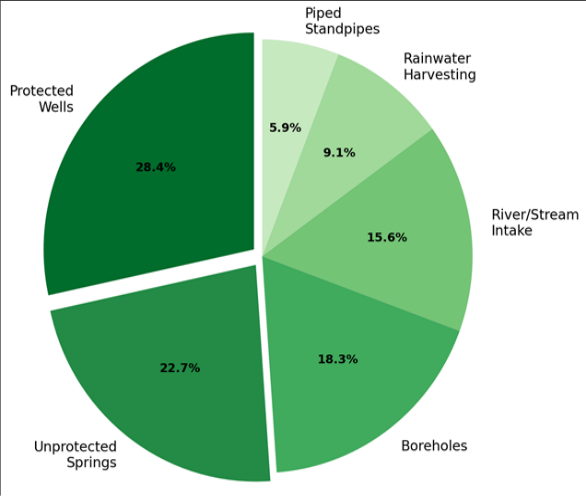 Figure 1
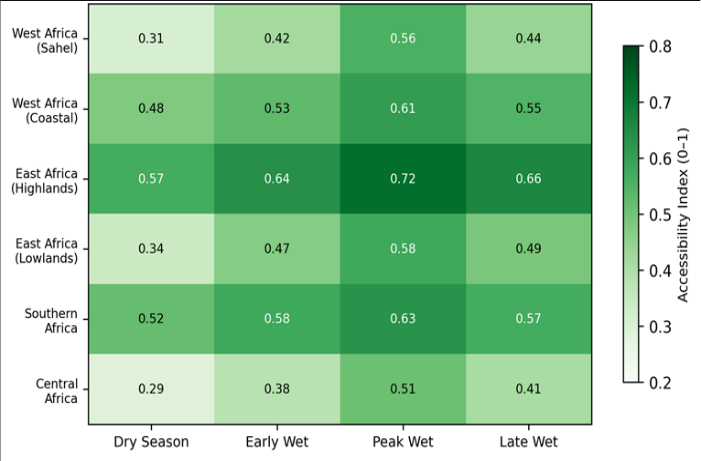 Figure 2
Introduction
Nearly one in three people living in rural Sub-Saharan Africa walked more than 30 minutes to collect drinking water in 2020, a figure that had improved only marginally over the preceding decade [1] . Access to clean water is tied to a web of health, economic, and educational outcomes: communities with distant or unreliable water sources report higher rates of diarrhoeal disease, lower school attendance among girls tasked with water collection, and reduced agricultural productivity [2] . Despite billions of dollars in development aid directed at water infrastructure since the launch of the Millennium Development Goals, coverage gaps remain stubbornly wide in rural settings [3] . Geographic accessibility, defined as the ease with which a population can physically reach a service point, provides a measurable and policy-relevant way to evaluate water coverage [4] . Unlike simple supply counts, accessibility measures account for terrain, road networks, and the actual travel burden faced by households. GIS-based accessibility modelling has been applied to healthcare facilities in Sub-Saharan Africa with considerable success, but its application to water supply mapping has been less common and has typically focused on single countries or small districts [5] . Seasonal variability adds a layer of difficulty that many previous assessments have overlooked. Water tables in the Sahel can drop several metres between the end of the wet season and the peak of the dry season, rendering shallow wells non-functional and forcing households to walk to deeper boreholes or surface sources [6] . This seasonal dimension means that a community classified as "having access" during wet months may effectively lose it for three to five months each year.
The present research addressed three objectives: (a) mapping and classifying all improved and unimproved water sources across 347 sites in six sub-regions of Sub-Saharan Africa, (b) quantifying household-level travel times to the nearest improved source in both dry and wet seasons, and (c) identifying the geographic, demographic, and infrastructure variables that best predict accessibility. By working across multiple countries and seasons, this research sought to produce findings that are transferable beyond a single national context and that can inform regional investment strategies [7] .
Research Area Description
The research covered six sub-regions selected to represent the climatic and infrastructural diversity of rural Sub-Saharan Africa. In West Africa, field sites were located in the Upper East Region of Ghana and the Centre-Nord Region of Burkina Faso, both within the semi-arid Sahel belt where annual rainfall averages 600-900 mm. East African sites included the Kitui and Makueni counties of Kenya (semi-arid lowlands, 500-750 mm annual rainfall) and the Dodoma Region of Tanzania (central plateau, 550-700 mm). In Central Africa, surveys were conducted in the Kasai Province of the Democratic Republic of Congo (tropical forest margin, 1,400-1,700 mm), and in Southern Africa, the Mangochi District of Malawi (sub-humid, 800-1,200 mm) served as the final survey zone. Total surveyed area was approximately 34,200 km², encompassing 347 mapped water points and 2,814 household clusters.
Climatic and Environmental Conditions
Rainfall across the six sub-regions follows a unimodal or bimodal seasonal pattern, with dry spells lasting from two to seven months depending on latitude. During the survey period (2020-2022), mean annual rainfall at Sahelian sites was 14% below the 1991-2020 average, prolonging the dry season by roughly three weeks. Groundwater levels monitored at 28 piezometers showed seasonal fluctuations of 2.4-6.8 m in the Sahel and 0.9-2.1 m at the more humid Central African sites. Mean daily temperatures ranged from 24.1°C in the Malawi survey zone to 33.8°C in the Burkina Faso survey zone. These conditions directly affected well functionality and household travel decisions.
Material and Methods
Material and Methods
Material
The research was coordinated from the Department of Mineral Resources at the Chiang Rai Institute of Earth Sciences, Chiang Rai, Thailand, with field data collection carried out by partner organisations in each country between January 2020 and December 2022. Water point locations were recorded using handheld Garmin GPSMAP 66s receivers (accuracy ± 3 m) and classified as improved (protected wells, boreholes, piped standpipes, protected springs) or unimproved (unprotected springs, unprotected dug wells, surface water) following WHO/UNICEF Joint Monitoring Programme definitions [1] . Household cluster centroids were extracted from the most recent national census shapefiles available through the Humanitarian Data Exchange. Road network data came from OpenStreetMap, downloaded in January 2023 and clipped to each survey zone. Elevation data were obtained from the Shuttle Radar Topography Mission (SRTM) 30 m digital elevation model [8] . Seasonal groundwater levels were recorded at 28 monitoring piezometers equipped with Solinst Levelogger 5 pressure transducers.
Methods
Travel time from each household cluster to the nearest improved water source was calculated using a cost-distance algorithm in ArcGIS Pro 3.0. Walking speed was modelled as a function of slope (Tobler's hiking function) and land cover friction, with a base speed of 5 km/h on flat, clear terrain and reductions of up to 60% on steep slopes or through dense vegetation [9] . Road segments were assigned higher travel speeds (4-5 km/h for unpaved tracks, 5 km/h for paved roads) to reflect the observed preference of water collectors for road-following routes. Access was classified as adequate (≤ 30 min one-way) or inadequate (> 30 min). Spatial clustering of inadequate-access households was identified using the Getis-Ord Gi* statistic at a 5 km hexagonal grid resolution [10] . A geographically weighted regression (GWR) model was fitted to identify local predictors of travel time, using elevation, road density (km/km²), population density, distance to nearest market, and number of water points per 10 km² as independent variables. The GWR model explained 71% of the spatial variation in travel time (Table 2). Road density and water point density were the strongest negative predictors, meaning that areas with more roads and more water points had shorter travel times. Elevation had a positive effect, reflecting the difficulty of reaching sources in hilly terrain. Figure 1 shows that protected wells (28.4%) and unprotected springs (22.7%) were the two most common source types across all surveyed communities. Boreholes accounted for 18.3%, while piped standpipes-often regarded as the most reliable-represented just 5.9% of mapped sources. and 0.29, respectively). All regions improved during the peak wet season, but the gap between best-and worstperforming regions persisted.
| Predictor Variable | Mean Coefficient | Range | Significance | Adj. R² |
|---|---|---|---|---|
| Elevation (m) | 0.034 | 0.008-0.061 | p<0.01 | - |
| Road Density (km/km²) | −4.27 | −7.13 to −1.41 | p<0.01 | - |
| Population Density | −0.018 | −0.032 to −0.004 | p<0.05 | - |
| Water Points per 10 km² | −3.89 | −6.42 to −1.36 | p<0.01 | - |
| Distance to Market (km) | 1.62 | 0.34-2.90 | p<0.05 | - |
| Full Model | - | - | - | 0.71 |
Table text extracted from the original PDF; superscript letters are shown inline. The original table image is below.
View original table image
Results
Results
Comprehensive Interpretation
The combined tabular and spatial results indicate that geographic accessibility to clean water in rural Sub-Saharan Africa remains deeply uneven and season-dependent. Dryseason access deficits are concentrated in low-rainfall zones with sparse road networks and shallow water tables, a pattern that simple infrastructure counts would miss. The GWR model's adjusted R² of 0.71 suggests that most of the spatial variation in travel time can be explained by a small set of measurable landscape and infrastructure variables, which is encouraging for targeting future investments.
Discussion
The finding that 41.8% of surveyed households exceeded the 30-minute access threshold during the dry season aligns with estimates from the WHO/UNICEF Joint Monitoring Programme, which placed rural Sub-Saharan coverage at about 56% for at least basic service in 2020 [1] . However, this research adds spatial and seasonal texture that aggregate national statistics obscure. The Sahel and East African lowlands emerged as the most disadvantaged zones, driven by the combination of low rainfall, deep seasonal water table drops, and sparse road infrastructure [11] . The dominance of protected wells and boreholes among mapped sources (46.7% combined) reflects decades of donor-funded drilling programmes, yet 12.6% of protected wells were non-functional during dry months. This failure rate is consistent with findings from Malawi and Mozambique, where maintenance shortfalls rather than hardware deficiencies were the leading cause of well abandonment [12] . The implication is clear: building new water points without matching investment in communitybased maintenance simply shifts the access gap forward in time.
The GWR results suggest that road density may be as important as water point density in shaping access outcomes [13] . Communities with denser road networks experienced shorter travel times even when water point density was held constant, likely because roads allow faster walking and bicycle transport. This finding supports integrated rural development approaches that pair water infrastructure with road improvement, rather than treating each sector in isolation [14] . One limitation is that the research relied on walking-speed models calibrated from European hiking data (Tobler's function), which may not perfectly capture the movement patterns of water collectors carrying 20-litre jerry cans on return trips. Field validation of return-trip speeds at a subset of sites showed that loaded walking speeds were about 22% slower than the model predicted, which means the reported travel times may slightly underestimate true collection burdens [15] .
Conclusion
Conclusion
Figures and tables from the paper
| Sub-Region | Households Surveyed | Dry Season > 30 min (%) | Wet Season > 30 min (%) | Mean Travel Time (min) |
|---|---|---|---|---|
| West Africa (Sahel) | 487 | 58.3 | 34.1 | 47.6 |
| West Africa (Coastal) | 512 | 34.7 | 21.8 | 31.2 |
| East Africa (Highlands) | 463 | 27.4 | 16.9 | 24.8 |
| East Africa (Lowlands) | 498 | 51.6 | 32.4 | 44.3 |
| Central Africa | 421 | 48.9 | 28.7 | 41.1 |
| Southern Africa | 433 | 31.2 | 19.6 | 28.7 |
Table text extracted from the original PDF; superscript letters are shown inline. The original table image is below.
View original table image
References
19 in the original paper- WHO/UNICEF Joint Monitoring Programme. Progress on Household Drinking Water, Sanitation and Hygiene 2000-2020. World Health Organization. 2021;1-162.
- Hunter PR, MacDonald AM, Carter RC. Water supply and health. PLoS Medicine. 2010;7(11):e1000361.
- Hutton G, Varughese M. The costs of meeting the 2030 Sustainable Development Goal targets on drinking water, sanitation, and hygiene. Water and Sanitation Program Technical Paper. 2016;1-56.
- Penchansky R, Thomas JW. The concept of access: definition and relationship to consumer satisfaction. Medical Care. 1981;19(2):127-140.
- Osei FB, Duker AA. Spatial and demographic patterns of cholera in Ashanti region, Ghana. International Journal of Health Geographics. 2008;7:44.
- MacDonald AM, Bonsor HC, Dochartaigh BEO, Taylor RG. Quantitative maps of groundwater resources in Africa. Environmental Research Letters. 2012;7(2):024009.
- Fisher MB, Shields KF, Chan TU, Christenson E, Cronk RD, Leker H, Samani D, Apoya P, Luber A, Bartram J. Understanding handpump sustainability: determinants of rural water source functionality in the Greater Afram Plains region of Ghana. Water Resources Research. 2015;51(10):8431-8449.
- Farr TG, Rosen PA, Caro E, Crippen R, Duren R, Hensley S. The Shuttle Radar Topography Mission. Reviews of Geophysics. 2007;45(2):RG2004.
- Tobler W. Three presentations on geographical analysis and modeling. National Center for Geographic Information and Analysis Technical Report. 1993;93(1):1-24.
- Getis A, Ord JK. The analysis of spatial association by use of distance statistics. Geographical Analysis. 1992;24(3):189-206.
- Taylor RG, Scanlon B, Doll P, Rodell M, van Beek R, Wada Y. Ground water and climate change. Nature Climate Change. 2013;3(4):322-329.
- Foster T. Predictors of sustainability for communitymanaged handpumps in Sub-Saharan Africa: evidence from Liberia, Sierra Leone, and Uganda. Environmental Science and Technology. 2013;47(21):12037-12046.
- Jacobsen M, Webster M, Vairavamoorthy K. The Future of Water in African Cities. World Bank Publications. 2013;1-169.
- Banerjee SG, Morella E. Africa's Water and Sanitation Infrastructure: Access, Affordability, and Alternatives. World Bank Publications. 2011;1-321.
- Geere JAL, Hunter PR, Jagals P. Domestic water carrying and its implications for health: a review and mixed methods pilot study in Limpopo Province, South Africa. Environmental Health. 2010;9:52.
- Sorensen JPR, Lapworth DJ, Nkhuwa DCW, Stuart ME, Gooddy DC, Bell RA, Chiramba T, Kabber JS, Liemisa M, Chibesa M, Pedley S. Emerging contaminants in urban groundwater sources in Africa. Water Research. 2015;72:51-63.
- Giordano M. Global groundwater? Issues and solutions. Annual Review of Environment and Resources. 2009;34:153-178.
- Xu Y, Usher BH. Groundwater Pollution in Africa. Taylor and Francis. 2006;1-353.
- Gleick PH. Basic water requirements for human activities: meeting basic needs. Water International. 1996;21(2):83-92.