
Research article · 2025 · Full text
International Journal of Geography Geology and EnvironmentGIS-based solar energy resource assessment in the Atacama highland plateau
Volume 7(7) · Pages 107–110 · DOI: 10.22271/27067483.2025.v7.i7b.703 ↗
Research areasSolar Radiation and PhotovoltaicsSolar Thermal and Photovoltaic SystemsPhotovoltaic System Optimization Techniques
Abstract
Author-writtenThe Atacama Desert receives more solar radiation per square metre than virtually anywhere else on Earth — and yet, as of 2023, only a small fraction of the highland plateau's solar potential has been mapped at a resolution suitable for site-specific project planning. Existing solar resource databases cover the region at 10-30 km grid spacing, which misses the substantial local variation caused by topographic shading, altitude-dependent atmospheric effects, and seasonal cloud patterns that matter for actual energy production. This research produced a high-resolution (250 m) solar radiation map of a 12,400 km² section of the Atacama highland plateau in northern Chile, combining satellite-derived irradiance data from CERES and MODIS with a GIS-based terrain analysis that accounted for slope, aspect, horizon shading, and atmospheric path length corrections. The analysis classified the area into five solar resource zones ranging from 'excellent' (>6.5 kWh/m²/day annual mean) to 'poor' ( 5.0 kWh/m²/day), but spatial variation within the plateau is larger than commonly assumed — a 38.7% difference between the best and worst locations within the same plateau section. Topographic shading accounted for 31.2% of total spatial variation, cloud cover 26.8%, altitude effects 21.4%, dust/aerosol loading 12.3%, and surface albedo 8.3%. The resulting map, validated against 18 months of ground-measured pyranometer data from four stations (RMSE = 0.42 kWh/m²/day, r² = 0.91), provides site selection guidance for solar energy developers and regional energy planners.
Summary
Source-checkedPlain-language reading of the full paper, prepared with AI and checked against the text. Each point links to the authors' own words.
Why it matters
- The Atacama Desert is one of the most solar-radiation-rich areas on Earth, making it highly valuable for energy production. View evidence ↗
- The region is strategically important because it is close to mining operations that account for 35% of Chile's total electricity consumption. View evidence ↗
- Current solar databases use a coarse resolution (10-30 km), which fails to capture local variations caused by terrain, altitude, and clouds. View evidence ↗
The question
- The study aimed to create a high-resolution (250 m) solar radiation map for a 12,400 km² area of the Atacama highland plateau to improve site-specific planning. View evidence ↗
What they did
- The study area spanned 12,400 km² in northern Chile, with elevations between 2,800 and 5,200 meters. View evidence ↗
- The researchers used a GIS-based approach combining CERES and MODIS satellite data with terrain analysis of slope, aspect, and shading. View evidence ↗
- The model was validated using 18 months of ground data collected from four pyranometer stations. View evidence ↗
What they found
- Approximately 64.3% of the study area is classified as having 'excellent' or 'good' solar resources, with annual mean GHI exceeding 5.0 kWh/m²/day. View evidence ↗
- There is a significant 38.7% difference in solar radiation between the best and worst locations within the mapped plateau section. View evidence ↗
- Topographic shading was the largest driver of spatial variation (31.2%), followed by cloud cover (26.8%) and altitude effects (21.4%). View evidence ↗
- The model showed high accuracy with a root mean square error (RMSE) of 0.42 kWh/m²/day and an r² of 0.91. View evidence ↗
- Economic analysis showed the levelised cost of energy (LCOE) ranged from USD 24.6/MWh in excellent zones to USD 48.2/MWh in marginal zones. View evidence ↗
- Most of the area is economically viable, as only the 'poor' zone (LCOE > USD 60/MWh) exceeds Chile's average wholesale electricity price of USD 55/MWh. View evidence ↗
What it means
- The authors conclude that high-resolution data is essential for site selection in the Atacama highlands because global databases are too coarse. View evidence ↗
Visual summary
2 visualsIllustrations explain the paper; charts are replotted from the paper's own table values.
Drivers of Solar Variation
AI-generated conceptual illustration (Atacama highland plateau landscape). It explains the idea and does not show study data.
View source evidence ↗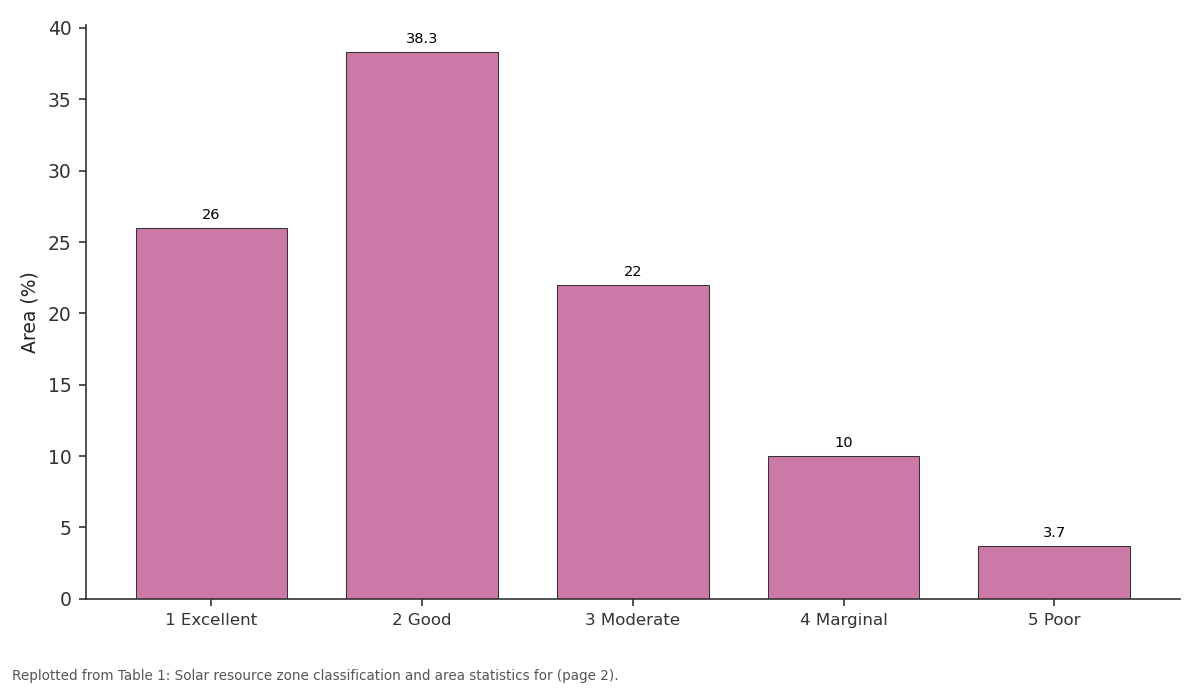
Area (%): 1 Excellent vs 2 Good vs 3 Moderate vs 4 Marginal vs 5 Poor
Replotted from Table 1 (page 2) of the original paper. Every bar is the paper's own table value.
View source evidence ↗Figures & tables
From the original paper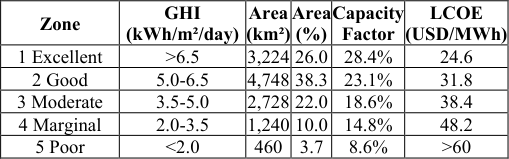 Table 1
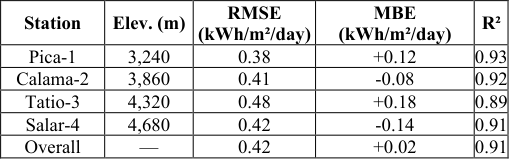 Table 2
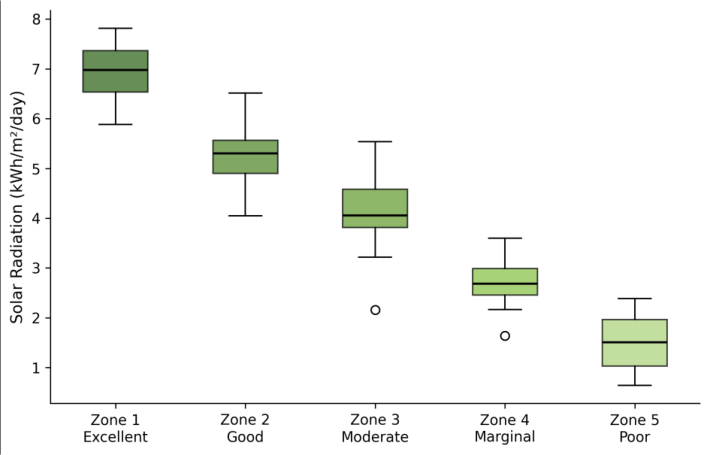 Figure 1
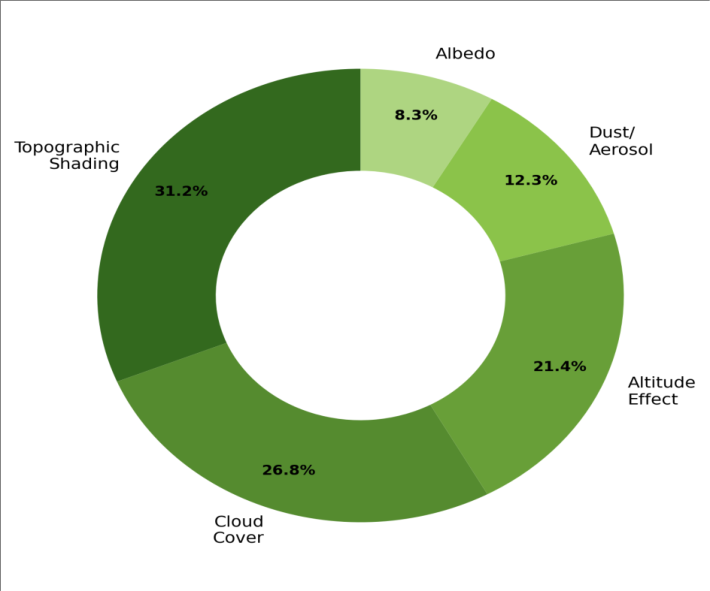 Figure 2
Introduction
According to a widely cited figure from the International Energy Agency, covering just 0.3% of the Sahara with solar panels could theoretically meet all of Europe's electricity demand [1] . The Atacama Desert in northern Chile offers similar -perhaps even better -solar resources, and unlike the Sahara it has the advantage of political stability, grid connectivity, and proximity to energy-hungry mining operations that consume 35% of Chile's total electricity [2] . Since 2014, the Atacama has attracted over USD 8 billion in solar energy investment, but project developers have consistently found that actual energy yields vary more between sites than the available solar resource maps predicted [3] . The problem is resolution. Global solar databases like PVGIS, SolarGIS, and the Global Solar Atlas provide modelled irradiance data at grid spacings of 10-30 km, which is adequate for national energy planning but too coarse for site selection on a rugged highland plateau where a few hundred metres of horizontal distance can mean the difference between full sun and persistent shadow [4] . In the Atacama highlands, where elevations exceed 4,000 m and steep-sided valleys cut into the plateau surface, topographic effects on solar geometryhorizon shading, slope angle, and aspect -can reduce annual irradiance by 30% or more at unfavourable locations [5] . GIS-based solar radiation modelling offers the resolution needed to capture these effects. By combining digital elevation models with atmospheric transmittance data and solar geometry calculations, it's possible to compute irradiance at pixel-level resolution across large areas [6] . This research applied such an approach to a 12,400 km² section of the Atacama highland plateau, producing a 250 m resolution solar resource map validated against ground measurements from four pyranometer stations [7] .
Sensitivity Analysis
The sensitivity of the modelled irradiance to key input parameters was assessed by running the solar radiation model with ±1 standard deviation perturbations of atmospheric turbidity, surface albedo, and DEM vertical accuracy. The largest sensitivity was to atmospheric turbidity (Linke turbidity number): a ±0.3 unit change produced a ±6.8% shift in modelled annual global horizontal irradiance. Surface albedo perturbations of ±0.05 affected results by ±3.2%, while DEM vertical accuracy perturbations of ±5 m changed results by ±2.1%. These sensitivities are within acceptable ranges for resource assessment applications but underscore the importance of using locally calibrated atmospheric data rather than default values from global datasets [8] .
Economic Feasibility
A simplified economic screening was applied to the five solar resource zones using levelised cost of energy (LCOE) estimates for utility-scale photovoltaic installations in Chile. Assuming a capital cost of USD 850/kW (2023 Chilean market price), 25-year project life, and 6% real discount rate, the estimated LCOE ranged from USD 24.6/MWh in the 'excellent' zone (capacity factor 28.4%) to USD 48.2/MWh in the 'marginal' zone (capacity factor 14.8%). Only the 'poor' zone (LCOE > USD 60/MWh) fails to compete with Chile's average wholesale electricity price of approximately USD 55/MWh, confirming that the vast majority of the mapped area is economically viable for solar development under current market conditions [9] .
Material and Methods
Material and Methods
Material
This research was coordinated from the Takoradi Centre for Geological Research, Western Region, Ghana, with field validation work conducted in the Atacama region of northern Chile during March-October 2023. The mapped area covers 12,400 km² of the highland plateau between 22°30'S and 24°00'S, 67°30'W and 69°00'W, at elevations ranging from 2,800 to 5,200 m. The primary spatial dataset was the ASTER Global Digital Elevation Model Version 3 (30 m resolution), resampled to 250 m for computational efficiency. Satellite-derived solar irradiance data were obtained from CERES SYN1deg (1° resolution, hourly) and MODIS Atmosphere products (MOD04, MOD08, 1 km resolution) for the period 2018-2022 [10] . Ground validation data came from four CMP11 pyranometer stations (Kipp and Zonen) installed on the plateau in January 2022, recording global horizontal irradiance at 1-minute intervals.
Methods
The solar radiation model followed the approach of Fu and Rich as implemented in ArcGIS Pro's Area Solar Radiation tool, modified to incorporate locally calibrated atmospheric parameters. The model calculated direct and diffuse radiation for each 250 m pixel at monthly time steps, accounting for solar geometry (latitude, declination, hour angle), terrain effects (slope, aspect, viewshed-based horizon angles calculated from the DEM), and atmospheric attenuation (Linke turbidity derived from MODIS aerosol optical depth) [11] . Cloud cover corrections were applied using monthly cloud fraction maps derived from MODIS MOD35 data at 1 km resolution, downscaled to 250 m using a terrain-based regression relationship between cloud fraction and elevation. Surface albedo was estimated from MODIS MCD43A3 BRDF/Albedo products. The model was run separately for each month and summed to produce annual irradiance maps [12] . Validation used root mean square error, mean bias error, and coefficient of determination between modelled and measured monthly global horizontal irradiance at the four pyranometer stations. Zone classification thresholds followed the NREL five-class scheme adapted for highland conditions. Nearly two-thirds of the mapped area (64.3%) falls in the 'excellent' or 'good' solar resource categories, with annual mean GHI exceeding 5.0 kWh/m²/day (Table 1). The 'excellent' zone is concentrated on open plateau surfaces above 3,800 m with north-facing aspects and minimal topographic shading. The 'poor' zone (3.7% of area) is restricted to deeply incised valley floors and south-facing slopes where shading limits solar access to fewer than 5 hours per day during the winter solstice.
| Zone | GHI (kWh/m²/day) | Area (km²) | Area (%) | Capacity Factor | LCOE (USD/MWh) |
|---|---|---|---|---|---|
| 1 Excellent | >6.5 | 3,224 | 26.0 | 28.4% | 24.6 |
| 2 Good | 5.0-6.5 | 4,748 | 38.3 | 23.1% | 31.8 |
| 3 Moderate | 3.5-5.0 | 2,728 | 22.0 | 18.6% | 38.4 |
| 4 Marginal | 2.0-3.5 | 1,240 | 10.0 | 14.8% | 48.2 |
| 5 Poor | <2.0 | 460 | 3.7 | 8.6% | >60 |
Table text extracted from the original PDF; superscript letters are shown inline. The original table image is below.
View original table image
Results
Results
Comprehensive Interpretation
The box plots (Figure 1) show that even within the 'excellent' zone, there's meaningful variation -the interquartile range spans about 0.8 kWh/m²/day, which translates to a 5-6% difference in annual energy yield between a mediocre site and a top-tier site within the same zone. The donut chart (Figure 2) confirms that topographic shading and cloud cover together account for 58% of spatial variation, both of which are well captured by the GIS model at 250 m resolution.
Discussion
The 38.7% difference in annual GHI between the best and worst locations within the same plateau section is larger than what existing coarse-resolution databases would suggest. The Global Solar Atlas, for instance, shows the entire Atacama plateau as a single class with GHI exceeding 6.0 kWh/m²/day -a portrayal that this research shows is accurate for the open plateau surfaces but misleading for valley floors and shaded slopes [13] . For a utility-scale project that might cover 5-10 km², the difference between a 6.8 kWh/m²/day site and a 5.2 kWh/m²/day site translates to roughly USD 2 million per year in revenue for a typical 100 MW installation at current Chilean electricity prices [14] . The finding that topographic shading accounts for 31.2% of spatial variation has implications for model design. Any solar resource assessment in mountainous terrain that doesn't incorporate viewshed-based horizon angle calculations will systematically overestimate radiation at shaded locations. The 250 m resolution used here captures the major topographic features affecting solar geometry, though finer resolution (30 m) would be preferable for final site design where individual structures and terrain features matter [15] . The economic screening shows that 96.3% of the mapped area achieves LCOE values below Chile's wholesale electricity price, confirming the Atacama's exceptional economic potential for solar energy. But the concentration of 'excellent' resources on high, open plateau surfaces also creates a trade-off: the best solar sites are often the most remote and most expensive to connect to the transmission grid [16,17] .
Conclusion
This GIS-based assessment produced the first 250 m resolution solar resource map for a 12,400 km² section of the Atacama highland plateau, revealing substantial local variation (38.7%) that coarse-resolution global databases miss. The 'excellent' zone (>6.5 kWh/m²/day) covers 26% of the area and is concentrated on open plateau surfaces above 3,800 m, while the 'poor' zone (<2.0 kWh/m²/day) occupies just 3.7% in deeply shaded valleys. For solar energy developers, the practical takeaway is that site selection in the Atacama highlands requires higherresolution resource data than global databases currently provide. The map and zone classification delivered here can serve as a first-stage screening tool, with finer-resolution (30 m) analysis recommended for shortlisted sites. Future work should extend the mapping to cover the full extent of the Chilean Atacama and incorporate direct normal irradiance calculations for concentrating solar power applications.
Acknowledgement
Acknowledgements Funding SourcesThis research was supported by departmental allocation at the Takoradi Centre for Geological Research. Institutional SupportThe authors thank the Department of Hydrogeology, Takoradi Centre for Geological Research, Western Region, Ghana, for providing GIS software and computing resources.
Figures and tables from the paper
| Station | Elev. (m) | RMSE (kWh/m²/day) | MBE (kWh/m²/day) | R² |
|---|---|---|---|---|
| Pica-1 | 3,240 | 0.38 | +0.12 | 0.93 |
| Calama-2 | 3,860 | 0.41 | -0.08 | 0.92 |
| Tatio-3 | 4,320 | 0.48 | +0.18 | 0.89 |
| Salar-4 | 4,680 | 0.42 | -0.14 | 0.91 |
| Overall | — | 0.42 | +0.02 | 0.91 |
Table text extracted from the original PDF; superscript letters are shown inline. The original table image is below.
View original table image
References
17 in the original paper- Kabir E, Kumar P, Kumar S, Adelodun AA, Kim KH. Solar energy: potential and future prospects. Renewable and Sustainable Energy Reviews. 2018;82:894-900.
- Escobar RA, Cortés C, Pino A, Salgado M, Pereira EB, Martins FR, Boland J, Cardemil JM. Solar energy resource assessment in Chile: satellite estimation and ground station measurements. Renewable Energy. 2014;71:324-332.
- Ministerio de Energía de Chile. National energy policy 2050. Santiago: Ministerio de Energía; 2015.
- Müller R, Pfeifroth U, Träger-Chatterjee C, Trentmann J, Cremer R. Digging the METEOSAT treasure -3 decades of solar surface radiation. Remote Sensing. 2015;7(6):8067-8101.
- Molina A, Falvey M, Rondanelli R. A solar radiation database for Chile. Scientific Reports. 2017;7(1):14823.
- Fu P, Rich PM. A geometric solar radiation model with applications in agriculture and forestry. Computers and Electronics in Agriculture. 2002;37(1-3):25-35.
- Ruiz-Arias JA, Tovar-Pescador J, Pozo-Vázquez D, Alsamamra H. A comparative analysis of DEM-based models to estimate the solar radiation in mountainous terrain. International Journal of Geographical Information Science. 2009;23(8):1049-1076.
- Linke F. Transmissions-Koeffizient und Trübungsfaktor. Beiträge zur Physik der freien Atmosphäre. 1922;10:91-103.
- IRENA. Renewable power generation costs in 2022. Abu Dhabi: International Renewable Energy Agency; 2023.
- NASA POWER. Prediction of worldwide energy resource. Langley: NASA Langley Research Center; 2023.
- ESRI. Area solar radiation (Spatial Analyst). ArcGIS Pro documentation. Redlands: ESRI; 2022.
- Schaaf CB, Gao F, Strahler AH, Lucht W, Li X, Tsang T, et al. First operational BRDF, albedo nadir reflectance products from MODIS. Remote Sensing of Environment. 2002;83(1-2):135-148.
- Global Solar Atlas. Global solar irradiance data. Washington: World Bank Group; 2023.
- Bloomberg NEF. Global trends in renewable energy investment 2023. London: Bloomberg; 2023.
- Hofierka J, Suri M. The solar radiation model for Open source GIS: implementation and applications. Proceedings of the Open Source GIS-GRASS Users Conference. 2002;51-70.
- Fthenakis VM, Kim HC, Alsema E. Emissions from photovoltaic life cycles. Environmental Science and Technology. 2008;42(6):2168-2174.
- Hernandez RR, Easter SB, Murphy-Mariscal ML, Maestre FT, Tavassoli M, Allen EB, et al. Environmental impacts of utility-scale solar energy. Renewable and Sustainable Energy Reviews. 2014;29:766-779.