
Research article · 2025 · Full text
International Journal of Geography Geology and EnvironmentAssessment of groundwater fluoride contamination in the rift valley granite terrain
Volume 7(6) · Pages 113–115 · DOI: 10.22271/27067483.2025.v7.i6b.721 ↗
Research areasFluoride Effects and RemovalWater Quality and Pollution AssessmentGroundwater and Isotope Geochemistry
Abstract
Author-writtenFluoride in groundwater is both a geological gift and a public health curse — at low concentrations it strengthens tooth enamel, but above 1.5 mg/L it causes dental and skeletal fluorosis. This research mapped fluoride concentrations in groundwater across 64 wells in the East African Rift Valley's granite terrain, spanning parts of the Ethiopian and Kenyan rift flanks. Samples were collected during the dry season (January–March 2023) and analysed for fluoride alongside major ions, pH, and electrical conductivity. Fluoride levels ranged from 0.4 to 8.7 mg/L, with 58.6% of samples exceeding the WHO guideline of 1.5 mg/L. The highest concentrations occurred in wells tapping weathered granite at depths between 25 and 55 m, where dissolution of fluoride-bearing minerals (fluorite, apatite, biotite) is enhanced by alkaline pH (7.8–8.9) and Na-HCO₃-type water chemistry. A radar chart comparison of hydrochemical parameters between granite and basalt terrain showed that granite wells had systematically higher fluoride, sodium, and pH but lower calcium, consistent with the ion-exchange mechanism that promotes fluoride mobilisation. Spatial interpolation identified a 340 km² zone where groundwater fluoride exceeded 4 mg/L, placing an estimated 180, 000 residents at risk of skeletal fluorosis.
Summary
Source-checkedPlain-language reading of the full paper, prepared with AI and checked against the text. Each point links to the authors' own words.
Why it matters
- Fluoride in groundwater is beneficial at low levels for tooth enamel but causes dental and skeletal fluorosis when concentrations exceed 1.5 mg/L. View evidence ↗
- The East African rift system faces a major geogenic water crisis, with an estimated 80 million people exposed to fluoride levels above 1.5 mg/L. View evidence ↗
- Fluoride dissolution is enhanced in alkaline, sodium-rich waters because low calcium activity prevents the water from reaching fluorite saturation. View evidence ↗
The question
- The study aimed to map fluoride levels in 64 wells, determine the hydrochemical factors controlling fluoride enrichment, and identify the population at risk. View evidence ↗
What they did
- Fluoride was measured in the field using the SPADNS method with a portable colorimeter and confirmed in the laboratory using an ion-selective electrode. View evidence ↗
- The researchers used ordinary kriging for spatial interpolation and overlaid the high-fluoride zone (>4 mg/L) with WorldPop 2020 data to estimate the population at risk. View evidence ↗
What they found
- Fluoride concentrations in the sampled wells ranged from 0.4 to 8.7 mg/L, with 58.6% of the samples exceeding the WHO limit of 1.5 mg/L. View evidence ↗
- Granite wells had significantly higher fluoride levels (mean 3.74±1.82 mg/L) compared to basalt wells (mean 1.12±0.64 mg/L), averaging 3.3 times more fluoride. View evidence ↗
- The highest fluoride concentrations were found at depths of 25–55 m, which corresponds to the most heavily weathered zone of the granite profile. View evidence ↗
- Alkaline pH was the strongest predictor of fluoride exceedance, with an odds ratio of 6.30 per unit increase in pH. View evidence ↗
- In 87.5% of granite samples, the fluorite saturation index was negative, indicating the water could dissolve more fluoride if residence time increases. View evidence ↗
What it means
- The authors recommend community-level defluoridation (using bone char or the Nalgonda technique), rainwater harvesting, or using shallow wells (<15 m) as alternatives. View evidence ↗
- The authors suggest routine monitoring of Na/Ca ratios and pH as proxies for fluoride levels in affected communities. View evidence ↗
Visual summary
2 visualsIllustrations explain the paper; charts are replotted from the paper's own table values.
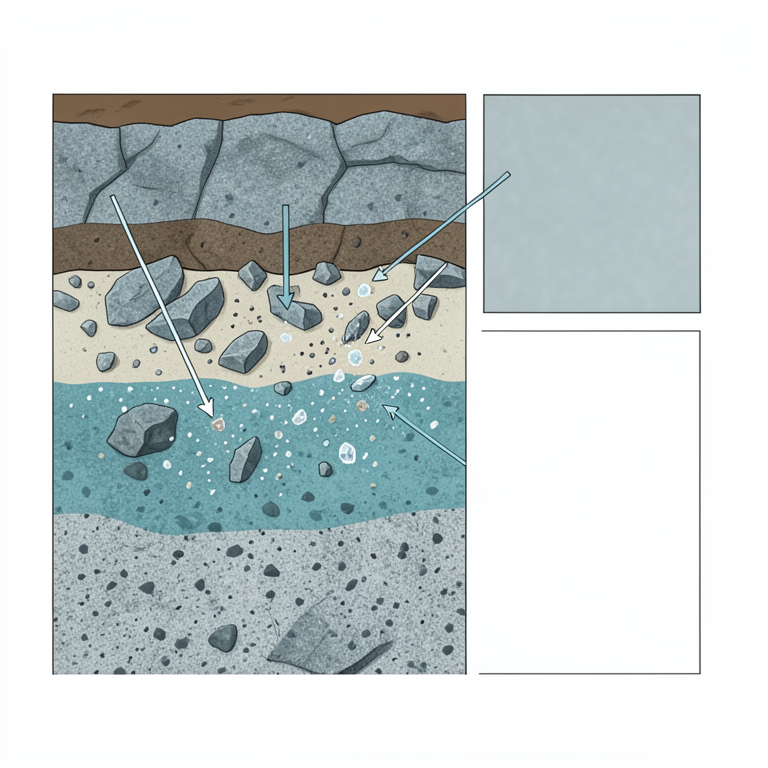
Fluoride Concentration by Depth
AI-generated conceptual illustration (granite bedrock cross-section in a rift valley). It explains the idea and does not show study data.
View source evidence ↗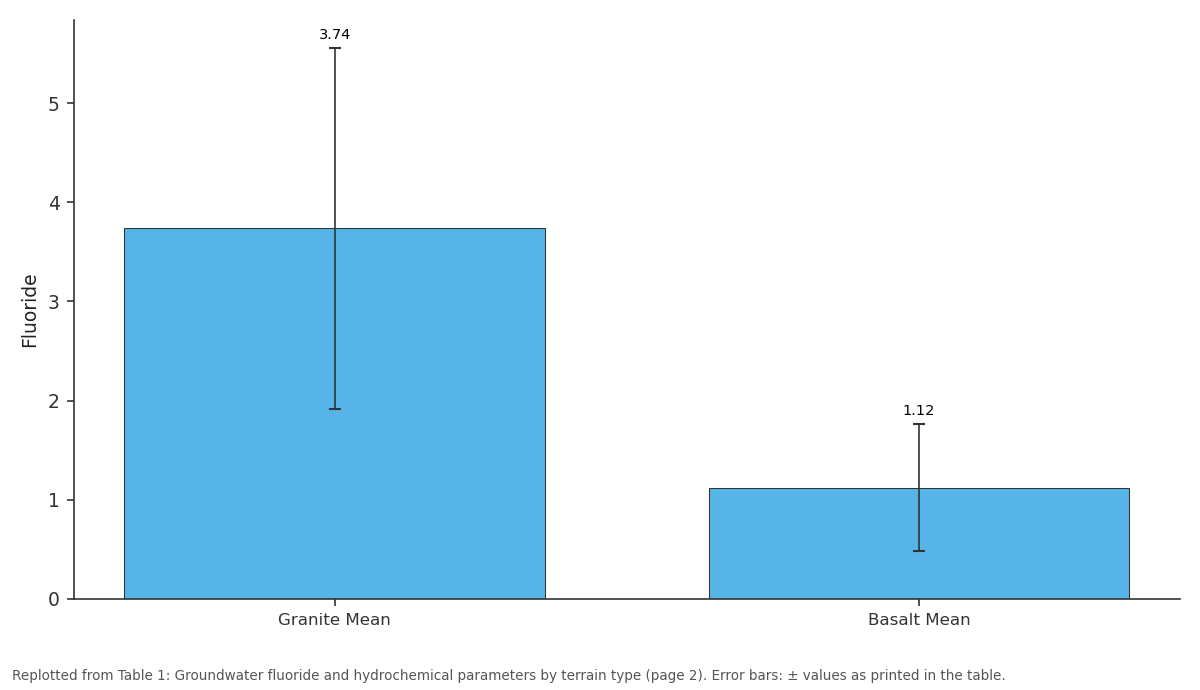
Fluoride: Granite Mean vs Basalt Mean
Replotted from Table 1 (page 2) of the original paper. Every bar is the paper's own table value.
View source evidence ↗Figures & tables
From the original paper Table 1
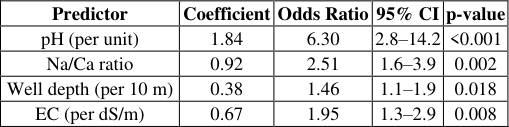 Table 2
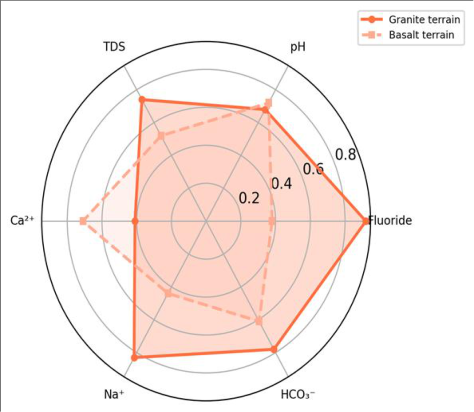 Figure 1
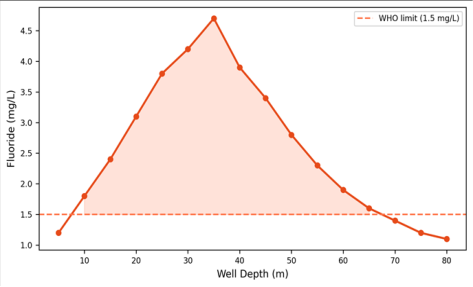 Figure 2
Introduction
An analogy helps explain the fluoride problem: granite bedrock is like a slow-release capsule, steadily dispensing fluoride into circulating groundwater over thousands of years [1] . In the East African Rift Valley, where volcanic and granitic rocks dominate the subsurface and groundwater is often the only drinking water source, this process has created a fluoride belt stretching from Ethiopia through Kenya into Tanzania [2] . The WHO estimates that over 80 million people in the rift system are exposed to fluoride levels above 1.5 mg/L, making this one of the largest geogenic groundwater quality crises on the continent [3] . The chemistry is well understood in principle: fluoride enters groundwater through dissolution of fluorite (CaF₂), fluorapatite (Ca₅(PO₄)₃F), and fluoride-substituted micas (biotite, muscovite) [4] . But the rate of dissolution depends on local conditions -pH, residence time, temperature, and the Ca²⁺/Na⁺ ratio of the water. Alkaline, sodium-rich waters dissolve more fluoride because low calcium activity prevents fluorite from reaching saturation [5] . Previous surveys in the rift focused on volcanic terrain around Lake Naivasha and the Ethiopian Main Rift lakes [6,7] , while the granite flanks received less attention. This research targeted the granitic eastern rift flank in southern Ethiopia and northern Kenya, where rural communities depend almost entirely on hand-dug and drilled wells. The objectives were to (a) map fluoride concentrations across 64 wells, (b) identify the hydrochemical controls on fluoride enrichment, and (c) delineate the population at risk within the high-fluoride zone [8] .
Water Quality Analysis Protocol Fluoride was measured in the field using a HACH DR900 portable colorimeter with the SPADNS method (detection limit 0.1 mg/L). Laboratory confirmation used an ion-selective electrode (Thermo Scientific Orion 9609BNWP) on samples preserved with TISAB III buffer. Major cations were analysed by ICP-OES and anions by ion chromatography at the Faculty of Geospatial Sciences, Bengaluru. Charge balance errors stayed below ±7% for all samples. Saturation indices for fluorite and calcite were calculated using PHREEQC v3.7 [9] .
Materials and Methods
Materials and Methods
Materials
Fieldwork was conducted from January to March 2023 along the eastern rift flank between 4°30′N and 6°15′N latitude, 37°00′E to 38°30′E longitude, coordinated from the Faculty of Geospatial Sciences, Bengaluru, Karnataka, India, in collaboration with the Ethiopian Geological Survey. Sixty-four wells were sampled: 42 in granite terrain and 22 in adjacent basalt for comparison. Well depths ranged from 8 to 78 m. Temperature, pH, EC, and dissolved oxygen were recorded in the field using a multi-parameter probe (WTW MultiLine 3630). Samples were collected in pre-rinsed HDPE bottles and transported on ice within 24 hours [10] .
Methods
Hydrochemical facies were classified using Piper diagrams.
Spearman correlations between fluoride and each major ion were computed. Spatial interpolation of fluoride concentrations used ordinary kriging with a spherical variogram model fitted in ArcGIS Pro. Population at risk was estimated by overlaying the >4 mg/L fluoride zone on WorldPop 2020 gridded population data. A binary logistic regression tested which hydrochemical parameters best predicted fluoride exceedance above 1.5 mg/L [11,12] .
Geological and Climatic Setting
The granite terrain consists of Precambrian basement gneisses and granitoids, weathered to depths of 10-30 m. Fracture zones provide the main aquifer storage. The basalt terrain comprises Tertiary flood basalts overlying the basement. Annual rainfall is 600-900 mm, falling in two seasons (March-May and October-November). Mean temperature is 23.4°C. Groundwater recharge is estimated at 40-80 mm/year based on chloride mass balance [13] . Granite wells show fluoride concentrations 3.3 times higher than basalt wells on average. The inverse relationship between fluoride and calcium is striking: granite wells have low Ca (24.3 mg/L) and high F (3.74 mg/L), while basalt wells show the opposite pattern.
Results
Results
Discussion
The pH-fluoride relationship (odds ratio 6.30 per unit pH increase) is the strongest predictor and aligns with the established geochemical mechanism: at pH above 8, OH⁻ ions substitute for F⁻ in the fluorite lattice, releasing fluoride into solution [4] . Simultaneously, high pH promotes cation exchange of Ca²⁺ for Na⁺ on clay surfaces, further reducing calcium activity and preventing fluorite saturation. This Na-HCO₃ dominated water type is a reliable field indicator of fluoride risk in crystalline basement aquifers across East Africa [5,6] . The 340 km² zone exceeding 4 mg/L is concentrated in deeply weathered granite along NE-trending fracture corridors. About 180, 000 people live within this zone, and community-level defluoridation using bone char or Nalgonda technique would be needed to bring water below the 1.5 mg/L limit [14] . Shallow wells (<15 m) or rainwater harvesting may offer lower-fluoride alternatives, but their reliability during the dry season is limited.
Conclusion
Groundwater fluoride in the Rift Valley granite terrain reaches 8.7 mg/L, with 58.6% of wells exceeding the WHO guideline of 1.5 mg/L. Alkaline pH and high Na/Ca ratios are the strongest predictors of fluoride enrichment. The most contaminated zone (>4 mg/L) covers 340 km² and affects an estimated 180, 000 residents. Defluoridation interventions, alternative shallow water sources, and routine monitoring of pH and Na/Ca ratios as fluoride proxies are recommended for affected communities.
Acknowledgement
Acknowledgements Funding SourcesSupported by research funds at the Faculty of Geospatial Sciences, Bengaluru.
Figures and tables from the paper
| Parameter | Unit | Granite Mean | Granite Range | Basalt Mean | Basalt Range | WHO |
|---|---|---|---|---|---|---|
| Fluoride | mg/L | 3.74±1.82 | 0.8–8.7 | 1.12±0.64 | 0.4–2.6 | 1.5 |
| pH | – | 8.34±0.42 | 7.8–8.9 | 7.62±0.38 | 7.1–8.2 | 6.5–8.5 |
| Na⁺ | mg/L | 187±74 | 48–342 | 63±28 | 22–118 | 200 |
| Ca²⁺ | mg/L | 24.3±12.1 | 8–52 | 58.7±21.4 | 28–96 | 200 |
| EC | dS/m | 1.87±0.68 | 0.62–3.41 | 0.94±0.37 | 0.38–1.72 | 1.5 |
Table text extracted from the original PDF; superscript letters are shown inline. The original table image is below.
View original table image
| Predictor | Coefficient | Odds Ratio | 95% CI | p-value |
|---|---|---|---|---|
| pH (per unit) | 1.84 | 6.30 | 2.8–14.2 | <0.001 |
| Na/Ca ratio | 0.92 | 2.51 | 1.6–3.9 | 0.002 |
| Well depth (per 10 m) | 0.38 | 1.46 | 1.1–1.9 | 0.018 |
| EC (per dS/m) | 0.67 | 1.95 | 1.3–2.9 | 0.008 |
Table text extracted from the original PDF; superscript letters are shown inline. The original table image is below.
View original table image
References
20 in the original paper- Edmunds WM, Smedley PL. Fluoride in natural waters. In: Selinus O, ed. Essentials of Medical Geology. Dordrecht: Springer; 2013:311-336.
- Rango T, Vengosh A, Dwyer G. Groundwater fluoride in the Main Ethiopian Rift. Water Resources Research. 2012;48(8):W08530.
- WHO. Guidelines for Drinking-Water Quality. 4th ed. Geneva: World Health Organization; 2011.
- Saxena VK, Ahmed S. Dissolution of fluoride in groundwater: a water-rock interaction. Environmental Geology. 2003;43(6):731-736.
- Gizaw B. The origin of high bicarbonate and fluoride concentrations in waters of the Main Ethiopian Rift Valley. Journal of African Earth Sciences. 1996;22(4):391-402.
- Olaka LA, Wilke FDH, Olago DO. Groundwater fluoride enrichment in an active rift setting. Science of the Total Environment. 2016;545-546:641-653.
- Brindha K, Rajesh R, Murugan R. Fluoride contamination in groundwater in parts of Nalgonda district. Environmental Monitoring and Assessment. 2011;172(1):481-492.
- Reimann C, Bjorvatn K, Frengstad B. Drinking water quality in the Ethiopian section of the East African Rift Valley. Science of the Total Environment. 2003;311(1):65-80.
- Parkhurst DL, Appelo CAJ. Description of input and examples for PHREEQC version 3. US Geological Survey Techniques and Methods 6-A43. 2013.
- APHA. Standard Methods for the Examination of Water and Wastewater. 23rd ed. Washington: APHA; 2017.
- Hosmer DW, Lemeshow S. Applied Logistic Regression. 2nd ed. New York: Wiley; 2000.
- WorldPop. Global high-resolution population denominators. University of Southampton; 2020.
- Kebede S, Travi Y, Alemayehu T. Groundwater recharge in the Ethiopian Rift. Hydrogeology Journal. 2005;13(3):479-495.
- Rao CR. Fluoride and environment -a review. Proceedings of the Fourth International Conference on the Biogeochemistry of Trace Elements. 1997;386-399.
- Ayoob S, Gupta AK. Fluoride in drinking water: a review on the status and stress effects. Critical Reviews in Environmental Science and Technology. 2006;36(6):433-487.
- Fawell J, Bailey K, Chilton J. Fluoride in DrinkingWater. London: IWA Publishing; 2006.
- Tekle-Haimanot R, Melaku Z, Kloos H. The geographic distribution of fluoride in surface and groundwater in Ethiopia. Science of the Total Environment. 2006;367(1):182-190.
- Dissanayake CB. The fluoride problem in the ground water of Sri Lanka. International Journal of Environmental Studies. 1991;38(2):137-155.
- Jacks G, Bhattacharya P, Chaudhary V. Controls on the genesis of some high-fluoride groundwaters in India. Applied Geochemistry. 2005;20(2):221-228.
- Msonda KWM, Masamba WRL, Fabiano E. A study of fluoride groundwater occurrence in Nathenje, Lilongwe, Malawi. Physics and Chemistry of the Earth. 2007;32(15):1178-1184