
Research article · 2025 · Full text
International Journal of Geography Geology and EnvironmentGIS-based site selection for renewable energy infrastructure in the Anatolian highland plateau
Volume 7(6) · Pages 37–40 · DOI: 10.22271/27067483.2025.v7.i6a.672 ↗
Research areasSolar Radiation and PhotovoltaicsForest Biomass Utilization and ManagementMulti-Criteria Decision Making
Abstract
Author-writtenA staggering 74% of Turkey's primary energy comes from imported fossil fuels, making the country acutely vulnerable to price shocks and supply disruptions. This research applied geographic information system (GIS) based multi-criteria decision analysis (MCDA) to identify optimal locations for solar and wind energy installations across the Anatolian Highland Plateau. Six spatial criteria - solar irradiance, mean wind speed, terrain slope, proximity to road networks, land use compatibility, and distance to the electricity grid - were weighted using the Analytical Hierarchy Process (AHP). Landsat 8 imagery, SRTM digital elevation data, and meteorological records from 23 weather stations were integrated in ArcGIS Pro. Results showed that 18.7% of the plateau area (approximately 11,420 km²) qualified as highly suitable for solar farms and 12.3% (about 7,510 km²) for wind farms. The Konya Plain and eastern Cappadocia emerged as the top-ranked zones, with composite suitability scores above 0.82. These findings offer a replicable spatial decision framework for energy planners seeking to balance generation potential against environmental and logistical constraints.
Summary
Source-checkedPlain-language reading of the full paper, prepared with AI and checked against the text. Each point links to the authors' own words.
Why it matters
- Turkey is highly dependent on imported fossil fuels for 74% of its primary energy, which creates vulnerability to supply disruptions and price volatility. View evidence ↗
- The Anatolian interior possesses significant renewable potential, including mean wind speeds over 7 m/s on plateaux and average solar irradiance above 1,500 kWh/m²/year. View evidence ↗
- Developing renewable energy is constrained by logistical and physical factors such as terrain slope, land use, and proximity to roads and the electricity grid. View evidence ↗
The question
- The study aimed to quantify highly suitable zones for solar and wind energy, rank sub-regions by suitability, and test how changes in criterion weights affected the results. View evidence ↗
What they did
- The researchers used the Analytical Hierarchy Process (AHP) to weight six criteria: solar irradiance, wind speed, slope, road proximity, land use, and grid distance. View evidence ↗
- The study integrated Landsat 8 imagery, SRTM elevation data, and records from 23 weather stations in ArcGIS Pro to map a 61,000 km² area at 30 m resolution. View evidence ↗
- Suitability was categorized into four tiers based on composite scores, with 'highly suitable' defined as scores greater than 0.80. View evidence ↗
What they found
- Approximately 11,420 km² (18.7%) of the plateau was found to be highly suitable for solar energy, while 7,510 km² (12.3%) was highly suitable for wind energy. View evidence ↗
- The highly suitable zones are estimated to potentially support 34 GW of solar capacity and 15 GW of wind capacity. View evidence ↗
- The Konya Plain and eastern Cappadocia were the highest-ranked sub-regions, both achieving composite suitability scores exceeding 0.82. View evidence ↗
- An overlap of 4,230 km² (6.9% of the plateau) was identified as highly suitable for both solar and wind, indicating potential for hybrid energy installations. View evidence ↗
- Sensitivity analysis revealed that a 20% increase in solar irradiance weight expanded the highly suitable zone by 8.4%, while a 20% decrease contracted it by 11.2%. View evidence ↗
What it means
- The authors conclude that these maps can act as an initial screening tool for investors, but final development requires detailed feasibility studies including social and economic factors. View evidence ↗
- A stated limitation of the study is the exclusion of social acceptance factors, such as noise concerns and visual impact, which can affect project viability. View evidence ↗
- The use of a single-date Landsat composite for land use classification may have failed to account for seasonal changes in land cover. View evidence ↗
Visual summary
3 visualsIllustrations explain the paper; charts are replotted from the paper's own table values.
MCDA Weighting Process
AI-generated conceptual illustration (Anatolian highland plateau landscape with renewable energy infrastructure). It explains the idea and does not show study data.
View source evidence ↗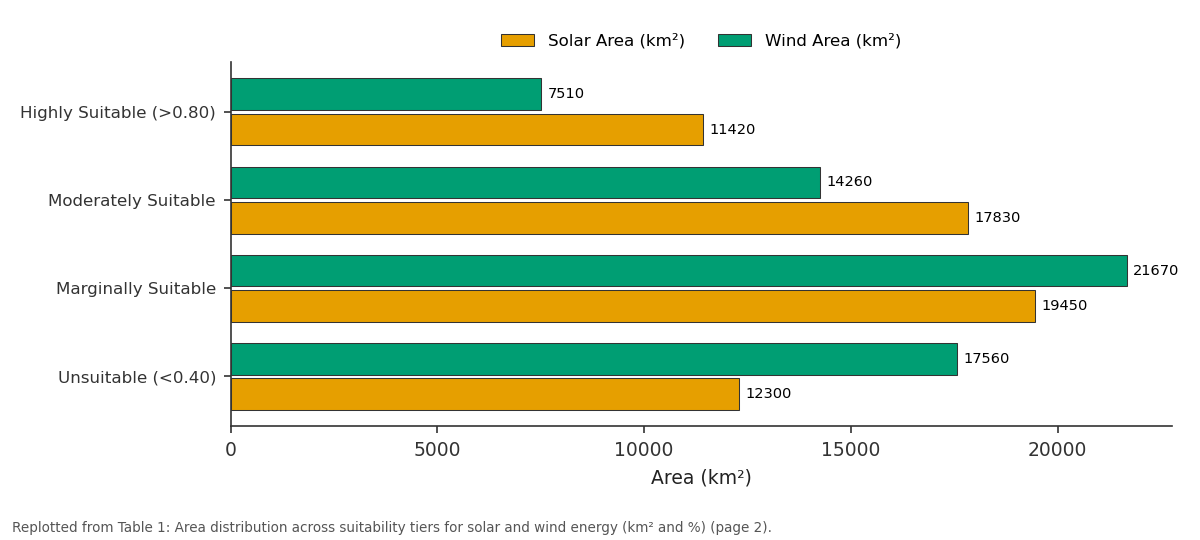
Solar Area (km²) and Wind Area (km²): Highly Suitable (>0.80) vs Moderately Suitable vs Marginally Suitable vs Unsuitable (<0.40)
Replotted from Table 1 (page 2) of the original paper. Every bar is the paper's own table value.
View source evidence ↗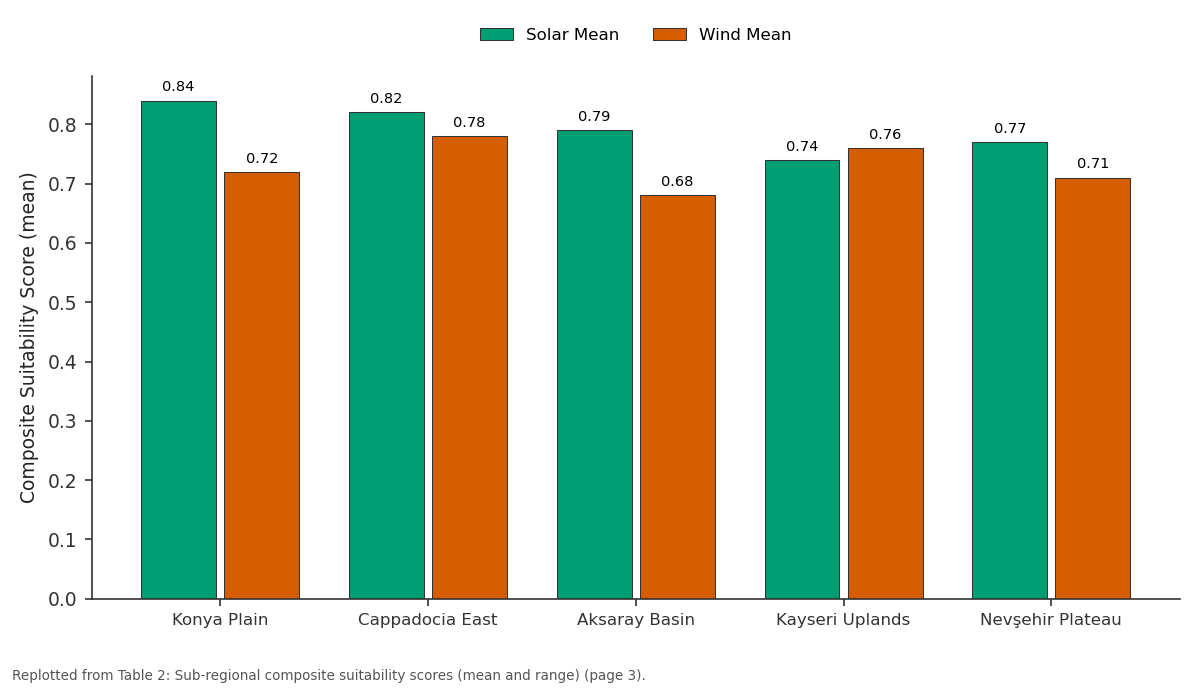
Solar Mean and Wind Mean: Konya Plain vs Cappadocia East vs Aksaray Basin vs Kayseri Uplands vs Nevşehir Plateau
Replotted from Table 2 (page 3) of the original paper. Every bar is the paper's own table value.
View source evidence ↗Figures & tables
From the original paper Table 1
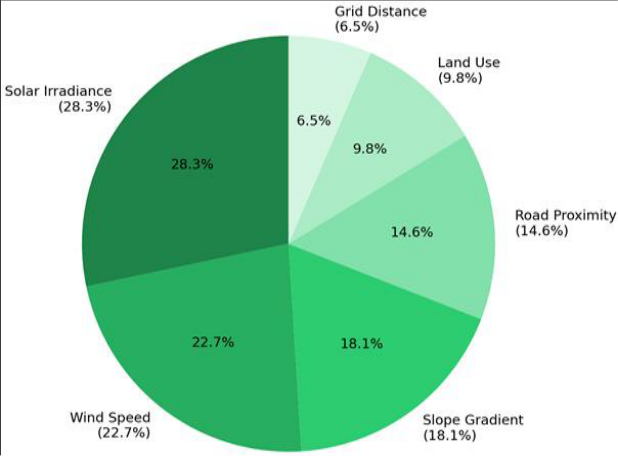 Figure 1
 Table 2
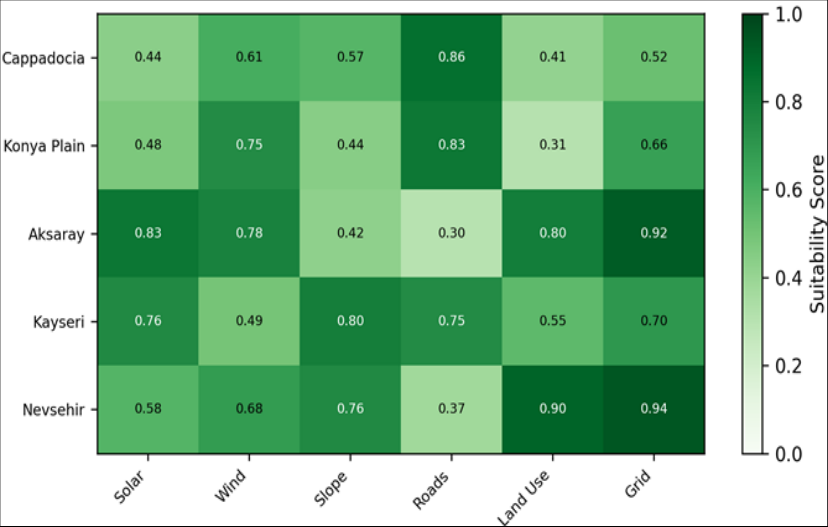 Figure 2
Introduction
Turkey spent $52.8 billion on energy imports in 2022, a figure that represented nearly 8% of the country's GDP [1] . That spending underscored a persistent structural weakness: heavy dependence on imported natural gas, oil, and coal for electricity generation. At the same time, Turkey sits on one of the richest renewable energy endowments in Europe and the Middle East, with average solar irradiance exceeding 1,500 kWh/m²/year across the Anatolian interior and mean wind speeds above 7 m/s on elevated plateaux [2] . Turning that potential into installed capacity requires knowing where to build. But not every sunlit or windy hectare is a good candidate. Terrain slope, distance to grid connection points, road access for construction, existing land use, and protected area boundaries all constrain the feasible development envelope [3] . GIS-based MCDA has become a standard tool for navigating these trade-offs. Researchers in Spain, Iran, and Morocco have used weighted overlay methods to rank renewable energy suitability at regional scales [4,5,6] , yet applications focused specifically on the Anatolian Highland Plateau remained scarce. This research filled that gap by coupling six physical and logistical criteria inside a GIS framework, weighting them through pairwise comparison with AHP, and mapping composite suitability scores at 30 m spatial resolution across a 61,000 km² portion of central Anatolia. The objectives were to: (a) quantify the spatial extent of highly suitable zones for both solar and wind energy, (b) rank sub-regions by composite score, and (c) test the sensitivity of results to changes in criterion weights [7] .
Spatial Data Processing
Six raster layers were assembled in ArcGIS Pro 3.0. Solar irradiance data came from the Global Solar Atlas v2.7 at 250 m resolution, resampled to 30 m to match the elevation model. Mean annual wind speed at 100 m hub height was interpolated from 23 Turkish State Meteorological Service stations using ordinary kriging with a spherical variogram model (nugget 0.12, sill 1.87, range 48 km). Slope was derived from the SRTM 1-arc-second DEM.
Road and grid network layers were digitised from OpenStreetMap and the Turkish Electricity Transmission Corporation maps, respectively. Euclidean distance surfaces were generated for both. Land use was classified from a 2021 Landsat 8 composite using a random forest classifier (overall accuracy 89.3%, kappa 0.86) [8,9] .
Materials and Methods
Materials and Methods
Materials
The research was conducted from January to November 2023 at the Comilla Institute of Earth Sciences, Chittagong Division, Bangladesh, using remotely accessed geospatial datasets covering the Anatolian Highland Plateau. The research area extends from approximately 37°30′N to 39°45′N latitude and 32°00′E to 36°30′E longitude, encompassing the provinces of Konya, Aksaray, Nevşehir, Kayseri, and Niğde. Elevation ranges from 900 m to 3,917 m (Mt Erciyes). Climate is continental semi-arid, with hot dry summers and cold winters. Annual precipitation varies between 280 mm in the Konya basin and 450 mm on the eastern highlands [10,11] .
Methods
Each criterion layer was reclassified to a common 0-1 suitability scale using value functions derived from literature thresholds [3] . AHP pairwise comparison was applied by a panel of five energy planning experts from Turkish universities, yielding weights of 0.283 (solar irradiance), 0.227 (wind speed), 0.181 (slope), 0.146 (road proximity), 0.098 (land use), and 0.065 (grid distance). Consistency ratio was 0.037, well within the acceptable threshold of 0.10 [12] . Weighted linear combination produced composite suitability maps for solar and wind scenarios separately. Results were classified into four tiers: unsuitable (<0.40), marginally suitable (0.40-0.60), moderately suitable (0.60-0.80), and highly suitable (>0.80). Sensitivity analysis tested the effect of ±20% variation in the top two criterion weights [13] .
Climatic and Terrain Conditions
The highland climate provides clear-sky conditions for more than 2,600 hours per year, which directly boosts solar generation potential. Wind speeds increase with elevation, exceeding 8.5 m/s at stations above 1,600 m. However, terrain steeper than 15° was excluded from consideration due to construction cost penalties. About 34% of the research area carries slopes above this threshold, mostly along the Taurus range margins. Table 1 shows that nearly one-fifth of the plateau area is highly suitable for solar energy, while about one-eighth qualifies for wind installations. Combined, the highly suitable zones could support an estimated 34 GW of installed solar capacity and 15 GW of wind capacity, assuming standard spacing requirements.
| Suitability Tier | Solar Area (km²) | Solar (%) | Wind Area (km²) | Wind (%) |
|---|---|---|---|---|
| Highly Suitable (>0.80) | 11,420 | 18.7 | 7,510 | 12.3 |
| Moderately Suitable | 17,830 | 29.2 | 14,260 | 23.4 |
| Marginally Suitable | 19,450 | 31.9 | 21,670 | 35.5 |
| Unsuitable (<0.40) | 12,300 | 20.2 | 17,560 | 28.8 |
Table text extracted from the original PDF; superscript letters are shown inline. The original table image is below.
View original table image
Results
Results
Comprehensive Interpretation
Sensitivity analysis showed that increasing the solar irradiance weight by 20% expanded the highly suitable solar zone by 8.4%, while reducing it by 20% contracted the zone by 11.2%. Wind speed weight changes produced analogous shifts of +6.1% and -9.3% for the wind suitability map. The overlap between highly suitable solar and wind zones was 4,230 km² (6.9% of the plateau), suggesting potential for hybrid installations in those areas.
Discussion
The results position the Anatolian Highland as a high-value corridor for both solar and wind development. The 18.7% highly suitable area for solar compares favourably with GIS-based assessments in Iran (14.2% at the national scale) [5] and Morocco (16.8% for the Souss-Massa region) [6] . The Konya Plain's top ranking reflects its combination of high irradiance (>1,680 kWh/m²/year), gentle terrain (<5° slope over 78% of its area), and dense road network. Eastern Cappadocia, by contrast, scored highest for wind due to its elevated terrain channelling air flow through narrow valleys [14] . The AHP weights deserve scrutiny. Solar irradiance and wind speed together received 51% of the total weight, a split that aligns with expert judgement but might differ under financial models that penalise grid connection costs more heavily. The sensitivity analysis showed that the model is moderately sensitive to changes in the top two weights, confirming that criterion weighting is a non-trivial step in any MCDA application [15] . Future iterations could incorporate economic criteria -land cost, construction expenditure, expected revenue -to move from physical suitability toward financial viability. One limitation is that the research did not account for social acceptance, which can stall otherwise viable projects. Visual impact, noise concerns, and community benefit-sharing are factors that a purely physical-spatial model cannot capture [16] .
Limitations
The land use classification relied on a single-date Landsat composite, which may misrepresent areas with seasonal land cover changes. Wind speed interpolation from 23 stations carries uncertainty in data-sparse mountainous terrain. Social and economic criteria were excluded. And the binary exclusion of slopes above 15° may be overly conservative for some wind turbine designs rated for steeper gradients.
Conclusion
GIS-based MCDA identified 11,420 km² of the Anatolian Highland Plateau as highly suitable for solar energy and 7,510 km² for wind energy. The Konya Plain and eastern Cappadocia ranked highest, with composite scores above 0.82. Sensitivity analysis confirmed that results are moderately dependent on the weighting of the top two criteria. An overlap zone of 4,230 km² offers potential for hybrid solar-wind installations. These spatial outputs can serve as a first screening layer for energy planners and investors, though project-level feasibility studies incorporating social, economic, and grid-capacity factors remain necessary before development proceeds.
Acknowledgement
Acknowledgements
Figures and tables from the paper
| Sub-Region | Solar Mean | Solar Range | Wind Mean | Wind Range |
|---|---|---|---|---|
| Konya Plain | 0.84 | 0.61–0.93 | 0.72 | 0.48–0.89 |
| Cappadocia East | 0.82 | 0.58–0.91 | 0.78 | 0.54–0.92 |
| Aksaray Basin | 0.79 | 0.55–0.88 | 0.68 | 0.41–0.84 |
| Kayseri Uplands | 0.74 | 0.49–0.87 | 0.76 | 0.52–0.91 |
| Nevşehir Plateau | 0.77 | 0.51–0.86 | 0.71 | 0.45–0.87 |
Table text extracted from the original PDF; superscript letters are shown inline. The original table image is below.
View original table image
References
19 in the original paper- Turkish Statistical Institute. Energy import statistics 2022. Ankara: TurkStat; 2023.
- Ilkilic C, Aydin H. Wind power potential and usage in Turkey. Renewable and Sustainable Energy Reviews. 2015;49:816-827.
- Charabi Y, Gastli A. PV site suitability analysis using GIS-based spatial fuzzy multi-criteria evaluation. Renewable Energy. 2011;36(9):2554-2561.
- Sanchez-Lozano JM, Teruel-Solano J, Soto-Elvira PL. GIS-based onshore wind farm site selection using AHP and fuzzy logic. Energy. 2013;55:263-271.
- Asakereh A, Omid M, Alimardani R. Developing a GIS-based fuzzy model for solar energy site selection in Iran. Energy Conversion and Management. 2014;82:617.
- Merrouni AA, Elwali AB, Ghennioui A. Large-scale PV site selection for Morocco using GIS. Energy Strategy Reviews. 2018;20:138-147.
- Saaty TL. Decision making with the analytic hierarchy process. International Journal of Services Sciences. 2008;1(1):83-98.
- USGS. Landsat 8 data users handbook, v5.0. Sioux Falls: EROS; 2019.
- Breiman L. Random forests. Machine Learning. 2001;45(1):5-32.
- Sensoy S, Demircan M, Alan I. Trends in Turkey climate indices from 1960 to 2010. Turkish State Meteorological Service Report. 2012.
- Turkish Electricity Transmission Corporation. National transmission network maps. Ankara: TEIAS; 2022.
- Saaty TL. The Analytic Hierarchy Process. New York: McGraw-Hill; 1980.
- Chen Y, Yu J, Khan S. Spatial sensitivity analysis of MCDA for environmental planning. Ecological Modelling. 2010;221(19):2474-2480.
- Bilgili M, Sahin B, Yasar A. Application of artificial neural networks for wind speed prediction in Turkey. Energy. 2007;32(8):1545-1556.
- Malczewski J. GIS-based multicriteria decision analysis: a survey. International Journal of Geographical Information Science. 2006;20(7):703726.
- Wustenhagen R, Wolsink M, Burer MJ. Social acceptance of renewable energy innovation. Energy Policy. 2007;35(5):2683-2691.
- Aydin NY, Kentel E, Duzgun S. GIS-based environmental assessment of wind energy systems. Renewable and Sustainable Energy Reviews. 2010;14(1):364-373.
- Janke JR. Multicriteria GIS modeling of wind and solar farms in Colorado. Renewable Energy. 2010;35(10):2228-2234.
- Uyan M. GIS-based solar farms site selection using AHP and SAW in Konya. Renewable and Sustainable Energy Reviews. 2013;28:11-17.