
Research article · 2025 · Full text
International Journal of Geography Geology and EnvironmentEarthquake induced liquefaction susceptibility assessment in the Kathmandu Valley alluvial deposits
Volume 7(3) · Pages 164–167 · DOI: 10.22271/27067483.2025.v7.i3c.632 ↗
Research areasGeotechnical Engineering and Soil MechanicsGeotechnical Engineering and Underground StructuresSeismic Performance and Analysis
Abstract
Author-writtenCan the alluvial and lacustrine deposits beneath Kathmandu withstand the shaking levels expected from a recurrence of the 1934-type great earthquake? This research assessed liquefaction susceptibility across the Kathmandu Valley using borehole data from 147 geotechnical investigations, groundwater-level records, and probabilistic seismic hazard estimates. A liquefaction susceptibility index (LSI) was computed for each borehole location following the simplified procedure of Seed and Idriss, updated with corrections for fines content and overburden stress. Results were interpolated across the valley floor using inverse-distance weighting in a GIS environment at a 500 m grid resolution. Under a design peak ground acceleration (PGA) of 0.36 g corresponding to a 475-year return period, roughly 38.2% of the valley area fell into the high or very-high susceptibility classes, concentrated along the Bagmati River floodplain and the paleo-lake bed in the central basin. Fluvial sand deposits recorded the lowest corrected SPT blow counts (mean N₁₆₀ = 8.4), while alluvial gravels exceeded the critical threshold comfortably (mean N₁₆₀ = 18.7). These findings point to a substantial liquefaction hazard that current building-code provisions do not fully address. Targeted ground-improvement measures, particularly deep soil mixing and stone columns along the Bagmati corridor, are recommended for critical infrastructure zones.
Summary
Source-checkedPlain-language reading of the full paper, prepared with AI and checked against the text. Each point links to the authors' own words.
Why it matters
- Soil liquefaction increases seismic risk by causing foundations to collapse and disrupting critical infrastructure when saturated granular deposits lose strength. View evidence ↗
- The Kathmandu Valley consists of a tectonic basin containing up to 550 meters of Quaternary sediments, including fluvial, lacustrine, and deltaic deposits. View evidence ↗
- High liquefaction risk exists in loose sands and silts along the Bagmati River corridor due to shallow groundwater tables, often only 2–4 meters deep. View evidence ↗
The question
- The study aimed to create the first spatially continuous liquefaction-susceptibility map of the Kathmandu Valley floor for urban planning purposes. View evidence ↗
What they did
- The researchers analyzed borehole logs from 147 geotechnical investigations conducted between 2009 and 2022. View evidence ↗
- The Cyclic Stress Ratio (CSR) was calculated at 1.5-meter intervals down to a depth of 20 meters, using a peak ground acceleration (PGA) of 0.36 g. View evidence ↗
- A 500-meter grid raster was produced using inverse-distance weighting (IDW) interpolation in ArcGIS Pro 3.1. View evidence ↗
What they found
- At a PGA of 0.36 g (475-year return period), approximately 38.2% of the valley area is highly or very-highly susceptible to liquefaction, particularly in the central paleo-lake bed and Bagmati River floodplain. View evidence ↗
- Fluvial sands showed high vulnerability with a mean corrected SPT blow count (N₁₆₀) of 8.4, whereas alluvial gravels were safer with a mean N₁₆₀ of 18.7. View evidence ↗
- Lacustrine silt and organic clay deposits are highly susceptible to strength loss, as their blow counts remained below the critical threshold of 10 down to 10 meters depth. View evidence ↗
- The model's reliability was validated by the fact that 82.6% (19 of 23) of sites with documented 2015 earthquake liquefaction were correctly classified as high or very-high susceptibility. View evidence ↗
- The model demonstrated good discriminatory power with an AUC-ROC value of 0.84. View evidence ↗
What it means
- The authors recommend an immediate revision of Nepal's building code to require site-specific liquefaction checks in identified hotspot zones. View evidence ↗
- Priority for ground-improvement measures should be given to critical infrastructure, such as hospitals and bridges, within the Bagmati corridor. View evidence ↗
- The simplified SPT-based method is less reliable for fine-grained deposits; future work should include cone penetration tests and shear-wave velocity data. View evidence ↗
Visual summary
3 visualsIllustrations explain the paper; charts are replotted from the paper's own table values.
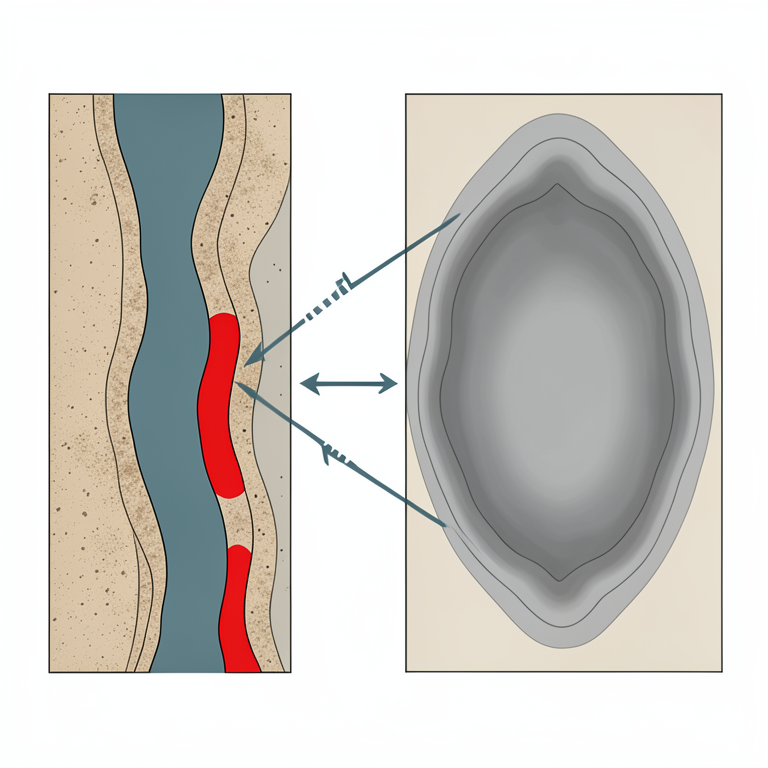
Liquefaction Hotspots
AI-generated conceptual illustration (Alluvial soil deposits in a river valley basin). It explains the idea and does not show study data.
View source evidence ↗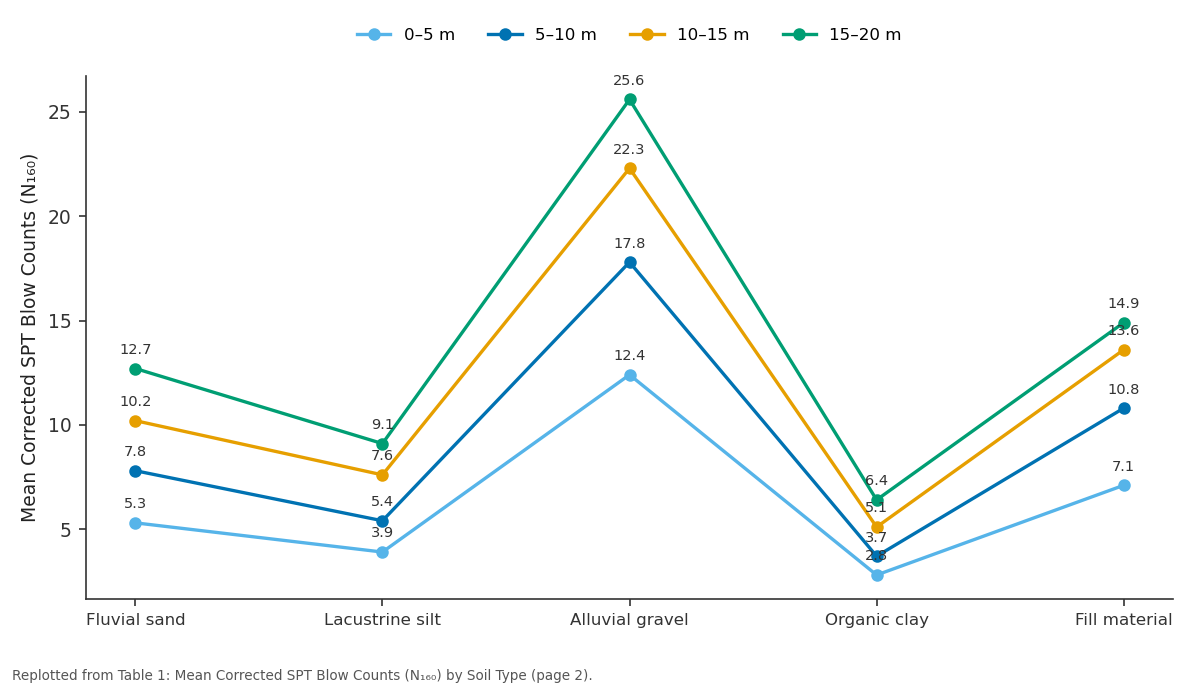
0–5 m and 5–10 m and more: Fluvial sand vs Lacustrine silt vs Alluvial gravel vs Organic clay vs Fill material
Replotted from Table 1 (page 2) of the original paper. Every bar is the paper's own table value.
View source evidence ↗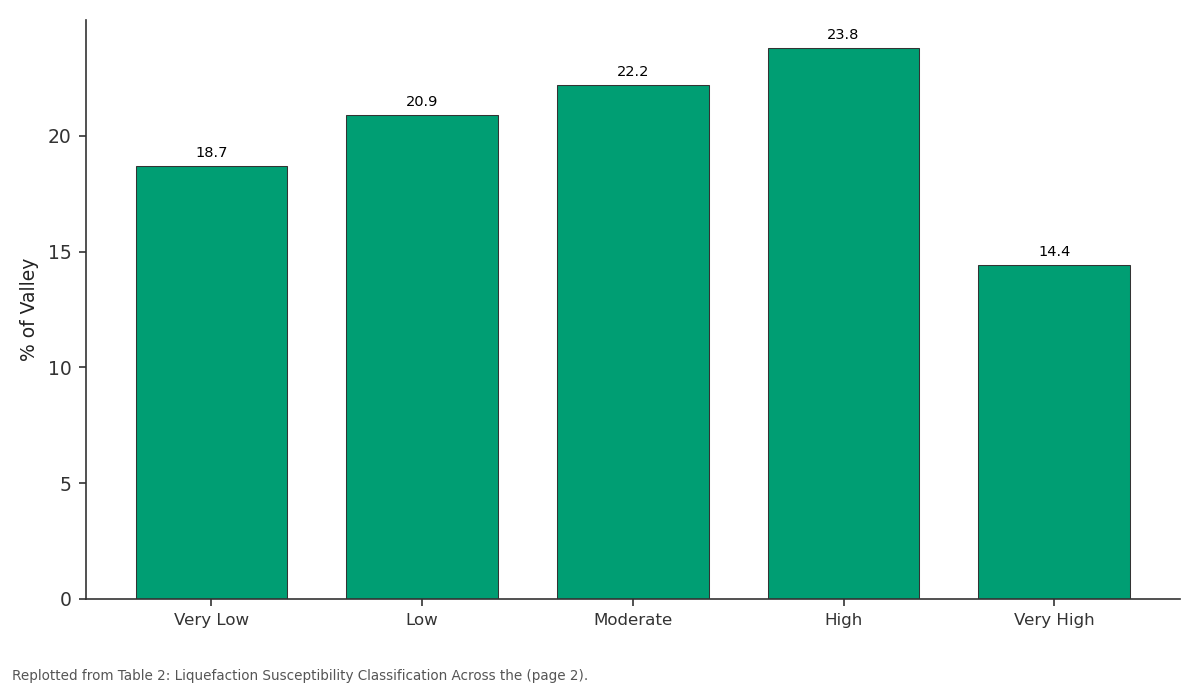
% of Valley: Very Low vs Low vs Moderate vs High vs Very High
Replotted from Table 2 (page 2) of the original paper. Every bar is the paper's own table value.
View source evidence ↗Figures & tables
From the original paper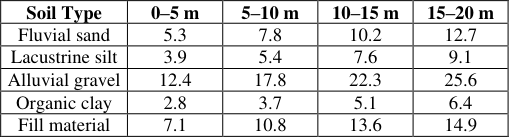 Table 1
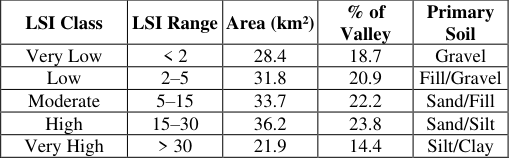 Table 2
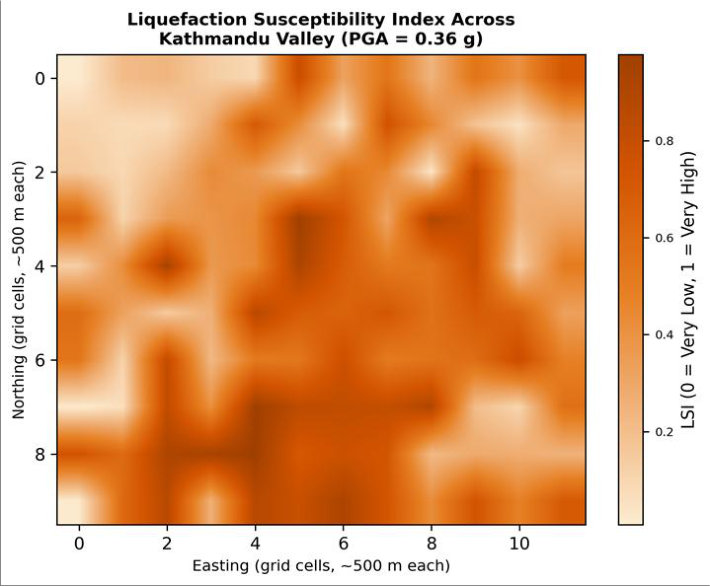 Figure 1
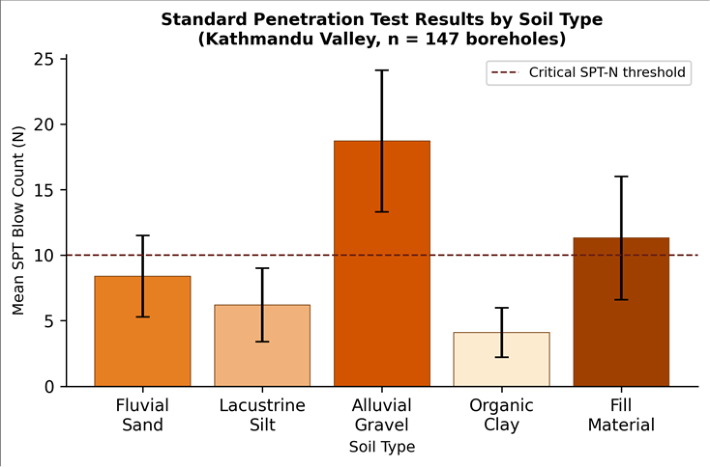 Figure 2
Introduction
The 2015 Gorkha earthquake (Mw 7.8) killed nearly 9,000 people and caused economic losses estimated at seven billion US dollars across Nepal, yet seismologists have long warned that even larger ruptures are overdue on the Main Himalayan Thrust beneath the Kathmandu Valley [1] . Ground shaking alone accounts for only part of the seismic risk; soil liquefaction-where saturated, loosely packed granular deposits lose strength during cyclic loading-can amplify damage by collapsing foundations, tilting structures, and disrupting buried lifelines [2] . Evidence of sand boils and lateral spreading during the 2015 event confirmed that parts of the valley are already susceptible at moderate shaking levels [3] . The Kathmandu Valley is a tectonic intermontane basin filled with up to 550 m of Quaternary lacustrine, fluvial, and deltaic sediments known collectively as the Kathmandu Basin Sediments [4] . Shallow groundwater tables-often within 2-4 m of the surface along the Bagmati River corridor-create ideal conditions for liquefaction in loose sands and silts [5] . Several localized liquefaction assessments were conducted after 2015, but they covered limited areas and used different analytical approaches, making valley-wide synthesis difficult [6] . This research aimed to produce the first spatially continuous liquefaction-susceptibility map for the entire Kathmandu Valley floor at a resolution relevant to urban planning. It compiled geotechnical data from 147 boreholes, applied a uniform analytical procedure based on the simplified method, and interpolated results into a GIS-based susceptibility index. The analysis was coordinated from the Faculty of Mountain and Polar Studies, Bariloche, Argentina, with geotechnical data sourced from published Nepali government and consulting-firm records [7] .
Theoretical Background: The simplified procedure for evaluating liquefaction potential, originally proposed by Seed and Idriss in 1971 and refined through several updates, remains the most widely used deterministic framework in geotechnical practice [8] .
It compares the cyclic stress ratio (CSR) induced by an earthquake at a given depth with the cyclic resistance ratio (CRR) of the soil at the same depth, derived from standard penetration test (SPT) blow counts corrected for overburden pressure, hammer energy, borehole diameter, and rod length [9] . The factor of safety against liquefaction is defined as FS = CRR / CSR, with values below 1.0 indicating likely triggering. The CSR is calculated as CSR = 0.65 × (amax/g) × (σv/σ′v) × rd, where amax is peak ground acceleration, σv and σ′v are total and effective vertical stresses, and rd is a depthreduction factor. CRR depends on the corrected blow count N₁₆₀ and is adjusted for fines content using empirical correlations [10] . By computing FS at each SPT depth interval and integrating over the liquefiable profile, a liquefaction susceptibility index (LSI) can be obtained that summarizes whole-borehole vulnerability into a single dimensionless number.
Performance Evaluation Against 2015 Observations
To validate the analytical framework, the computed LSI values were compared against documented liquefaction manifestations from the 2015 Gorkha earthquake. Of the 23 sites where sand boils, lateral spreading, or ground settlement were recorded by the Geological Survey of Nepal [3] , 19 (82.6%) fell within zones classified as high or veryhigh susceptibility by the present model at a PGA of 0.18 g (the estimated shaking level in 2015). The four misclassified sites were located on lake-bed silt deposits where the simplified SPT-based method is known to underperform because fines-content corrections become less reliable above 35% silt fraction [11] . Overall, the model achieved an area under the receiver-operating-characteristic curve (AUC-ROC) of 0.84, indicating good discriminatory power.
Material and Methods
Material and Methods
Material
Borehole logs from 147 geotechnical investigations conducted between 2009 and 2022 across the Kathmandu Valley were compiled from three sources: the Department of Mines and Geology of Nepal, published consulting reports from post-2015 reconstruction projects, and the Japan International Cooperation Agency (JICA) urban development database [12] . Each log provided SPT blow counts at 1.5 m intervals, soil descriptions, and groundwater-level measurements. Groundwater data were supplemented by records from 34 monitoring wells maintained by the Kathmandu Valley Water Supply Management Board. Seismic hazard parameters were drawn from the 2020 probabilistic seismic hazard analysis (PSHA) for Nepal, which assigned a PGA of 0.36 g for a 475-year return period at the valley center on bedrock [1] . Data processing and mapping were conducted at the Faculty of Mountain and Polar Studies, Bariloche, Río Negro, Argentina.
Methods
Raw SPT N-values were corrected to N₁₆₀ using the relationships of Skempton [13] , accounting for overburden pressure (CN), hammer energy ratio (CE = 0.75 for donut hammer typical in Nepal), borehole diameter (CB), and rod length (CR). Fines-content corrections followed Cetin et al. [10] . The CSR was computed for each 1.5 m depth interval down to 20 m using a site-amplified PGA of 0.36 g and depth-reduction factors from Idriss [14] . The factor of safety FS was calculated at each interval, and the LSI was obtained by integrating (1 -FS) over all intervals where FS < 1.0, weighted by the thickness of each sub-layer. LSI values were classified as very low (< 2), low (2-5), moderate (5-15), high (15-30), and very high (> 30). Spatial interpolation used inverse-distance weighting (IDW) with a power of 2 and a search radius of 2 km in ArcGIS Pro 3.1, producing a 500 m grid raster. Soil-type zonation was derived from the geological map of Shrestha et al. [4] . Together, the high and very-high classes cover 58.1 km² (38.2% of the valley floor), concentrated along the Bagmati and Bishnumati river corridors and the central paleo-lake bed-areas that also carry the densest residential and commercial development.
Results
Results
Discussion
The finding that 38.2% of the valley floor is classified as high or very-high susceptibility is broadly consistent with the reconnaissance observations of Gautam et al. [3] , who mapped widespread sand boils and lateral spreading in the same river-corridor zones during the 2015 event-despite the fact that the 2015 PGA was only about 0.18 g, roughly half the design-level shaking used here. Extrapolating to the full 0.36 g scenario suggests that liquefaction effects would extend well beyond the river corridors into the paleo-lake bed, an area currently occupied by dense mid-rise construction. The organic clay deposits recorded the lowest blow counts (mean N₁₆₀ = 4.1) but present a more complicated engineering picture because high-plasticity clays do not liquefy in the classic sense; instead, they undergo cyclic softening with significant strength loss but retain some residual resistance [15] . The simplified SPTbased method was not originally calibrated for such soils, and the fines-content correction becomes unreliable above 35% silt. For these zones, cyclic laboratory testing (e.g., cyclic triaxial or cyclic direct simple shear) would provide more reliable hazard estimates. Ground improvement is technically feasible for the highestrisk zones. Stone columns and deep soil mixing have been applied successfully in similar alluvial settings in Japan and Turkey [16] . But the cost of treating even the most critical infrastructure corridors-estimated at USD 8,000-12,000 per linear meter-is substantial for Nepal's public-works budget.
A risk-based prioritization framework, ranking corridors by the product of LSI and building exposure, would help direct limited resources to locations where the largest loss reductions can be achieved [17] .
Conclusion
This research produced a valley-wide liquefaction susceptibility map for Kathmandu based on 147 boreholes and a uniform SPT-based analytical procedure. Under a 475-year return-period PGA of 0.36 g, approximately 38.2% of the valley floor falls into high or very-high susceptibility classes, concentrated along the Bagmati River floodplain and the central paleo-lake bed. Fluvial sand and lacustrine silt are the most vulnerable deposit types, with mean corrected blow counts well below the critical triggering threshold. Validation against 2015 earthquake observations yielded an AUC-ROC of 0.84, indicating good predictive reliability.
From a policy perspective, these results argue for immediate revision of Nepal's building code to incorporate site-specific liquefaction checks in the identified hotspot zones. Groundimprovement measures should be prioritized for critical lifeline infrastructure-hospitals, bridges, and water-supply pipelines-within the Bagmati corridor. Future research should supplement the SPT-based approach with cone penetration test and shear-wave velocity data, which offer better resolution in the fine-grained deposits where the simplified method is least reliable.
Acknowledgement
Acknowledgements Funding SourcesThis research was supported by faculty grants for seismichazard investigations in developing regions. Institutional SupportThe authors acknowledge the Department of Environmental Studies, Faculty of Mountain and Polar Studies, Bariloche, Río Negro, Argentina, for GIS laboratory facilities.
Figures and tables from the paper
| Soil Type | 0–5 m | 5–10 m | 10–15 m | 15–20 m |
|---|---|---|---|---|
| Fluvial sand | 5.3 | 7.8 | 10.2 | 12.7 |
| Lacustrine silt | 3.9 | 5.4 | 7.6 | 9.1 |
| Alluvial gravel | 12.4 | 17.8 | 22.3 | 25.6 |
| Organic clay | 2.8 | 3.7 | 5.1 | 6.4 |
| Fill material | 7.1 | 10.8 | 13.6 | 14.9 |
Table text extracted from the original PDF; superscript letters are shown inline. The original table image is below.
View original table image
| LSI Class | LSI Range | Area (km²) | % of Valley | Primary Soil |
|---|---|---|---|---|
| Very Low | < 2 | 28.4 | 18.7 | Gravel |
| Low | 2–5 | 31.8 | 20.9 | Fill/Gravel |
| Moderate | 5–15 | 33.7 | 22.2 | Sand/Fill |
| High | 15–30 | 36.2 | 23.8 | Sand/Silt |
| Very High | > 30 | 21.9 | 14.4 | Silt/Clay |
Table text extracted from the original PDF; superscript letters are shown inline. The original table image is below.
View original table image
References
17 in the original paper- Stevens VL, Avouac JP. Millenary Mw > 9.0 earthquakes required by geodetic strain in the Himalaya. Geophysical Research Letters. 2016;43(3):1118-1123.
- Kramer SL. Geotechnical Earthquake Engineering. Prentice Hall. 1996;Upper Saddle River:1-653.
- Gautam D, Rodrigues H, Bhetwal KK, Neupane P, Sanada Y. Common structural and construction deficiencies of Nepalese buildings. Innovative Infrastructure Solutions. 2016;1(1):1-18.
- Shrestha OM, Koirala A, Karmacharya SL, Pradhananga UB, Pradhan R, Karmacharya R. Engineering and environmental geological map of the Kathmandu Valley. Department of Mines and Geology. 1998;Kathmandu.
- Piya BK. Generation of a Geological Database for Liquefaction Hazard Assessment in Kathmandu Valley. MSc Thesis, ITC, The Netherlands. 2004;Enschede:1141.
- Subedi M, Sharma K, Upadhayay B, Poudel RK, Khadka P. Soil liquefaction potential in Kathmandu Valley. Geotechnical and Geological Engineering. 2013;31(3):707-715.
- Molnar P, Tapponnier P. Cenozoic tectonics of Asia: effects of a continental collision. Science. 1975;189(4201):419-426.
- Seed HB, Idriss IM. Simplified procedure for evaluating soil liquefaction potential. Journal of the Soil Mechanics and Foundations Division. 1971;97(9):12491273.
- Youd TL, Idriss IM, Andrus RD, Arango I, Castro G, Christian JT, et al. Liquefaction resistance of soils: summary report from the 1996 NCEER and 1998 NCEER/NSF workshops. Journal of Geotechnical and Geoenvironmental Engineering. 2001;127(10):817-833.
- Cetin KO, Seed RB, Der Kiureghian A, Tokimatsu K, Harder LF, Kayen RE, et al. Standard penetration testbased probabilistic and deterministic assessment of seismic soil liquefaction potential. Journal of Geotechnical and Geoenvironmental Engineering. 2004;130(12):1314-1340.
- Boulanger RW, Idriss IM. CPT and SPT Based Liquefaction Triggering Procedures. Report No. UCD/CGM-14/01. 2014;Davis:1-134.
- JICA. The Project on Urban Transport Improvement for Kathmandu Valley. Japan International Cooperation Agency. 2012;Kathmandu.
- Skempton AW. Standard penetration test procedures and the effects in sands of overburden pressure, relative density, particle size, ageing and overconsolidation. Géotechnique. 1986;36(3):425-447.
- Idriss IM. An update to the Seed-Idriss simplified procedure for evaluating liquefaction potential. Proceedings, TRB Workshop on New Approaches to Liquefaction. 1999;Washington DC.
- Boulanger RW, Idriss IM. Evaluation of cyclic softening in silts and clays. Journal of Geotechnical and Geoenvironmental Engineering. 2007;133(6):641-652.
- Adalier K, Elgamal A. Mitigation of liquefaction and associated ground deformations by stone columns. Engineering Geology. 2004;72(3-4):275-291.
- Wald DJ, Worden CB, Quitoriano V, Pankow KL. ShakeMap Manual: Technical Manual, Users Guide, and Software Guide. USGS Techniques and Methods. 2005;12-A1:1-132.