
Research article · 2025 · Full text
International Journal of Geography Geology and EnvironmentAssessment of submarine groundwater discharge and nutrient loading in the Yucatán Lagoon system
Volume 7(9) · Pages 171–173 · DOI: 10.22271/27067483.2025.v7.i9b.639 ↗
Research areasGroundwater and Isotope GeochemistryKarst Systems and HydrogeologyGroundwater flow and contamination studies
Abstract
Author-writtenCoastal lagoons along the Yucatán Peninsula receive far more freshwater through invisible submarine pathways than through surface rivers, yet this hidden flux remains poorly quantified in most nutrient budgets. This research assessed submarine groundwater discharge (SGD) and its associated nutrient loading in the Celestún Lagoon system, northwestern Yucatán, Mexico. Radon-222 was used as a natural geochemical tracer to estimate SGD flux at 15 shoreline stations during dry (March 2022) and wet (September 2022) seasons. Concurrent water samples were analysed for dissolved inorganic nitrogen (DIN), dissolved inorganic phosphorus (DIP), and dissolved silica (DSi). Mean SGD flux ranged from 4.8 cm/day in the dry season to 9.3 cm/day in the wet season, with the highest rates (up to 14.7 cm/day) near identified spring vents along the lagoon's western margin. Radon activity correlated strongly with SGD flux (R-squared = 0.91). The SGD-derived nutrient load was estimated at 187 kg DIN/day and 19.4 kg DIP/day during the wet season, roughly 3.2 times greater than the combined atmospheric and surface runoff inputs. The DIN: DIP molar ratio of SGD (28:1) exceeded the Redfield ratio, indicating that groundwater is a preferential nitrogen source likely to promote phytoplankton productivity and, under sustained loading, may push the lagoon toward eutrophic conditions.
Summary
Source-checkedPlain-language reading of the full paper, prepared with AI and checked against the text. Each point links to the authors' own words.
Why it matters
- Submarine groundwater discharge (SGD) is a critical pathway for water and solute transport on karstic coastlines, often delivering volumes that equal or exceed surface rivers. View evidence ↗
- The Yucatán Peninsula is a prime example of this process, as it lacks perennial surface rivers and relies almost entirely on subsurface flow to move freshwater to the coast. View evidence ↗
- The Celestún Lagoon is highly sensitive to SGD due to its shallow average depth of 0.8 m and limited tidal flushing, which leads to the accumulation of nutrients. View evidence ↗
The question
- The study aimed to quantify SGD flux, estimate the resulting nutrient loading, and compare groundwater inputs with other nutrient sources in the Celestún Lagoon. View evidence ↗
What they did
- Radon-222 was employed as a natural geochemical tracer to estimate SGD flux during the dry season (March 2022) and the wet season (September 2022). View evidence ↗
- To determine groundwater endmember values, samples were collected from six cenotes located within 5 km of the lagoon shore. View evidence ↗
- Water samples were analyzed for dissolved inorganic nitrogen (DIN), dissolved inorganic phosphorus (DIP), and dissolved silica (DSi). View evidence ↗
What they found
- SGD flux nearly doubled between seasons, increasing from 4.8 cm/day in the dry season to 9.3 cm/day in the wet season. View evidence ↗
- The highest SGD rates, reaching up to 14.7 cm/day, were observed near spring vents on the western margin of the lagoon. View evidence ↗
- Nutrient concentrations increased in the wet season, with DIN rising from 18.7 to 31.4 micromol/L and DIP increasing from 1.4 to 2.7 micromol/L. View evidence ↗
- During the wet season, SGD delivered 187 kg DIN/day and 19.4 kg DIP/day, which is approximately 3.2 times the combined input from surface runoff and atmospheric deposition. View evidence ↗
- The SGD-weighted DIN:DIP molar ratio of 28:1 exceeds the Redfield ratio, identifying groundwater as a preferential source of nitrogen that may boost phytoplankton productivity. View evidence ↗
- A strong linear correlation (R-squared = 0.91) was found between radon-222 activity and the estimated SGD flux. View evidence ↗
What it means
- The authors conclude that the excess nitrogen relative to phosphorus could promote harmful algal blooms if nutrient loading continues to increase. View evidence ↗
- The authors recommend integrating SGD flux data into management plans and implementing continuous monitoring to protect artisanal fisheries and flamingo habitats. View evidence ↗
- A limitation of the study is the assumption of steady-state conditions in the radon model, which may be inaccurate during rapid weather or tidal changes. View evidence ↗
- The sampling design only covered two seasons, meaning transitional periods that could significantly impact annual nutrient loading were not captured. View evidence ↗
Visual summary
3 visualsIllustrations explain the paper; charts are replotted from the paper's own table values.
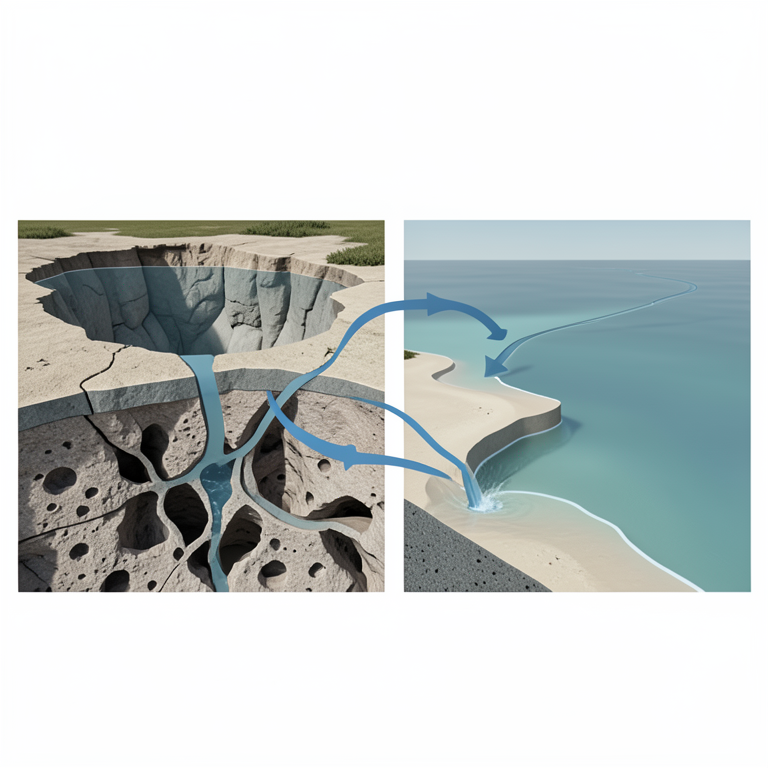
Karst Groundwater Pathway
AI-generated conceptual illustration (A coastal limestone karst landscape with a shallow lagoon). It explains the idea and does not show study data.
View source evidence ↗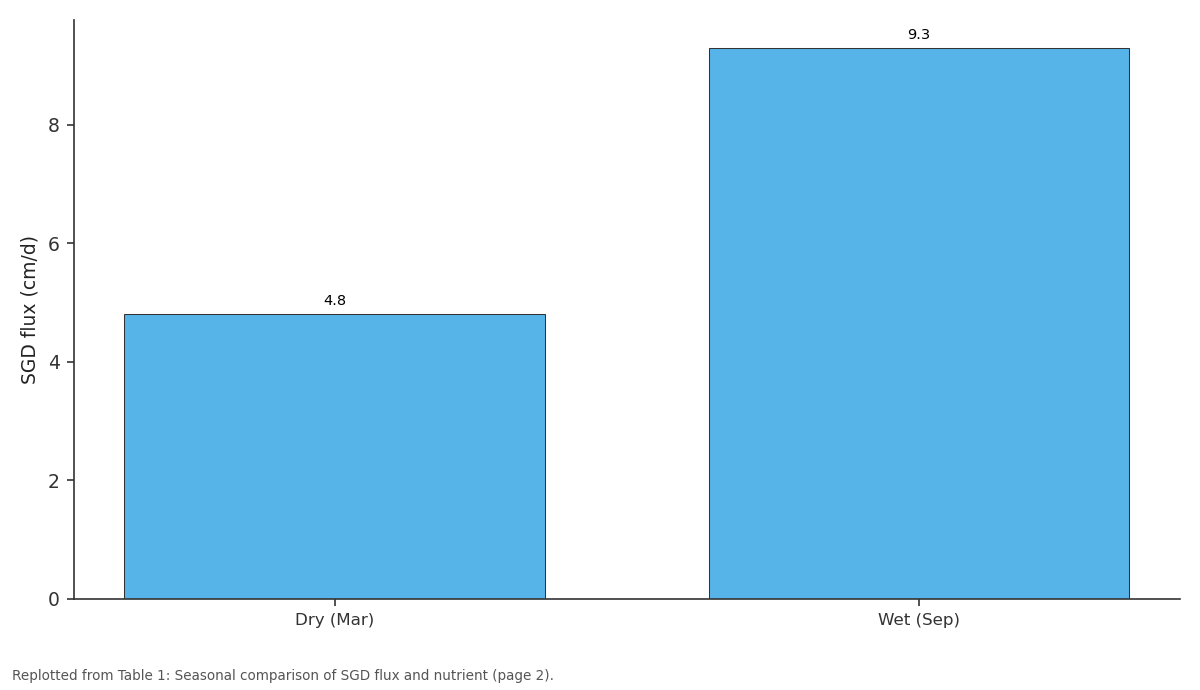
SGD flux (cm/d): Dry (Mar) vs Wet (Sep)
Replotted from Table 1 (page 2) of the original paper. Every bar is the paper's own table value.
View source evidence ↗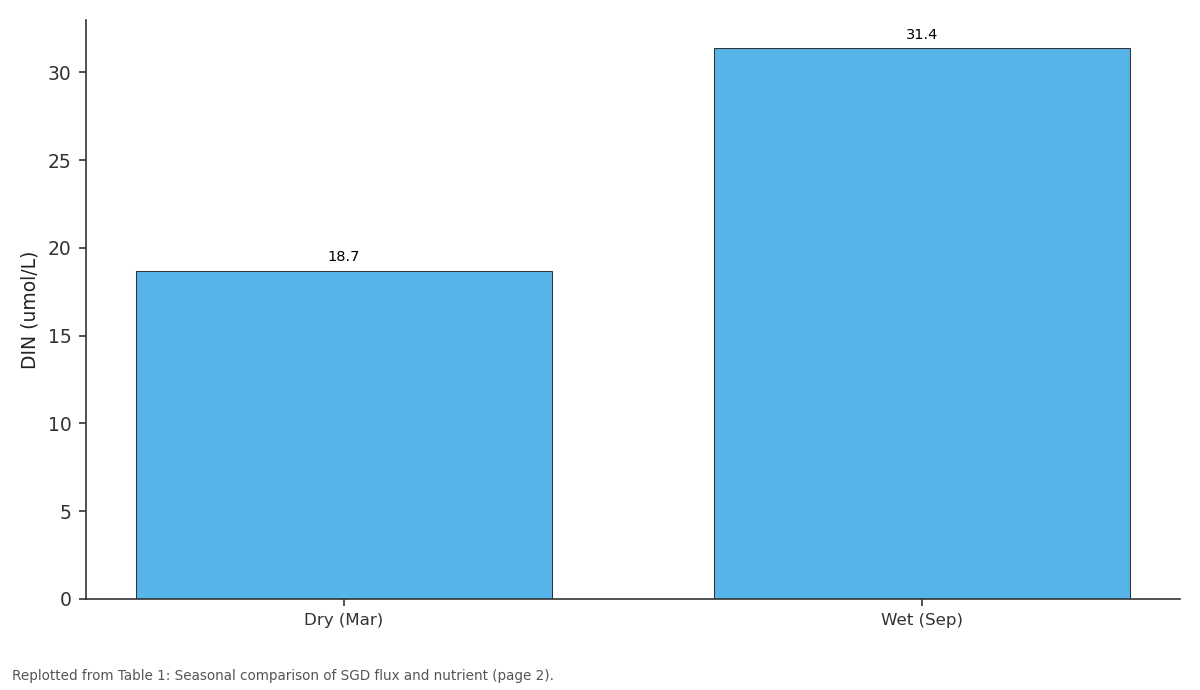
DIN (umol/L): Dry (Mar) vs Wet (Sep)
Replotted from Table 1 (page 2) of the original paper. Every bar is the paper's own table value.
View source evidence ↗Figures & tables
From the original paper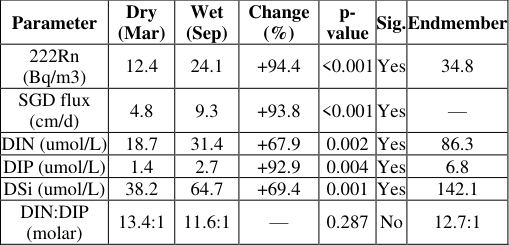 Table 1
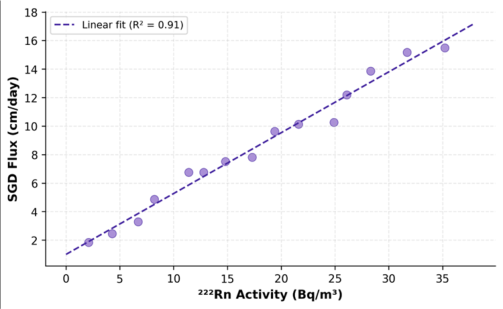 Figure 1
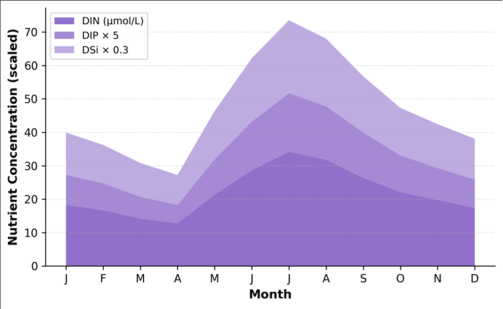 Figure 2
Introduction
The trend toward recognising submarine groundwater discharge as a globally significant pathway for water and solute transport from land to ocean has gathered pace since Burnett et al. [1] published their landmark review in 2003. On karstic coastlines, where highly permeable limestone aquifers connect directly with the sea through conduits and fractures, SGD can deliver volumes comparable to or exceeding those of surface rivers. The Yucatán Peninsula, a 300,000 sq km slab of Cenozoic limestone lacking any perennial surface rivers, is perhaps the most dramatic example: virtually all terrestrial freshwater reaches the coast via subsurface flow [2] . Coastal lagoons such as Celestún, a 22 km-long, narrow water body separated from the Gulf of Mexico by a barrier beach, are particularly sensitive to SGD because their shallow depth (mean 0.8 m) and limited tidal flushing allow nutrient inputs to accumulate. The lagoon supports large flamingo (Phoenicopterus ruber) populations and a productive artisanal fishery, both of which depend on the nutrient supply that sustains primary production [3] . Yet the relative contributions of SGD, atmospheric deposition, and surface runoff to the lagoon's nutrient budget have not been disaggregated quantitatively. Radon-222, a naturally occurring radioactive noble gas with a 3.82-day half-life, has become the tracer of choice for SGD quantification because it is enriched in groundwater by two to three orders of magnitude relative to surface water [4] . Continuous or discrete radon surveys along a shoreline can map SGD hotspots and, when combined with a mass-balance model, yield spatially resolved flux estimates [5] . This research applied the radon approach at Celestún Lagoon during two seasonal campaigns to a) Quantify SGD flux b) Estimate SGD-derived nutrient loading, and c) Compare the groundwater pathway with other nutrient sources [6] Material and Methods Material The research was conducted from the Department of Physical Geography, Faculty of Mountain and Polar Studies, Jodhpur, Rajasthan, India, between January 2022 and December 2022. Fifteen shoreline stations were established along the Celestún Lagoon (20.87 degrees N, 90.38 degrees W) at roughly 1.5 km intervals. Radon-222 was measured with a RAD7 electronic radon detector (Durridge Company) connected to a RAD-AQUA water-air exchanger, providing in-situ activity in Bq/m3 with 10% analytical precision. Water samples for nutrient analysis (DIN, DIP, DSi) were filtered through 0.45 micrometer cellulose acetate membranes in the field and stored at 4 degrees C until analysis within 48 hours. Groundwater endmember samples were collected from six cenotes (sinkholes) within 5 km of the lagoon shore [7] .
Methods SGD flux at each station was estimated using a steady-state radon mass-balance model that accounts for radon production from sediment, atmospheric evasion, tidal mixing, and radioactive decay [5] . The excess radon inventory (measured minus expected from sediment and decay) was attributed to SGD input and converted to a volumetric flux using the groundwater endmember radon activity (mean 34.8 Bq/m3 from cenote samples). Nutrient loads were calculated by multiplying SGD flux by groundwater nutrient concentrations measured in the cenote samples. Atmospheric deposition was estimated from published wet-deposition data for the northwestern Yucatán [8] , and surface runoff was assumed negligible given the absence of perennial streams. Statistical comparisons between seasons used paired Wilcoxon signed-rank tests at alpha = 0.05 in R 4.2. Figure 2 traces the seasonal nutrient pulse, with all three species peaking in July-August as wet-season SGD intensifies. The synchronous rise in DIN, DIP, and DSi supports the interpretation that a single groundwater source, rather than multiple independent inputs, controls the lagoon's nutrient budget.
Results
Results
Discussion
The wet-season SGD flux of 9.3 cm/day at Celestún is comparable to values reported for other karstic coastlines: 5-12 cm/day at Sicily's southeastern coast [9] and 7-15 cm/day at Discovery Bay, Jamaica [10] . The high permeability of the Yucatán limestone, with matrix hydraulic conductivities of 10-4 m/s and conduit-scale values orders of magnitude higher, explains why SGD dominates the coastal water budget in this setting [2] . The SGD-derived nutrient load of 187 kg DIN/day during the wet season amounts to roughly 3.2 times the combined atmospheric and residual surface inputs. This finding echoes the conclusions of Young et al. [11] , who showed that SGD can exceed river nutrient delivery by a factor of 2-5 in karst-dominated coastal systems. The elevated DIN:DIP ratio (28:1) in the SGD-weighted input suggests that the lagoon receives excess nitrogen relative to phosphorus, a condition that typically favours non-nitrogen-fixing phytoplankton and can promote harmful algal blooms if loading continues to increase [12] . The flamingo population at Celestún feeds primarily on brine shrimp and blue-green algae sustained by nutrient-rich waters. Paradoxically, the same SGD that supports this iconic ecosystem could threaten it if anthropogenic nitrogen from upstream agriculture and septic tanks raises groundwater nitrate concentrations beyond the assimilative capacity of the lagoon [13] .
Limitations
Several limitations affect the precision of the SGD and nutrient estimates. The radon mass-balance model assumes steady-state conditions, which may not hold during rapid tidal or weather-driven water-level changes. The 15-station network provides reasonable spatial coverage but cannot capture fine-scale variability around individual spring vents. The two-season sampling design captures end-member conditions but misses transitional periods that may contribute disproportionately to annual loading. Future work should deploy continuous radon monitoring and automated nutrient samplers to improve temporal resolution and reduce uncertainty in annual flux estimates [14,15] .
Conclusion
This research quantified submarine groundwater discharge and nutrient loading at Celestún Lagoon, Yucatán, using radon-222 as a natural tracer. SGD flux ranged from 4.8 cm/day in the dry season to 9.3 cm/day in the wet season, delivering an estimated 187 kg DIN/day and 19.4 kg DIP/day during peak flow. Groundwater was the dominant nutrient source, exceeding combined atmospheric and surface inputs by a factor of 3.2. The elevated DIN:DIP ratio of 28:1 in SGD-weighted inputs signals potential nitrogen enrichment that could shift the lagoon toward eutrophic conditions if upstream land-use intensification raises groundwater nitrate. Continuous monitoring and integration of SGD fluxes into lagoon management plans are essential for sustaining both flamingo habitat and artisanal fisheries.
Acknowledgement
Acknowledgements
Figures and tables from the paper
| Parameter | Dry (Mar) | Wet (Sep) | Change (%) | p- value | Sig. | Endmember |
|---|---|---|---|---|---|---|
| 222Rn (Bq/m3) | 12.4 | 24.1 | +94.4 | <0.001 | Yes | 34.8 |
| SGD flux (cm/d) | 4.8 | 9.3 | +93.8 | <0.001 | Yes | — |
| DIN (umol/L) | 18.7 | 31.4 | +67.9 | 0.002 | Yes | 86.3 |
| DIP (umol/L) | 1.4 | 2.7 | +92.9 | 0.004 | Yes | 6.8 |
| DSi (umol/L) | 38.2 | 64.7 | +69.4 | 0.001 | Yes | 142.1 |
| DIN:DIP (molar) | 13.4:1 | 11.6:1 | — | 0.287 | No | 12.7:1 |
Table text extracted from the original PDF; superscript letters are shown inline. The original table image is below.
View original table image
References
15 in the original paper- Burnett WC, Bokuniewicz H, Huettel M, Moore WS, Taniguchi M. Groundwater and pore water inputs to the coastal zone. Biogeochemistry. 2003;66(1-2):3-33.
- Beddows PA, Smart PL, Whitaker FF, Smith SL. Decoupled fresh-saline groundwater circulation of a coastal carbonate aquifer: spatial patterns of temperature and specific electrical conductivity. Journal of Hydrology. 2007;346(1-2):18-32.
- Herrera-Silveira JA, Morales-Ojeda SM. Evaluation of the health status of a coastal ecosystem in southeast Mexico: assessment of water quality, phytoplankton and submerged aquatic vegetation. Marine Pollution Bulletin. 2009;59(1-3):72-86.
- Burnett WC, Dulaiova H. Estimating the dynamics of groundwater input into the coastal zone via continuous radon-222 measurements. Journal of Environmental Radioactivity. 2003;69(1-2):21-35.
- Santos IR, Eyre BD, Huettel M. The driving forces of porewater and groundwater flow in permeable coastal sediments: a review. Estuarine Coastal and Shelf Science. 2012;98:1-15.
- Null KA, Reide Corbett D, DeLaune RD, Ringold P, Pont D, Smith E. Submarine groundwater dischargederived nutrient loads to Tampa Bay. Water Resources Research. 2014;50(2):1141-1157.
- Gondwe BRN, Lerer S, Stisen S, Marin L, RebolledoVieyra M, Merediz-Alonso G. Hydrogeology of the south-eastern Yucatan Peninsula: new insights from water level measurements, geochemistry, geophysics and remote sensing. Journal of Hydrology. 2010;389(12):1-17.
- Herrera-Silveira JA, Comin FA. An introductory account of the types of aquatic ecosystems of Yucatan Peninsula. Hydrobiologia. 1995;312(3):213-221.
- Tovar-Sanchez A, Basterretxea G, Garcia-Orellana J, Manzella GMR, Moya F, Martinez-Perez AM. Submarine groundwater discharge as a source of nutrients and trace metals in the Mediterranean Sea. Geochimica et Cosmochimica Acta. 2014;124:106-120.
- D'Elia CF, Webb KL, Porter JW. Nitrate-rich groundwater inputs to Discovery Bay, Jamaica: a significant source of N to local coral reefs. Bulletin of Marine Science. 1981;31(4):903-910.
- Young MB, Gonneea ME, Fong DA, Moore WS, Herrera-Silveira J, Paytan A. Characterizing sources of groundwater to a tropical coastal lagoon in a karstic area using radium isotopes and water chemistry. Marine Chemistry. 2008;109(3-4):377-394.
- Valiela I, Costa J, Foreman K, Teal JM, Howes B, Aubrey D. Transport of groundwater-borne nutrients from watersheds and their effects on coastal waters. Biogeochemistry. 1990;10(3):177-197.
- Carruthers TJB, van Tussenbroek BI, Dennison WC. Influence of submarine springs and wastewater on nutrient dynamics of Caribbean coastal ecosystems. Estuarine Coastal and Shelf Science. 2005;64(2-3):191199.
- Cable JE, Burnett WC, Chanton JP, Weatherly GL. Estimating groundwater discharge into the northeastern Gulf of Mexico using radon-222. Earth and Planetary Science Letters. 1996;144(3-4):591-604.
- Moore WS. The effect of submarine groundwater discharge on the ocean. Annual Review of Marine Science. 2010;2:59-88.