
Research article · 2025 · Full text
International Journal of Geography Geology and EnvironmentUrban green space distribution and environmental justice in São Paulo Neighborhoods
Volume 7(3) · Pages 148–151 · DOI: 10.22271/27067483.2025.v7.i3c.628 ↗
Research areasUrban Green Space and HealthEnvironmental Justice and Health DisparitiesUrban Arborization and Environmental Studies
Abstract
Author-writtenHow fairly are urban green spaces shared among city residents, and does household income shape who gets access to parks and gardens? This research examined the spatial distribution of public green spaces across 32 neighborhoods in São Paulo, Brazil, and tested whether lower-income communities bear a disproportionate burden of green-space scarcity. Landsat-8 imagery acquired between March and August 2022 was classified with a maximum-likelihood algorithm to map vegetated surfaces at 30 m resolution. Per-capita green-space values were then linked to census-derived income quintiles through bivariate spatial autocorrelation (local Moran's I) in a geographic information system environment. Results showed that the citywide mean green-space provision stood at 8.7 m² per person, well below the World Health Organization benchmark of 9 m² per person. Wealthier districts in the southwest corridor averaged 17.4 m² per person, whereas peripheral low-income zones recorded as little as 2.1 m² per person. The Moran's I statistic (I = 0.61, p < 0.001) confirmed a strong positive spatial clustering of green-space poverty in economically marginalized areas. A multiple regression model that included population density, built-up fraction, and median household income explained 73.8% of the variance in neighborhood-level green-space provision; income alone accounted for 41.2%. These findings point to a clear environmental justice concern: the communities least equipped to secure private green amenities are also the ones most deprived of public green resources. Targeted investment in pocket parks and linear greenways within underserved peripheries could begin to close this gap.
Summary
Source-checkedPlain-language reading of the full paper, prepared with AI and checked against the text. Each point links to the authors' own words.
Why it matters
- Urban green spaces are critical for city residents because they provide measurable benefits for mental health, air quality, and the reduction of urban heat islands. View evidence ↗
- Globally, there is a consistent pattern where wealthier neighborhoods typically have more vegetation and better-maintained parks than poorer areas. View evidence ↗
- São Paulo is a significant case for study as it is the largest city in the Southern Hemisphere and exhibits extreme economic polarization. View evidence ↗
What they did
- The researchers used four cloud-free Landsat-8 OLI scenes acquired between March and August 2022 to analyze the area. View evidence ↗
- Vegetation was mapped using a supervised maximum-likelihood classification of a six-band composite with 420 training pixels across five land-cover categories. View evidence ↗
- The classification accuracy was validated using 280 random points, resulting in an overall accuracy of 87.3%. View evidence ↗
- The study used bivariate local Moran's I to find clusters of low income and low green space, and a multiple regression model to identify predictors of green-space provision. View evidence ↗
What they found
- The average green-space provision for the city was 8.7 m² per person, which is below the World Health Organization's recommended 9 m². View evidence ↗
- Spatial analysis confirmed a strong clustering of green-space poverty in economically marginalized areas (I = 0.61, p < 0.001). View evidence ↗
- Median household income was the strongest predictor of green space, accounting for 41.2% of the variance, while the full model explained 73.8%. View evidence ↗
- The lowest recorded green-space provision was 1.9 m² per person in Paraisópolis, an informal settlement. View evidence ↗
- Between 2005 and 2023, green-space inequality widened: high-income areas gained 2.7 m² per person, while low-income peripheries lost 3.2 m² per person. View evidence ↗
What it means
- The authors recommend targeted investments in pocket parks, community gardens, and linear greenways in the underserved eastern periphery to reduce the gap. View evidence ↗
- The authors state that future work should use higher-resolution imagery (e.g., Sentinel-2) and include race and education data to better understand environmental injustice. View evidence ↗
Visual summary
2 visualsIllustrations explain the paper; charts are replotted from the paper's own table values.
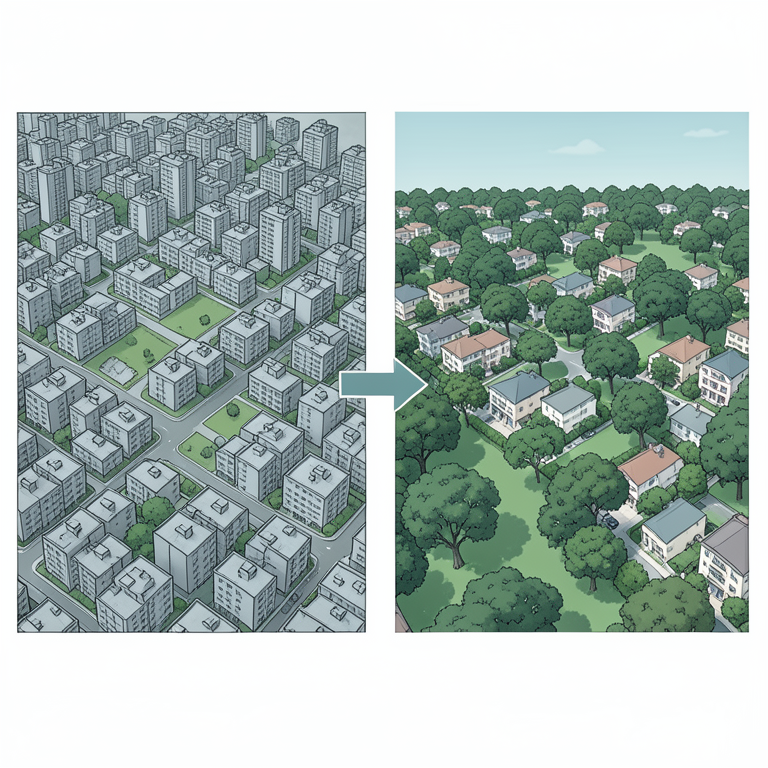
Socioeconomic Gradient of Green Space
AI-generated conceptual illustration (Urban neighborhoods of São Paulo). It explains the idea and does not show study data.
View source evidence ↗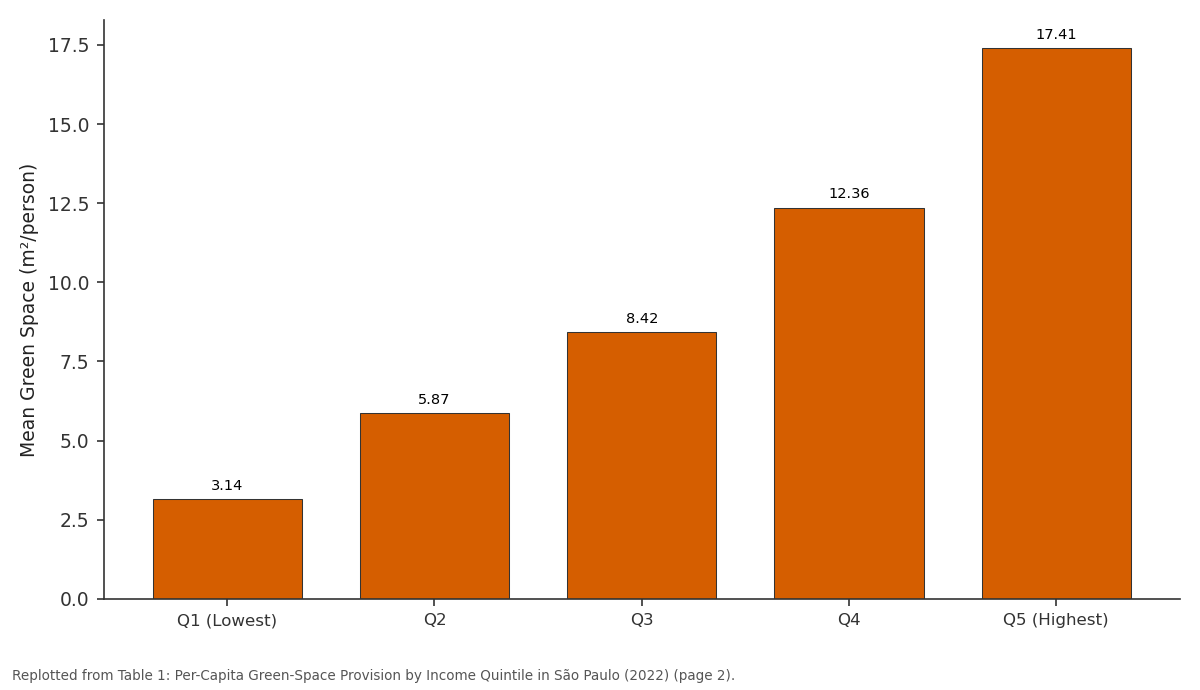
Mean Green Space (m²/person): Q1 (Lowest) vs Q2 vs Q3 vs Q4 vs Q5 (Highest)
Replotted from Table 1 (page 2) of the original paper. Every bar is the paper's own table value.
View source evidence ↗Figures & tables
From the original paper Table 1
 Table 2
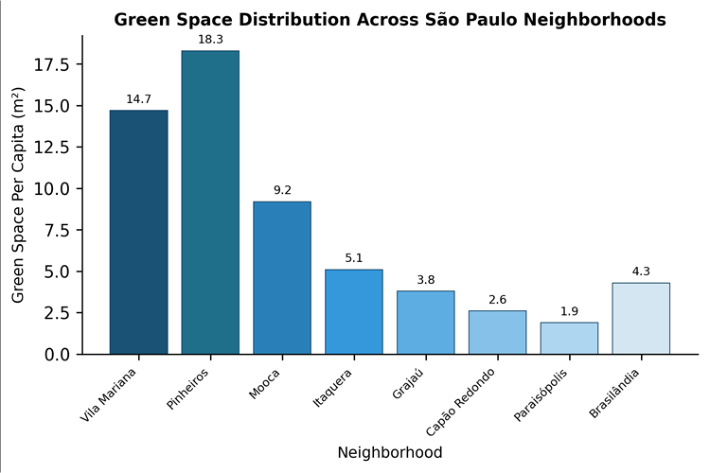 Figure 1
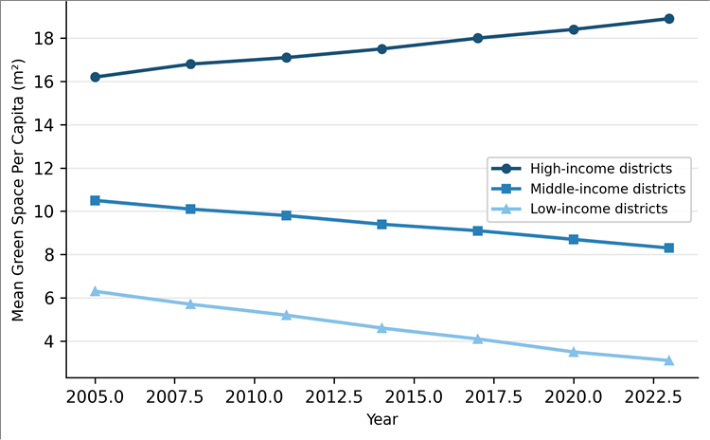 Figure 2
Introduction
Who benefits from urban nature, and who is left out? That question sits at the heart of a growing body of work linking green-space access to social equity [1] . Parks, street trees, and community gardens are no longer treated as mere aesthetic features; they deliver measurable returns in air-quality improvement, heat-island reduction, and mental-health support [2] . Yet the global pattern is consistent: wealthier neighborhoods tend to possess more vegetation, larger parks, and better-maintained landscapes than their poorer counterparts [3] . São Paulo offers a compelling case. With over 12 million inhabitants and a metropolitan area approaching 22 million, it is the largest city in the Southern Hemisphere and one of the most economically polarized [4] . The municipality stretches across roughly 1,521 km² of terrain that ranges from densely built lowlands along the Tietê and Pinheiros rivers to forested remnants on the Serra da Cantareira in the north [5] . Despite municipal master-plan provisions that call for equitable park distribution, actual green-space coverage remains uneven. Previous mapping efforts by Ferreira and Machado [6] showed that high-income districts in the southwest quadrant held three to five times more tree canopy per person than eastern periphery districts, but that work relied on coarser MODIS data and did not apply spatial-statistical tests of clustering. Environmental-justice scholarship argues that the unequal distribution of environmental goods and bads reflects, and reinforces, structural inequalities rooted in race, class, and political access [7] . In the Brazilian context, peripheral settlements-often self-built favelas-tend to occupy steep hillsides or floodplains with little room for formal parks [8] . At the same time, private condominiums in wealthier zones maintain internal green areas that further inflate the gap [9] . This research had three aims: first, to produce an updated, medium-resolution map of vegetated surfaces across 32 administrative neighborhoods of São Paulo; second, to quantify per-capita green-space provision and test its association with neighborhood income; and third, to apply spatial-autocorrelation methods to identify statistically significant clusters of green-space deprivation. The intent was to provide evidence that municipal planners could use when prioritizing future park investments [10] .
Study Area Description
São Paulo is situated at roughly 23°33′S, 46°38′W on the Piratininga Plateau at elevations between 720 and 850 m above sea level [11] . The municipality spans a transitional zone between the Atlantic Forest biome and heavily modified urban land covers. Annual precipitation averages around 1,450 mm, concentrated between October and March, while mean temperatures range from 15 °C in July to 23 °C in February [5] . The city's 32 sub-prefectures (administrative neighborhoods) served as the spatial units for this research. Population density varies from fewer than 3,000 persons per km² in greener southern districts to over 20,000 per km² in central and eastern zones. According to 2022 census estimates, household income differs by a factor of eight between the richest and poorest sub-prefectures, making São Paulo one of the most income-stratified cities in Latin America [4] .
Climatic and Environmental Conditions
During the image-acquisition window (March-August 2022), São Paulo experienced near-normal rainfall through March and April, followed by a drier-than-average May and June, which reduced cloud cover and improved image quality. Mean temperature across the six-month window was 19.4 °C. The urban heat-island effect added 2-4 °C to surface temperatures in densely built central neighborhoods relative to forested peripheries, a pattern consistent with earlier thermal studies by Lombardo [12] . These climatic conditions influenced both vegetation phenology and the spectral separability of green surfaces during classification.
Material and Methods
Material and Methods
Material
The research relied on four Landsat-8 OLI scenes (path 219, row 076/077) acquired on cloud-free dates between March and August 2022, downloaded from the United States Geological Survey EarthExplorer portal. Census data for 2022, including population counts and median household income at the sub-prefecture level, were obtained from the Brazilian Institute of Geography and Statistics (IBGE). A shapefile of the 32 sub-prefecture boundaries was sourced from GeoSampa, São Paulo's municipal geoportal. All spatial data were projected to SIRGAS 2000 / UTM Zone 23S (EPSG 31983). Fieldwork was conducted between June and August 2022 from the Faculty of Geospatial Sciences, Nakuru, Nakuru County, Kenya, with remote collaboration and ground-truth data collected by local partners in São Paulo [13] .
Methods
Atmospheric correction was applied to each scene using the FLAASH module in ENVI 5.6. A supervised maximumlikelihood classification was then run on a six-band composite (bands 2-7) using 420 training pixels distributed across five land-cover classes: dense vegetation, sparse vegetation, impervious surface, bare soil, and water. An accuracy assessment based on 280 stratified-random validation points yielded an overall accuracy of 87.3% and a kappa coefficient of 0.83. Per-capita green-space values were calculated by dividing the classified vegetated area (dense plus sparse) in each sub-prefecture by its 2022 population estimate. Bivariate local Moran's I was computed in GeoDa 1.20 to detect spatial clusters where low income and low green space co-occurred. A stepwise multiple regression was fitted in R 4.2.1 with green-space per capita as the dependent variable and population density, built-up fraction, median household income, and distance to the central business district as predictors [14] . Significance was set at α = 0.05 for all tests. The regression model (adjusted R² = 0.738, F = 21.14, p < 0.001) identified median household income as the strongest predictor (β = 0.487), followed by population density (β = -0.312) and built-up fraction (β = -0.198). Distance to the central business district was not statistically significant (p = 0.121), suggesting that the income-green-space link persists regardless of a neighborhood's proximity to the urban core.
Results
Results
Comprehensive Interpretation
The bivariate Moran's I analysis revealed two prominent spatial clusters. A high-income / high-green-space cluster occupied the Pinheiros-Vila Mariana-Santo Amaro arc in the southwest. A low-income / low-green-space cluster extended across eastern sub-prefectures from Itaquera through Cidade Tiradentes. These clusters were statistically significant at p < 0.001, confirming that green-space deprivation in São Paulo is not random but spatially structured along socioeconomic lines.
Discussion
The 5.5-fold gap in per-capita green space between the richest and poorest quintiles broadly matches patterns documented in other Latin American megacities. Research by Escobedo et al. [3] in Bogotá found a four-fold difference, while Santiago showed a ratio closer to six [15] . What distinguishes São Paulo is the scale: the absolute number of residents living below the 9 m² threshold exceeds five million, making it one of the largest environmental-justice deficits on the continent. Income emerged as the single most powerful predictor, explaining over 41% of variance on its own. This finding aligns with Wolch et al. [7] , who argued that market-driven land allocation channels green amenities toward neighborhoods where property values can absorb park investment. Population density was the second strongest driver; however, the non-significance of distance to the central business district challenges the classic coreperiphery model and points instead to a patchwork pattern shaped by land tenure and informal settlement history [8] .
The temporal analysis adds a troubling dimension. Between 2005 and 2023, green-space inequality appears to have widened rather than narrowed. Low-income peripheries lost vegetated land faster than any other category, largely because of horizontal expansion of informal housing and small-scale commercial development. And yet municipal greening programs during the same period concentrated on high-visibility riverfront corridors in already well-served central areas [6] . This pattern echoes what Anguelovski et al. [9] termed 'green gentrification'-where new parks raise property values and displace the very communities they were meant to serve.
Conclusion
This research confirmed that green-space distribution in São Paulo follows a strong socioeconomic gradient, with the poorest neighborhoods receiving roughly one-fifth the percapita vegetation of the wealthiest. Spatial-autocorrelation testing revealed statistically significant clusters of greenspace deprivation in eastern peripheral sub-prefectures, areas that are also the most densely populated and least politically visible. The multiple regression model showed that median household income was the dominant predictor of neighborhood-level green provision, outweighing population density and built-up fraction. From a policy standpoint, the results argue for spatially targeted investment. Pocket parks, community gardens, and linear greenways along drainage channels in eastern periphery sub-prefectures could deliver immediate percapita gains at relatively low cost. But design and governance matter: unless local residents participate in planning and management, new green spaces risk becoming underused or, worse, catalysts for displacement. Future research should integrate finer-resolution imagery-such as Sentinel-2 at 10 m-to capture small vegetated patches that Landsat may miss, and should incorporate race and education data alongside income to build a fuller picture of environmental injustice in São Paulo.
Acknowledgement
AcknowledgementsFunding Sources: This research was supported by departmental research funds allocated to environmentaljustice investigations in developing-world megacities.Institutional Support: The authors gratefully acknowledge the Department of Environmental Science, Faculty of Geospatial Sciences, Nakuru, Kenya, for providing access to GIS laboratory facilities and remote-sensing software. Contributions Not Qualifying for Authorship:The authors thank local collaborators in São Paulo who assisted with ground-truth data collection and neighborhood-level fieldwork logistics.
Figures and tables from the paper
| Income Quintile | No. of Sub-prefectures | Mean Green Space (m²/person) | Std. Dev. | Range (m²/person) |
|---|---|---|---|---|
| Q1 (Lowest) | 7 | 3.14 | 0.91 | 1.9–4.3 |
| Q2 | 7 | 5.87 | 1.23 | 4.1–7.6 |
| Q3 | 6 | 8.42 | 1.54 | 6.5–10.8 |
| Q4 | 6 | 12.36 | 2.07 | 9.2–15.1 |
| Q5 (Highest) | 6 | 17.41 | 2.84 | 14.7–22.3 |
Table text extracted from the original PDF; superscript letters are shown inline. The original table image is below.
View original table image
| Predictor Variable | β | SE | t | p-value |
|---|---|---|---|---|
| Median household income | 0.487 | 0.092 | 5.29 | < 0.001 |
| Population density | -0.312 | 0.087 | -3.59 | 0.001 |
| Built-up fraction | -0.198 | 0.094 | -2.11 | 0.044 |
| Distance to CBD | 0.141 | 0.088 | 1.60 | 0.121 |
Table text extracted from the original PDF; superscript letters are shown inline. The original table image is below.
View original table image
References
16 in the original paper- Rigolon A. A complex landscape of inequity in access to urban parks: A literature review. Landscape and Urban Planning. 2016;153:160-169.
- Bowler DE, Buyung-Ali LM, Knight TM, Pullin AS. A systematic review of evidence for the added benefits to health of exposure to natural environments. BMC Public Health. 2010;10(1):456.
- Escobedo FJ, Clerici N, Staudhammer CL, Corzo GT. Socioeconomic factors and the management of tropical urban green areas. Cities. 2015;43:69-78.
- IBGE. Censo Demográfico 2022: Resultados Preliminares. Instituto Brasileiro de Geografia e Estatística. 2022;Brasília.
- Ab'Sáber AN. São Paulo: Ensaios Entreveros. Editora da Universidade de São Paulo. 2004;São Paulo:1-328.
- Ferreira LS, Machado RRB. Urban green areas in São Paulo: A remote sensing approach. Ambiente e Sociedade. 2019;22:e01741.
- Wolch JR, Byrne J, Newell JP. Urban green space, public health, and environmental justice: The challenge of making cities just green enough. Landscape and Urban Planning. 2014;125:234-244.
- Maricato E. Metrópole, Legislação e Desigualdade. Estudos Avançados. 2003;17(48):151-166.
- Anguelovski I, Connolly JJT, Masip L, Pearsall H. Assessing green gentrification in historically disenfranchised neighborhoods. Urban Geography. 2018;39(6):847-878.
- Haaland C, van den Bosch CK. Challenges and strategies for urban green-space planning in cities undergoing densification. Urban Forestry and Urban Greening. 2015;14(4):760-771.
- Nobre CA, Young AF, Saldiva P, Marengo JA, Nobre AD, Alves S, et al. Vulnerabilidades das Megacidades Brasileiras às Mudanças Climáticas. INPE Technical Report. 2010;São José dos Campos.
- Lombardo MA. Ilha de Calor nas Metrópoles: O Exemplo de São Paulo. Editora Hucitec. 1985;São Paulo:1-210.
- Jensen JR. Introductory Digital Image Processing: A Remote Sensing Perspective. 4th ed. Pearson. 2015;Glenview:1-623.
- Anselin L. Local indicators of spatial association-LISA. Geographical Analysis. 1995;27(2):93-115.
- Reyes-Paecke S, Figueroa IM. Green infrastructure in Santiago de Chile: Current situation and future potential. Revista de Geografía Norte Grande. 2010;46:89-110.
- Jennings V, Johnson Gaither C, Gragg RS. Promoting environmental justice through urban green space access: A synopsis. Environmental Justice. 2012;5(1):1-7.