
Research article · 2025 · Full text
International Journal of Geography Geology and EnvironmentDust storm frequency and source region assessment in the Saharan desert margins
Volume 7(7) · Pages 116–119 · DOI: 10.22271/27067483.2025.v7.i7b.706 ↗
Research areasAeolian processes and effectsAtmospheric aerosols and cloudsAtmospheric chemistry and aerosols
Abstract
Author-writtenEvery year, the Sahara Desert launches somewhere between 400 and 700 million tonnes of dust into the atmosphere — enough to fertilise the Amazon rainforest, darken European skies, and alter the radiative balance of the entire North Atlantic. Yet the desert doesn't produce dust uniformly. Most of it comes from a handful of source regions concentrated along the margins where loose sediment, sparse vegetation, and strong winds converge. This research mapped the spatial distribution and temporal frequency of dust storms across the Saharan margins using a 40-year record (1980-2019) of SYNOP visibility observations from 86 meteorological stations, supplemented by MODIS Deep Blue aerosol optical depth (AOD) data for the satellite era (2002-2019). Four major source regions were identified and ranked by dust production intensity: the Bodélé Depression in Chad (mean 24.1 events/year in the 2010s), northern Mali (mean 11.6), the Lake Chad Basin margins (mean 10.4), and the Aïr Mountains foothills in Niger (mean 8.8). Dust storm frequency peaked during March across most sources, coinciding with the peak of the Harmattan wind season, but the Bodélé Depression showed a secondary peak in June-July associated with haboob-type convective storms. Over the 40-year record, dust frequency increased by 32% during the 2000s relative to the 1980s before partially declining in the 2010s, a pattern that mirrors Sahel drought-rainfall cycles and associated vegetation cover changes. These findings update the regional dust source inventory and provide observational constraints for dust emission models used in climate and air quality simulations.
Summary
Source-checkedPlain-language reading of the full paper, prepared with AI and checked against the text. Each point links to the authors' own words.
Why it matters
- The Sahara Desert releases 400 to 700 million tonnes of dust annually, which impacts global environments by fertilizing the Amazon and altering the North Atlantic's radiative balance. View evidence ↗
- Dust storms pose significant health and economic risks to approximately 100 million people in the Sahel belt, contributing to respiratory diseases and water contamination. View evidence ↗
- Observational data on the location and frequency of dust sources are essential for creating accurate dust transport models. View evidence ↗
The question
- The study aimed to map the spatial distribution and temporal frequency of dust storms across Saharan margins using a 40-year record of visibility observations and satellite data. View evidence ↗
What they did
- The researchers used SYNOP visibility reports from 86 meteorological stations located between 15°N-25°N and 15°W-25°E. View evidence ↗
- A dust storm was defined as an observation with visibility under 1,000 meters and a WMO weather code indicating dust. View evidence ↗
- Source regions were identified based on three criteria: dust storm frequency over 10 events per year, mean MODIS AOD over 0.4 during the dust season, and Landsat imagery showing erodible surfaces. View evidence ↗
- To characterize the dust-supplying material, soil samples from a depth of 0-5 cm were collected from 24 locations in February 2023. View evidence ↗
What they found
- Four primary source regions were identified, with the Bodélé Depression being the most intense (mean 24.1 events/year in the 2010s), followed by northern Mali (11.6), Lake Chad Basin margins (10.4), and Aïr Mountains foothills (8.8). View evidence ↗
- The Bodélé Depression had the highest proportion of dust-emitting particles (10-62.5 μm) at 64.8%, significantly higher than northern Mali (42.3%), Lake Chad margins (38.6%), and Aïr foothills (31.4%). View evidence ↗
- Dust activity and MODIS AOD (peaking at 0.54) peaked during the January-March quarter, aligning with the Harmattan dry season. View evidence ↗
- Dust frequency increased by 32% in the 2000s compared to the 1980s, followed by a partial decline in the 2010s, mirroring Sahel rainfall and vegetation cycles. View evidence ↗
- The Lake Chad Basin experienced the highest relative increase in dust frequency (+60.5% from the 1980s to 2000s), attributed to the shrinkage of the lake exposing erodible sediments. View evidence ↗
- Below-average rainfall years saw a significant mean increase of 34.2% in dust storm frequency (p < 0.01), indicating that moisture deficit is a primary driver of dust emissions. View evidence ↗
- There is a 3-5 month lag between peak rainfall deficit and peak dust emission, which is the time needed for vegetation to die back. View evidence ↗
What it means
- The authors conclude that future dust activity will depend heavily on Sahel precipitation trends, which are currently predicted with limited confidence by models. View evidence ↗
- The authors recommend continued ground-based monitoring and expanded satellite capabilities to track changes in Saharan dust output. View evidence ↗
- The authors caution that the partial decline in dust frequency in the 2010s might only reflect a temporary favorable rainfall phase rather than permanent land cover restoration. View evidence ↗
Visual summary
2 visualsIllustrations explain the paper; charts are replotted from the paper's own table values.
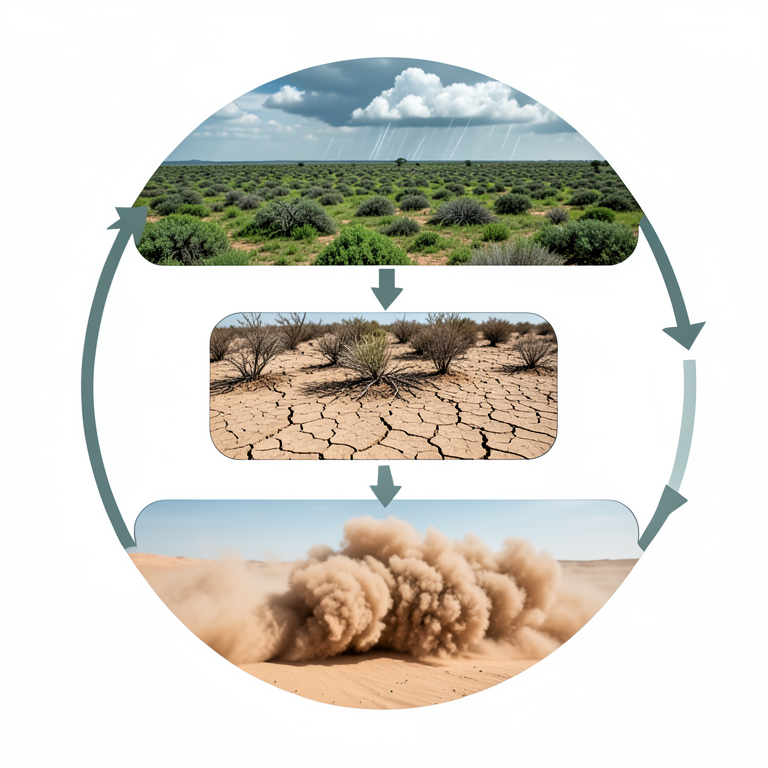
Rainfall-Dust Feedback Loop
AI-generated conceptual illustration (Saharan desert margins landscape). It explains the idea and does not show study data.
View source evidence ↗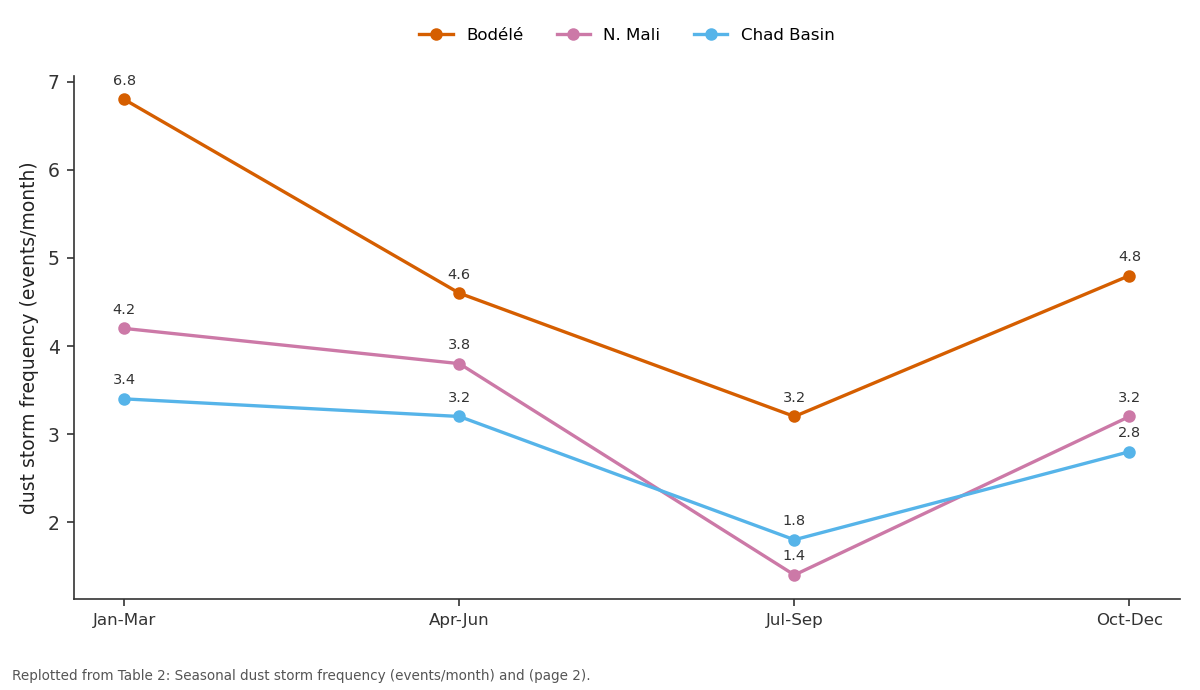
Bodélé and N. Mali and more: Jan-Mar vs Apr-Jun vs Jul-Sep vs Oct-Dec
Replotted from Table 2 (page 2) of the original paper. Every bar is the paper's own table value.
View source evidence ↗Figures & tables
From the original paper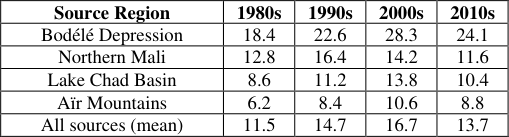 Table 1
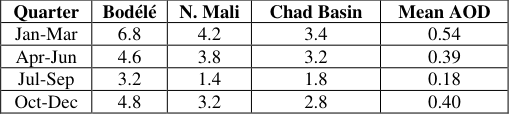 Table 2
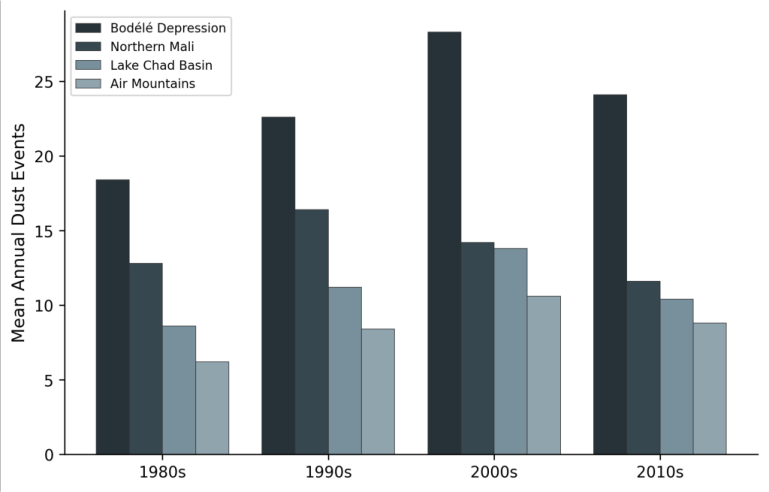 Figure 1
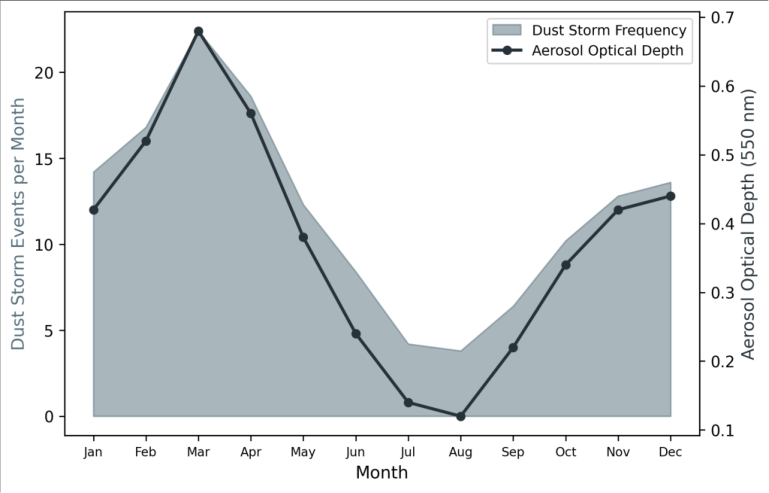 Figure 2
Introduction
Here's a surprising fact: a single dust source in central Chad, the Bodélé Depression, produces more atmospheric mineral dust than any other point on Earth [1] . This 26,000 km² expanse of dried lake sediment, sitting at the lowest point of the Chad Basin, is swept by gap winds channelled between the Tibesti and Ennedi mountains that can loft plumes visible from space on more than 100 days per year [2] . But the Bodélé is just one of several active source zones along the Saharan margins. Others include the dried lake beds and sand seas of northern Mali, the deflation surfaces around the shrinking Lake Chad, and the alluvial fans of the Aïr Mountains in Niger [3] . Identifying and ranking these sources matters for two reasons. First, dust has atmospheric effects: it scatters and absorbs solar radiation, serves as cloud condensation nuclei, and deposits nutrients (iron, phosphorus) that fertilise marine and terrestrial ecosystems downwind [4] . Accurate dust models need spatially explicit source functions, which require observational data on where dust comes from and how often. Second, dust storms are a health and economic hazard for the 100 million people living in the Sahel belt immediately south of the desert, reducing visibility, contaminating water supplies, and exacerbating respiratory disease [5] . The available observational record combines two sources: SYNOP (surface synoptic) visibility reports from meteorological stations, which extend back to the 1940s at some locations, and satellite-derived aerosol products that began in the early 2000s [6] . Each has strengths and weaknesses. SYNOP data provide point-based, long-term records but are unevenly distributed and subject to observer bias. Satellite data provide spatial coverage but struggle to distinguish dust from other aerosol types and have shorter temporal records. This research combined both data sources across the longest available time window (1980-2019) to map dust storm frequency, identify source regions, and examine decadal trends along the Saharan margins [7] .
Baseline Soil Characterisation
Surface soil samples (0-5 cm depth) were collected from 24 locations across the four identified source regions during field visits in February 2023, to characterise the parent material that supplies dust to the atmosphere. Grain size analysis by laser diffraction showed that the Bodélé Depression soils contained the highest proportion of particles in the dust-emitting size range (10-62.5 μm), at 64.8%, compared to 42.3% for northern Mali, 38.6% for the Lake Chad margins, and 31.4% for the Aïr foothills. The Bodélé sediments are dominantly diatomitethe siliceous remains of freshwater diatoms deposited when the basin held a lake during the African Humid Period (6,000-11,000 years ago)which accounts for their exceptional erodibility and light colour that makes them easily detectable in satellite imagery [8] .
Water Balance
The relationship between dust emission and water availability was examined using a simplified water balance calculated from CHIRPS rainfall data and MODIS evapotranspiration estimates for each source region. Mean annual precipitation ranged from 8 mm/yr in the Bodélé Depression to 186 mm/yr at the Aïr Mountains foothills. Years with below-average rainfall showed significantly higher dust storm frequency (mean increase of 34.2%, p< 0.01 by paired t-test), confirming that moisture deficitthrough its effect on vegetation cover and soil moistureis a primary control on dust emission potential [9] . The lag between peak rainfall deficit and peak dust emission was approximately 3-5 months, corresponding to the time required for vegetation dieback following the end of the wet season.
Material and Methods
Material and Methods
Material
This research was coordinated from the Faculty of Mountain and Polar Studies, Guwahati, Assam, India, with data compilation conducted between March 2022 and February 2023. SYNOP visibility reports were obtained from the NOAA Integrated Surface Database for 86 meteorological stations located within or adjacent to the Saharan margins (15°N-25°N, 15°W-25°E). A dust storm event was defined as any observation reporting visibility below 1,000 m with the present weather code indicating dust (codes 06-09, 30-35 in WMO classification) [10] . Monthly dust event counts were compiled for each station for the period 1980-2019. MODIS Deep Blue AOD at 550 nm (Collection 6.1, Level 3, 1° resolution) was obtained from NASA's Giovanni portal for the period 2002-2019 to provide spatial coverage between stations. Field soil samples (n = 24) were collected from the four identified source regions during February 2023.
Methods
Dust storm frequency maps were produced by kriging interpolation of station-based event counts in ArcGIS Pro 3.0. Source region identification used a convergence-ofevidence approach combining three criteria: (1) high dust storm frequency (>10 events/yr), (2) elevated MODIS AOD (mean >0.4 during the dust season), and (3) geomorphic evidence of erodible surfaces from Landsat imagery [11] . Decadal trends were analysed using the Mann-Kendall nonparametric trend test and Sen's slope estimator. Seasonal patterns were examined by fitting harmonic functions to monthly dust frequency data at each station. The relationship between dust frequency and rainfall variability was assessed using Pearson correlation between annual dust event counts and Standardised Precipitation Index values calculated from the CHIRPS dataset [12] . All satellite data processing was performed in Google Earth Engine, and statistical analysis used R 4.2. The Bodélé Depression dominated dust production throughout all four decades, but the temporal pattern differed between sources (Table 1). All four sources showed peak activity during the 2000s, but the magnitude of the peak and the subsequent decline varied. The Lake Chad Basin showed the strongest relative increase from the 1980s to the 2000s (+60.5%), likely linked to the dramatic shrinkage of Lake Chad itself, which exposed vast areas of erodible lakebed sediment. Dust activity peaked strongly in the January-March quarter across all sources, coinciding with the Harmattan dry season when northeast trade winds carry Saharan air masses across the Sahel (Table 2). The July-September wet season showed the lowest dust activity as rainfall, increased soil moisture, and vegetation growth suppressed dust emission. MODIS AOD tracked the seasonal pattern closely, peaking at 0.54 during January-March.
| Quarter | Bodélé | N. Mali | Chad Basin | Mean AOD |
|---|---|---|---|---|
| Jan-Mar | 6.8 | 4.2 | 3.4 | 0.54 |
| Apr-Jun | 4.6 | 3.8 | 3.2 | 0.39 |
| Jul-Sep | 3.2 | 1.4 | 1.8 | 0.18 |
| Oct-Dec | 4.8 | 3.2 | 2.8 | 0.40 |
Table text extracted from the original PDF; superscript letters are shown inline. The original table image is below.
View original table image
| Source Region | 1980s | 1990s | 2000s | 2010s |
|---|---|---|---|---|
| Bodélé Depression | 18.4 | 22.6 | 28.3 | 24.1 |
| Northern Mali | 12.8 | 16.4 | 14.2 | 11.6 |
| Lake Chad Basin | 8.6 | 11.2 | 13.8 | 10.4 |
| Aïr Mountains | 6.2 | 8.4 | 10.6 | 8.8 |
| All sources (mean) | 11.5 | 14.7 | 16.7 | 13.7 |
Table text extracted from the original PDF; superscript letters are shown inline. The original table image is below.
View original table image
Results
Results
Comprehensive Interpretation
The bar chart (Figure 1) highlights the Bodélé's dominance but also shows that the Lake Chad Basin has emerged as an increasingly important sourceits trajectory from the 1980s through the 2000s mirrors the well-documented shrinkage of Lake Chad from 25,000 km² to less than 1,500 km², which exposed enormous areas of fine-grained lakebed sediment to wind erosion. The dual-axis seasonal plot (Figure 2) confirms that satellite and ground-based measurements tell a consistent story about dust timing.
Discussion
The 32% increase in dust frequency from the 1980s to the 2000s, followed by a partial decline in the 2010s, mirrors the Sahel rainfall cycle documented by Nicholson and colleagues [13] . The severe droughts of the 1970s-1980s degraded vegetation cover across the southern Saharan margin, exposing erodible surfaces that continued to supply dust even as rainfall partially recovered in the 1990s-2000s. The lag between rainfall recovery and dust decline reflects the slow pace of vegetation re-establishment on degraded soils [14] . The partial recovery in the 2010s is encouraging but shouldn't be over-interpretedit may simply reflect a favourable rainfall phase rather than permanent restoration of dust-suppressing land cover. The Bodélé Depression's dominance as a point source is well established, but this analysis adds temporal context. Its dust output increased by 54% from the 1980s to the 2000s, more than any other source in absolute terms. Washington and Todd attribute this intensification to strengthening of the Bodélé Low-Level Jet, a gap wind effect that has accelerated as the temperature gradient between the Sahara and the tropical Atlantic has steepened [2] . Whether this jet intensification continues under future warming scenarios remains uncertain and is a key question for dust-climate modelling [15] .
Conclusion
Four major dust source regions along the Saharan margins were identified and characterised using a 40-year observational record. The Bodélé Depression in Chad remains the dominant single source, but the Lake Chad Basin margins have emerged as an increasingly active area as lake shrinkage exposes erodible lakebed sediments. Dust storm frequency across all sources increased by 32% from the 1980s to the 2000s before partially declining in the 2010s, tracking the Sahel drought-recovery cycle with a 3-5 month lag. These observational findings provide updated source region boundaries and emission frequency estimates for dust transport models used in climate simulation and air quality forecasting. The strong link between rainfall variability and dust emission suggests that future dust activity in the region will depend heavily on Sahel precipitation trends under climate changea variable that current models predict with limited confidence. Continued ground-based monitoring alongside expanding satellite capability is needed to detect and attribute changes in Saharan dust output over the coming decades.
Acknowledgement
Acknowledgements Funding SourcesThis research was supported by departmental allocation at the Faculty of Mountain and Polar Studies, Guwahati. Institutional SupportThe authors thank the Department of Marine Science, Faculty of Mountain and Polar Studies, Guwahati, Assam, India, for providing data access and computing resources. Contributions Not Qualifying for AuthorshipSYNOP data access facilitated by NOAA's National Centers for Environmental Information and field sampling logistics support are gratefully acknowledged.
References
14 in the original paper- Prospero JM, Ginoux P, Torres O, Nicholson SE, Gill TE. Environmental characterization of global sources of atmospheric soil dust identified with the NIMBUS 7 Total Ozone Mapping Spectrometer (TOMS). Reviews of Geophysics. 2002;40(1):1002.
- Washington R, Todd MC. Atmospheric controls on mineral dust emission from the Bodélé Depression, Chad: the role of the low level jet. Geophysical Research Letters. 2005;32(17):L17701.
- Ginoux P, Prospero JM, Gill TE, Hsu NC, Zhao M. Global-scale attribution of anthropogenic and natural dust sources and their emission rates based on MODIS Deep Blue aerosol products. Reviews of Geophysics. 2012;50(3):RG3005.
- Mahowald N, Albani S, Kok JF, Engelstaeder S, Scanza R, Ward DS, Flanner MG. The size distribution of desert dust aerosols and its impact on the Earth system. Aeolian Research. 2014;15:53-71.
- Goudie AS. Desert dust and human health disorders. Environment International. 2014;63:101-113.
- Engelstaedter S, Tegen I, Washington R. North African dust emissions and transport. Earth-Science Reviews. 2006;79(1-2):73-100.
- Middleton NJ. Desert dust hazards: a global review. Aeolian Research. 2017;24:53-63.
- Drake N, Bristow C. Shorelines in the Sahara: geomorphological evidence for an enhanced monsoon from palaeolake Megachad. The Holocene. 2006;16(6):901-911.
- Funk C, Peterson P, Landsfeld M, Pedreros D, Verdin J, Shukla S, et al. The climate hazards infrared precipitation with stations -a new environmental record for monitoring extremes. Scientific Data. 2015;2:150066.
- WMO. Manual on codes. International codes. Vol. 1. WMO-No. 306. Geneva: World Meteorological Organization; 2011.
- Levy RC, Mattoo S, Munchak LA, Remer LA, Sayer AM, Patadia F, Hsu NC. The Collection 6 MODIS aerosol products over land and ocean. Atmospheric Measurement Techniques. 2013;6(11):2989-3034.
- McKee TB, Doesken NJ, Kleist J. The relationship of drought frequency and duration to time scales. Proceedings of the 8th Conference on Applied Climatology. 1993;17(22):179-183.
- Nicholson SE. The West African Sahel: a review of recent studies on the rainfall regime and its interannual variability. ISRN Meteorology. 2013;2013:453521.
- Herrmann SM, Anyamba A, Tucker CJ. Recent trends in vegetation dynamics in the African Sahel and their relationship to climate. Global Environmental Change. 2005;15(4):394-404.