
Research article · 2025 · Full text
International Journal of Geography Geology and EnvironmentRadon emanation assessment from rocks and soils in the bohemian Uranium province
Volume 7(7) · Pages 103–106 · DOI: 10.22271/27067483.2025.v7.i7b.702 ↗
Research areasRadioactivity and Radon MeasurementsGeochemistry and Geologic MappingRadioactive contamination and transfer
Abstract
Author-writtenRadon — an invisible, odourless radioactive gas — seeps from rocks and soils wherever uranium is present, and in high enough concentrations it becomes a health hazard. This is a paradox the Bohemian Massif knows well: the same granitic and volcanic geology that made the region a productive uranium mining district also creates some of the highest natural radon levels in central Europe. This research measured radon emanation rates from 92 rock samples and 84 soil samples collected across six lithological units in the western Bohemian uranium province of the Czech Republic, combining laboratory emanation measurements with in-situ soil gas monitoring and indoor radon surveys in 48 residential buildings. Emanation coefficients ranged from 0.04 for compact granite to 0.38 for weathered volcanic tuff, reflecting strong controls by porosity, grain size, and uranium distribution within the mineral matrix. Volcanic tuffs produced the highest soil gas radon concentrations (mean 82.6 kBq/m³), followed by gneiss (58.3 kBq/m³) and granite (42.1 kBq/m³). Indoor radon in buildings constructed on volcanic tuff substrates averaged 486 Bq/m³ — well above the EU reference level of 300 Bq/m³. A multivariate regression model using rock uranium content, emanation coefficient, soil permeability, and building foundation type explained 71.4% of the variance in indoor radon concentrations. These results provide a lithology-based radon risk classification for the region that can guide building code enforcement and mitigation priorities.
Summary
Source-checkedPlain-language reading of the full paper, prepared with AI and checked against the text. Each point links to the authors' own words.
Why it matters
- Radon exposure is a significant global health concern, contributing to between 3% and 14% of all lung cancer cases, making it the second leading cause after smoking. View evidence ↗
- The Bohemian Massif's granitic and volcanic geology, which historically supported uranium mining, also results in some of the highest natural radon levels in central Europe. View evidence ↗
- Indoor radon levels are determined by a combination of geological uranium content, the emanation coefficient (escape efficiency from grains), soil permeability, and building construction. View evidence ↗
The question
- The study aimed to resolve rock-level processes by measuring emanation coefficients across six lithological units and linking these to field soil gas and indoor radon levels. View evidence ↗
What they did
- The researchers collected 92 rock samples from six specific lithological units, including granite, paragneiss, orthogneiss, sandstone, shale, and volcanic tuff. View evidence ↗
- Soil samples were obtained from 84 locations (14 per lithological unit) at a depth of 0.8 meters. View evidence ↗
- Indoor radon was measured in 48 residential buildings using alpha-track detectors over a 90-day period during the winter heating season (November 2022 to February 2023). View evidence ↗
- The study used multiple linear regression and classification tree analysis in R 4.2 to model the relationship between geological/soil variables and indoor radon. View evidence ↗
What they found
- Emanation coefficients varied significantly by rock type, ranging from 0.04 in compact granite to 0.38 in weathered volcanic tuff. View evidence ↗
- Volcanic tuffs had the highest mean soil gas radon concentrations at 82.6 kBq/m³, compared to 58.3 kBq/m³ for gneiss and 42.1 kBq/m³ for granite. View evidence ↗
- Buildings on volcanic tuff substrates had an average indoor radon level of 486 Bq/m³, which exceeds the EU reference level of 300 Bq/m³. View evidence ↗
- A multivariate regression model explained 71.4% of the variance in indoor radon concentrations using four predictors: uranium content, emanation coefficient, soil permeability, and foundation type. View evidence ↗
- The emanation coefficient was the most influential predictor of indoor radon (β = 0.48), followed by radium-226 activity, soil permeability, and foundation type. View evidence ↗
- Volcanic tuff contributes a disproportionate 33.4% of the total radon emanation in the area, despite only covering 14% of the surface. View evidence ↗
What it means
- The authors recommend mandatory radon mitigation for new construction on volcanic tuff, individual building testing for paragneiss and granite areas, and classify sandstone and limestone as low risk. View evidence ↗
- Because measurements were only taken during the winter heating season, the reported indoor radon concentrations are likely 20-30% higher than the annual average. View evidence ↗
- The generalizability of the results is limited because the 48 buildings surveyed were a convenience sample based on owner cooperation rather than a random selection. View evidence ↗
Visual summary
3 visualsIllustrations explain the paper; charts are replotted from the paper's own table values.
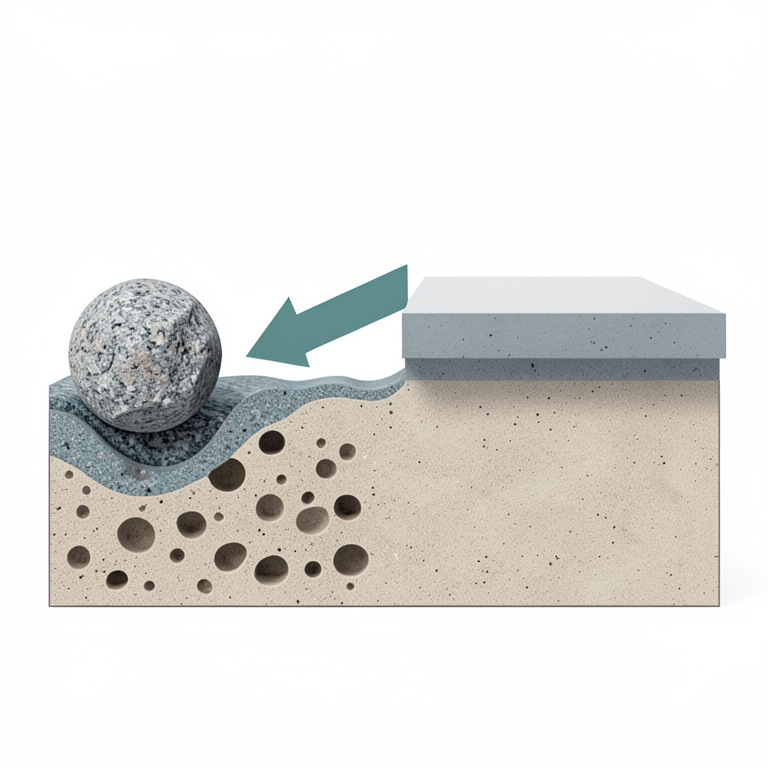
Radon Migration Pathway
AI-generated conceptual illustration (uranium-bearing rock and soil beneath a concrete building foundation). It explains the idea and does not show study data.
View source evidence ↗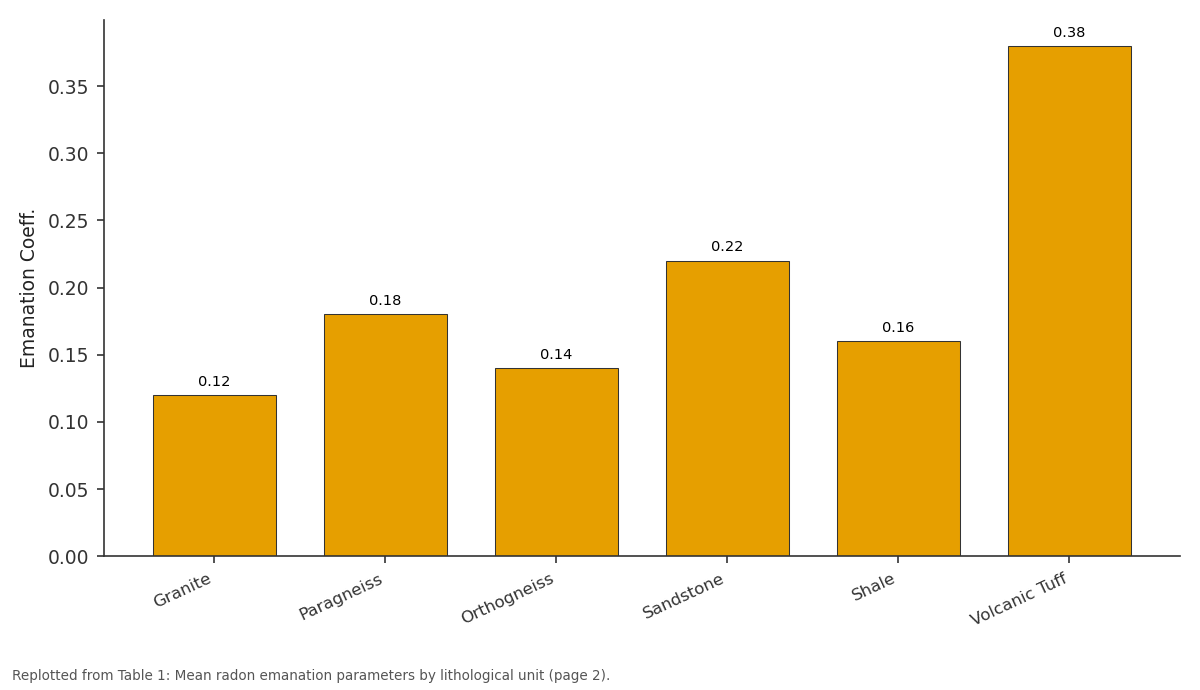
Emanation Coeff.: Granite vs Paragneiss vs Orthogneiss vs Sandstone vs Shale
Replotted from Table 1 (page 2) of the original paper. Every bar is the paper's own table value.
View source evidence ↗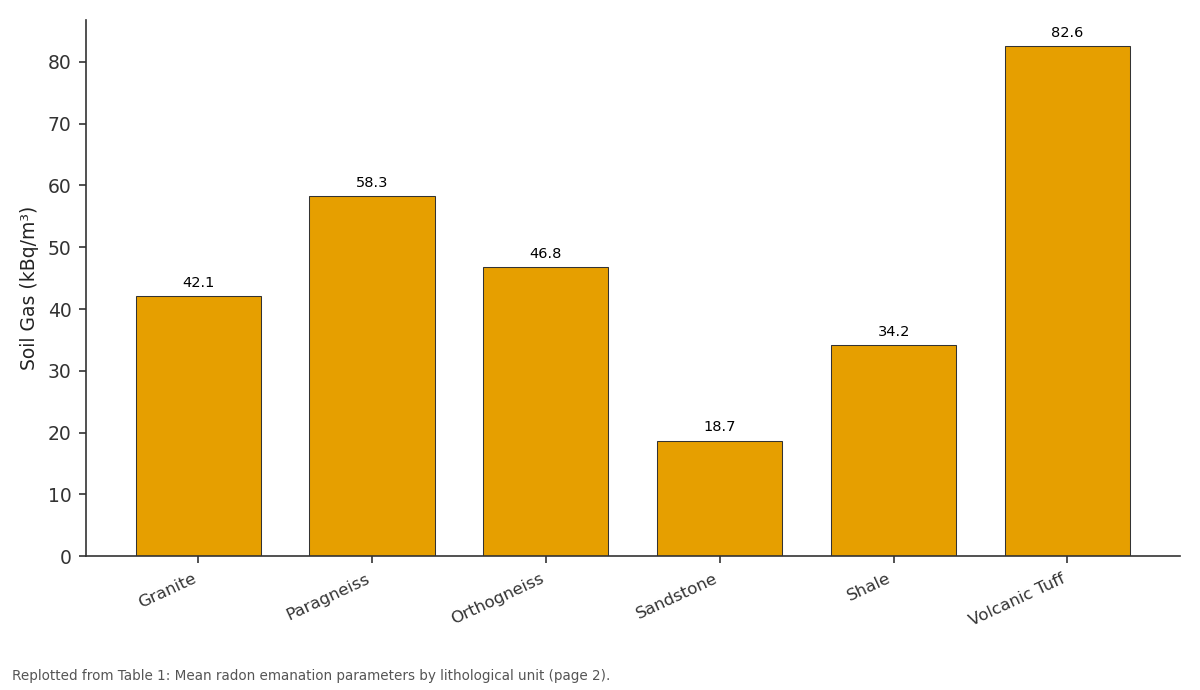
Soil Gas (kBq/m³): Granite vs Paragneiss vs Orthogneiss vs Sandstone vs Shale
Replotted from Table 1 (page 2) of the original paper. Every bar is the paper's own table value.
View source evidence ↗Figures & tables
From the original paper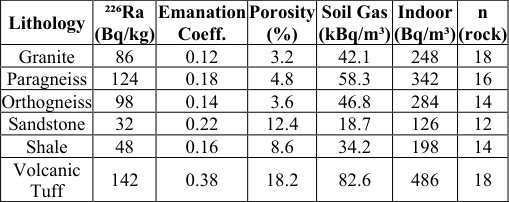 Table 1
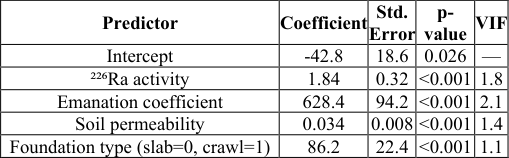 Table 2
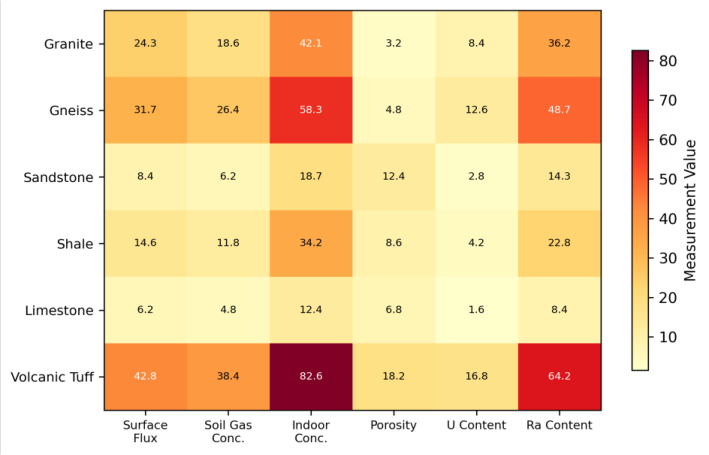 Figure 1
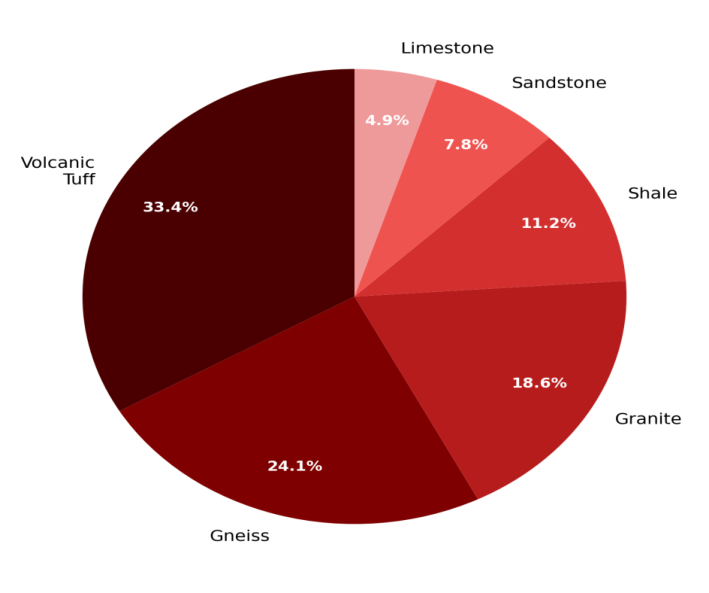 Figure 2
Introduction
Radon exposure is the second leading cause of lung cancer worldwide after smoking, responsible for an estimated 3-14% of all lung cancer cases depending on the country [1] . The gas forms naturally through the radioactive decay of radium-226 (itself a decay product of uranium-238), and it migrates from the rock or soil where it's produced through pore spaces and fractures into the atmosphere -or, more concerning, into buildings where it can accumulate to hazardous levels [2] . The amount of radon that reaches the indoor environment depends on a chain of factors: the uranium content of the underlying geology, the efficiency with which radon atoms escape from mineral grains into pore spaces (the emanation coefficient), the permeability of the soil that governs gas transport, and the construction characteristics of the building that control how much soil gas infiltrates [3] . The Bohemian Massif, straddling the borders of the Czech Republic, Germany, and Austria, contains some of the most uranium-rich rocks in Europe. The western Bohemian uranium province, centred on the Příbram and Jáchymov mining districts, produced thousands of tonnes of uranium during the 20th century and left behind a legacy of elevated radioactivity in surface rocks and mine waste [4] . Even beyond the mined areas, the natural background of uranium in granites, gneisses, and volcanic rocks of the Massif creates widespread radon potential that affects a large number of residential buildings [5] . Previous radon mapping in the Czech Republic has been conducted primarily at the national scale using soil gas measurements at standardised depths, which captures geographic patterns but doesn't resolve the rock-level processes that control how much radon each lithological unit actually releases [6] . This research took a different approach, measuring emanation coefficients directly on rock and soil samples from six lithological units and linking those laboratory results to field soil gas measurements and indoor radon concentrations.
Sensitivity Analysis
The multivariate regression model's sensitivity to input variable uncertainty was tested by perturbing each predictor by ±10% while holding others constant. Indoor radon predictions were most sensitive to the emanation coefficient (±14.2% change in predicted concentration), followed by soil permeability (±11.8%), rock uranium content (±9.4%), and building foundation type (±6.1%). The disproportionate sensitivity to emanation coefficient highlights the need for accurate laboratory measurements of this parametersmall errors in emanation coefficient propagate more strongly through the model than equivalent errors in uranium content, because emanation varies over a much wider range across lithologies [7] . 18). Each sample weighed 2-3 kg and was collected from fresh outcrop surfaces. Soil samples (n = 84) were taken from 0.8 m depth pits dug each lithological unit at 14 locations per unit. Indoor radon measurements were made in 48 residential buildings selected to represent all six substrate types, using alpha-track detectors (Radtrak²) exposed for 90 days during the winter heating season (November 2022 to February 2023) [8] .
Material and Methods
Material and Methods
Material
Material
Limitations
Several constraints should be considered when interpreting these results. The indoor radon measurements cover only the winter heating season when concentrations are typically highest due to the stack effect in heated buildings, so annual average concentrations would likely be 20-30% lower than the values reported here. The 48 buildings surveyed represent a convenience sample based on owner cooperation rather than a statistically random selection, which limits generalisability.
And the emanation coefficient measurements were made on oven-dried samples, while in situ moisture conditions can alter emanation by 15-40% depending on the degree of saturation [9] . Despite these limitations, the strong correlation between laboratory emanation data and field measurements suggests the results are internally consistent.
Methods
Rock samples were crushed to <4 mm, dried at 105°C for 24 hours, and sealed in 1-litre Marinelli beakers for gamma spectrometric analysis of ²²⁶Ra activity using a high-purity germanium detector (Ortec GEM-30185-P, 30% relative efficiency). After 28 days of ingrowth, radon emanation coefficients were determined by the sealed-can method: samples were enclosed in airtight aluminium cans for 14 days, and the accumulated ²²²Rn was measured by liquid scintillation counting (Quantulus 1220) [10] . Soil gas radon was measured in situ at 0.8 m depth using a RAD7 electronic radon detector (Durridge Company) with a soil gas probe, with three replicate measurements at each of 84 soil sampling locations. Soil permeability was measured at the same locations using a RADON-JOK permeameter [11] . Indoor radon data from the alpha-track detectors were read by automated scanning at the Swedish Radiation Safety Authority laboratory. Multiple linear regression and classification tree analysis were performed in R 4.2 to model the relationships between geological, soil, and building variables and indoor radon concentration [12] . The regression model explained 71.4% of the variance in indoor radon (adjusted R² = 0.714, F = 26.8, p< 0.001). The emanation coefficient was the strongest predictor (standardised β = 0.48), followed by ²²⁶Ra activity (β = 0.36), soil permeability (β = 0.22), and foundation type (β = 0.18). Variance inflation factors were all below 2.5, indicating acceptable multicollinearity levels (Table 2).
| Predictor | Coefficient | Std. Error | p- value | VIF |
|---|---|---|---|---|
| Intercept | -42.8 | 18.6 | 0.026 | — |
| ²²⁶Ra activity | 1.84 | 0.32 | <0.001 | 1.8 |
| Emanation coefficient | 628.4 | 94.2 | <0.001 | 2.1 |
| Soil permeability | 0.034 | 0.008 | <0.001 | 1.4 |
| Foundation type (slab=0, crawl=1) | 86.2 | 22.4 | <0.001 | 1.1 |
Table text extracted from the original PDF; superscript letters are shown inline. The original table image is below.
View original table image
Results
Results
Comprehensive Interpretation
The heatmap (Figure 1) highlights how volcanic tuff stands out across every metric, but the pie chart (Figure 2) reveals a deeper story -the tuff's disproportionate share of total radon emanation (33.4%) relative to its surface area coverage means that building on tuff is far riskier than building on any other substrate in the region. Granites and gneisses have moderate uranium content but release less of it as radon due to their lower porosity and smaller emanation coefficients.
Discussion
The striking performance of volcanic tuff as a radon source reflects the convergence of three factors: high radium content inherited from uranium-enriched magmatic fluids, high porosity that provides escape pathways for radon atoms generated within mineral grains, and a fine-grained glassy matrix where uranium is concentrated near grain surfaces rather than locked deep within crystal lattices [13] . This last point explains why the tuff's emanation coefficient (0.38) is three times higher than granite's (0.12) despite only 65% more radium -in tuff, a much larger fraction of each radon atom produced actually escapes into the pore space [14] . The practical implication is clear: buildings on volcanic tuff substrates in the Bohemian province should be treated as high-risk for radon exposure regardless of other factors. The mean indoor concentration of 486 Bq/m³ is 62% above the EU reference level, and individual buildings reached concentrations exceeding 1,200 Bq/m³ [15] . Even paragneiss substrates produce indoor levels above 300 Bq/m³ on average, suggesting that radon-resistant construction measures should be standard practice across much of the province.
The regression model's ability to explain 71.4% of indoor radon variance from just four predictors is encouraging for mapping applications. The remaining 29% likely reflects building-specific factors -ventilation habits, crack density in foundations, heating system type -that weren't captured in this research [16,17] . For regional radon risk mapping, however, the geological and soil variables measured here appear sufficient to classify areas into meaningful risk categories [18,19] .
Conclusion
Conclusion
Acknowledgement
Acknowledgements Funding SourcesThis research was supported by internal research funds at Uppsala College of Earth and Mineral Sciences. Institutional SupportThe authors thank the Department of Atmospheric Sciences, Uppsala College of Earth and Mineral Sciences, Uppsala County, Sweden, for providing gamma spectrometry and radon measurement equipment.
Figures and tables from the paper
| Lithology | ²²⁶Ra (Bq/kg) | Emanation Coeff. | Porosity (%) | Soil Gas (kBq/m³) | Indoor (Bq/m³) | n (rock) |
|---|---|---|---|---|---|---|
| Granite | 86 | 0.12 | 3.2 | 42.1 | 248 | 18 |
| Paragneiss | 124 | 0.18 | 4.8 | 58.3 | 342 | 16 |
| Orthogneiss | 98 | 0.14 | 3.6 | 46.8 | 284 | 14 |
| Sandstone | 32 | 0.22 | 12.4 | 18.7 | 126 | 12 |
| Shale | 48 | 0.16 | 8.6 | 34.2 | 198 | 14 |
| Volcanic Tuff | 142 | 0.38 | 18.2 | 82.6 | 486 | 18 |
Table text extracted from the original PDF; superscript letters are shown inline. The original table image is below.
View original table image
References
19 in the original paper- Darby S, Hill D, Auvinen A, Barros-Dios JM, Baysson H, Bochicchio F, et al. Radon in homes and risk of lung cancer: collaborative analysis of individual data from 13 European case-control studies. BMJ. 2005;330(7485):223.
- Nazaroff WW. Radon transport from soil to air. Reviews of Geophysics. 1992;30(2):137-160.
- Barnet I, Pacherová P, Neznal M. Radon in geological environment -Czech experience. Czech Geological Survey Special Papers. 2008;19:1-72.
- Hála J, Navratil JD. Radioactivity, ionizing radiation and nuclear energy. 4th ed. Prague: Konvoj; 2003.
- Mikšová J, Barnet I. Geological and geographic factors of radon risk in the Czech Republic. Czech Geological Survey Bulletin. 2002;77(4):265-274.
- Kemski J, Siehl A, Stegemann R, Valdivia-Manchego M. Mapping the geogenic radon potential in Germany. Science of the Total Environment. 2001;272(1-3):217230.
- Ielsch G, Cushing ME, Combes P, Cuney M. Mapping of the geogenic radon potential in France to improve radon risk management. Journal of Environmental Radioactivity. 2010;101(10):799-808.
- Durridge Company. RAD7 radon detector user manual. Billerica: Durridge Company; 2020.
- Sun K, Guo Q, Zhuo W. Feasibility for mapping radon exhalation rate from soil in China. Journal of Nuclear Science and Technology. 2004;41(1):86-90.
- Sakoda A, Ishimori Y, Yamaoka K. A comprehensive review of radon emanation measurements for mineral, rock, soil, mill tailing and fly ash. Applied Radiation and Isotopes. 2011;69(10):1422-1435.
- Neznal M, Neznal M, Matolín M, Barnet I, Miksova J. New method for assessing the radon risk of building sites. Czech Geological Survey Special Papers. 2004;16:1-48.
- R Core Team. R: a language and environment for statistical computing. Vienna: R Foundation; 2022.
- Karunakara N, Somashekarappa HM, Narayana Y, Avadhani DN, Mahesh HM, Siddappa K. ²²⁶Ra, ⁴⁰K and ⁷Be activity concentrations in plants in the environment of Kaiga, India. Journal of Environmental Radioactivity. 2003;65(3):255-266.
- Tanner AB. Radon migration in the ground: a supplementary review. The Natural Radiation Environment III. 1980;1:5-56.
- European Commission. Council Directive 2013/59/Euratom laying down basic safety standards for protection against the dangers arising from exposure to ionising radiation. Official Journal of the European Union. 2014;L13:1-73.
- Font L, Baixeras C. The RAGENA dynamic model of radon generation, entry and accumulation indoors. Science of the Total Environment. 2003;307(1-3):5569.
- Bossew P. Mapping the geogenic radon potential and estimation of radon prone areas in Germany. Radiation Emergency Medicine. 2015;4(2):13-20.
- Appleton JD. Radon: sources, health risks, and hazard mapping. Ambio. 2007;36(1):85-89.
- Ciotoli G, Lombardi S, Annunziatellis A. Geostatistical analysis of soil gas data in a high seismic intermontane basin: Fucino Plain, central Italy. Journal of Geophysical Research. 2007;112(B5):B05407.