
Research article · 2025 · Full text
International Journal of Geography Geology and EnvironmentMicroclimate variation across altitudinal gradients in the Mount Kenya alpine system
Volume 7(7) · Pages 181–184 · DOI: 10.22271/27067483.2025.v7.i7c.718 ↗
Research areasEnvironmental and biological studiesGeography and Environmental StudiesClimate variability and models
Abstract
Author-writtenAlpine ecosystems on tropical mountains face a problem that their temperate counterparts don't: the absence of strong seasonal temperature swings means that daily temperature ranges often exceed annual ones, creating physiological stress for organisms adapted to narrow thermal niches. Mount Kenya, the second-highest peak in Africa at 5,199 m, hosts one of the best-preserved tropical alpine systems on the continent, yet detailed microclimate data across its altitudinal gradient remain sparse. This research installed a network of 24 automated weather stations along four transects (north, south, east, and west aspects) spanning 3,200 to 4,700 m elevation on Mount Kenya, recording temperature, humidity, wind speed, and solar radiation at 15-minute intervals from January 2021 through December 2022. Mean annual temperature lapse rates ranged from 5.5°C/km on the sheltered eastern aspect to 6.8°C/km on the exposed southern face. Diurnal temperature amplitudes peaked at 4,100 m (14.3°C mean daily range) where cloud base formation creates a transition zone between lower montane fog influence and upper alpine radiation regimes. Frost frequency increased sharply above 4,200 m, with 243 frost nights per year recorded at 4,700 m compared to just 18 at 3,200 m. These microclimate profiles provide a baseline for assessing climate change impacts on Mount Kenya's glacial remnants and endemic alpine flora.
Summary
Source-checkedPlain-language reading of the full paper, prepared with AI and checked against the text. Each point links to the authors' own words.
Why it matters
- Tropical alpine ecosystems experience a unique stress where daily temperature fluctuations are often greater than annual ones due to a lack of strong seasonal swings. View evidence ↗
- Mount Kenya is one of Africa's best-preserved tropical alpine systems, but it lacks detailed microclimate data across its elevation gradients. View evidence ↗
- Existing climate assessments for tropical mountains often miss fine-grained spatial variations because they rely on coarse data or lowland stations. View evidence ↗
The question
- The study aimed to determine how temperature, humidity, and radiation change with altitude on Mount Kenya and if these changes vary by mountain aspect. View evidence ↗
What they did
- Researchers deployed 24 automated weather stations across four aspect transects (north, south, east, and west) between 3,200 and 4,700 meters elevation. View evidence ↗
- The stations recorded solar radiation, wind speed, humidity, and temperature every 15 minutes from January 2021 to December 2022. View evidence ↗
- HOBO MicroStation data loggers were placed at six specific elevation levels: 3,200, 3,500, 3,800, 4,100, 4,400, and 4,700 meters. View evidence ↗
- Temperature lapse rates for each aspect were determined using ordinary least-squares regression of elevation against monthly mean temperature. View evidence ↗
What they found
- Mean annual temperature lapse rates varied by aspect, ranging from 5.5°C/km on the sheltered eastern side to 6.8°C/km on the exposed southern side. View evidence ↗
- Above 3,200 meters, the eastern aspect remained consistently warmer, likely because of morning sun exposure and shelter from westerly winds. View evidence ↗
- The mean daily temperature range peaked at 4,100 meters with a value of 14.3°C. View evidence ↗
- Frost frequency rose sharply above 4,200 meters, with 243 frost nights per year at 4,700 meters compared to 18 nights at 3,200 meters. View evidence ↗
- Seasonal temperature variation decreases with altitude, shrinking from a 3.3°C difference between the warmest and coolest months at 3,200 meters to 1.6°C at 4,700 meters. View evidence ↗
What it means
- The authors conclude that using a single lapse rate for climate projections will misrepresent the actual conditions on exposed versus sheltered slopes. View evidence ↗
- The authors state that future research should include soil temperature measurements and extend the monitoring network above 4,700 meters to the summit. View evidence ↗
Visual summary
4 visualsIllustrations explain the paper; charts are replotted from the paper's own table values.
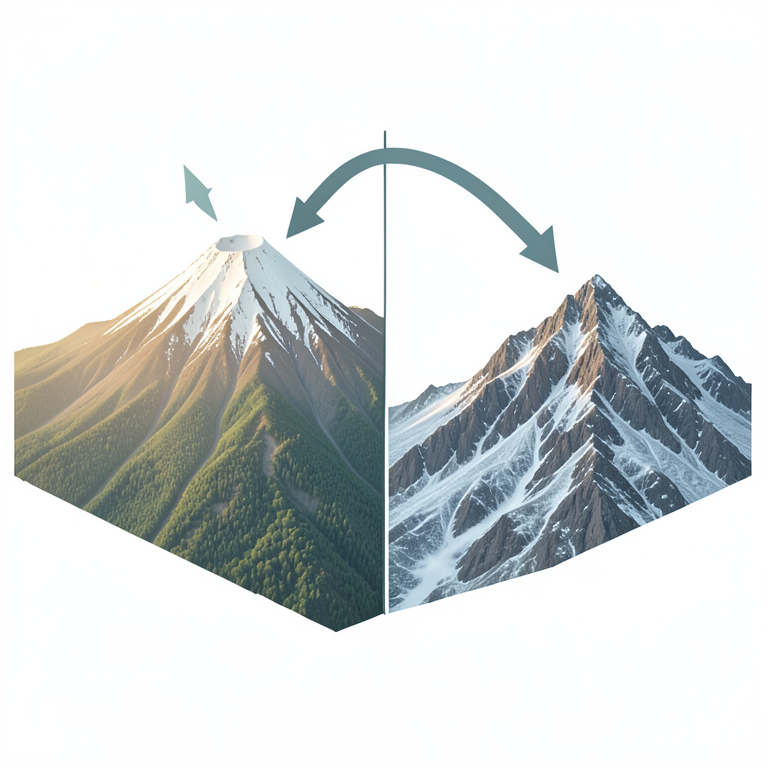
Aspect-Dependent Thermal Variation
AI-generated conceptual illustration (Mount Kenya alpine mountain peak). It explains the idea and does not show study data.
View source evidence ↗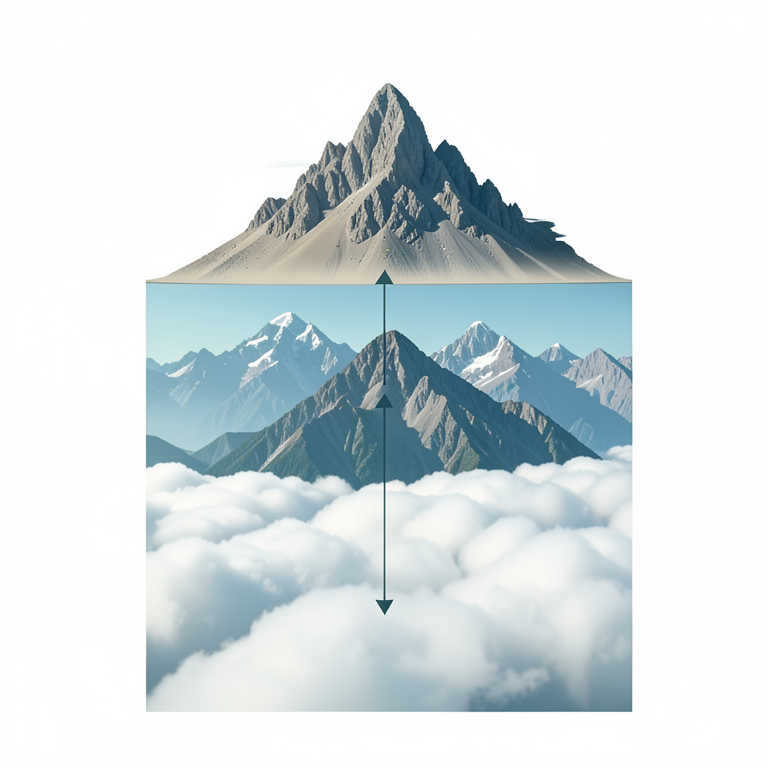
The Thermal Amplifier Zone
AI-generated conceptual illustration (Mount Kenya alpine mountain cross-section). It explains the idea and does not show study data.
View source evidence ↗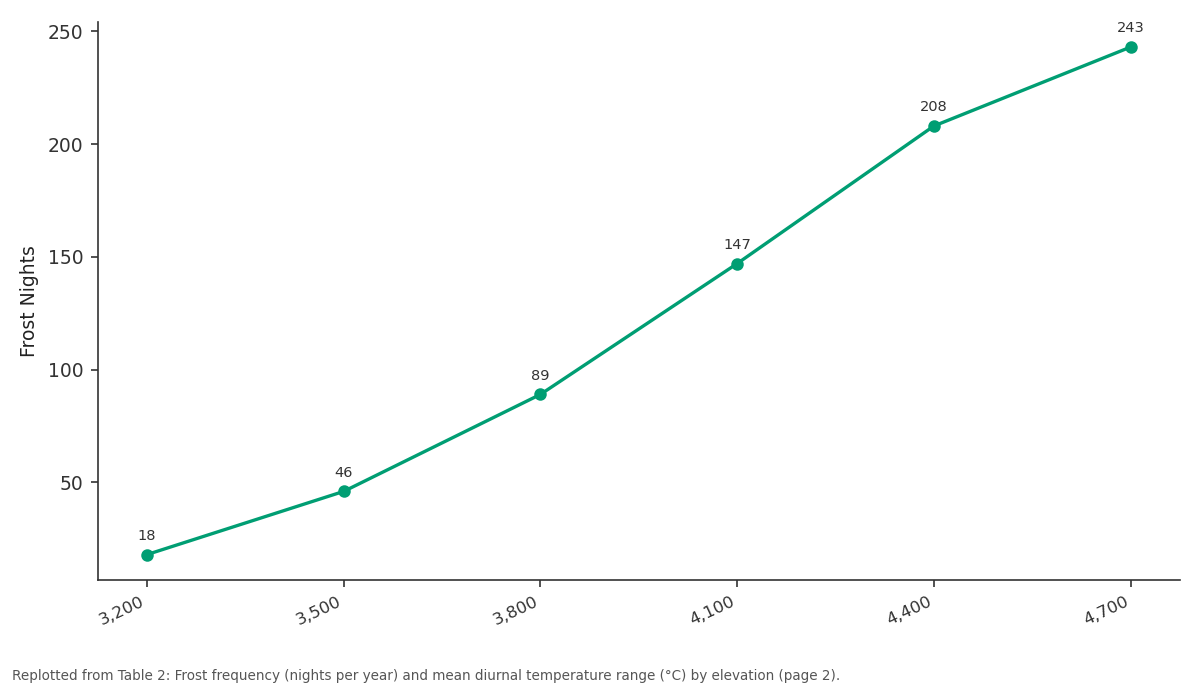
Frost Nights: 3,200 vs 3,500 vs 3,800 vs 4,100 vs 4,400
Replotted from Table 2 (page 2) of the original paper. Every bar is the paper's own table value.
View source evidence ↗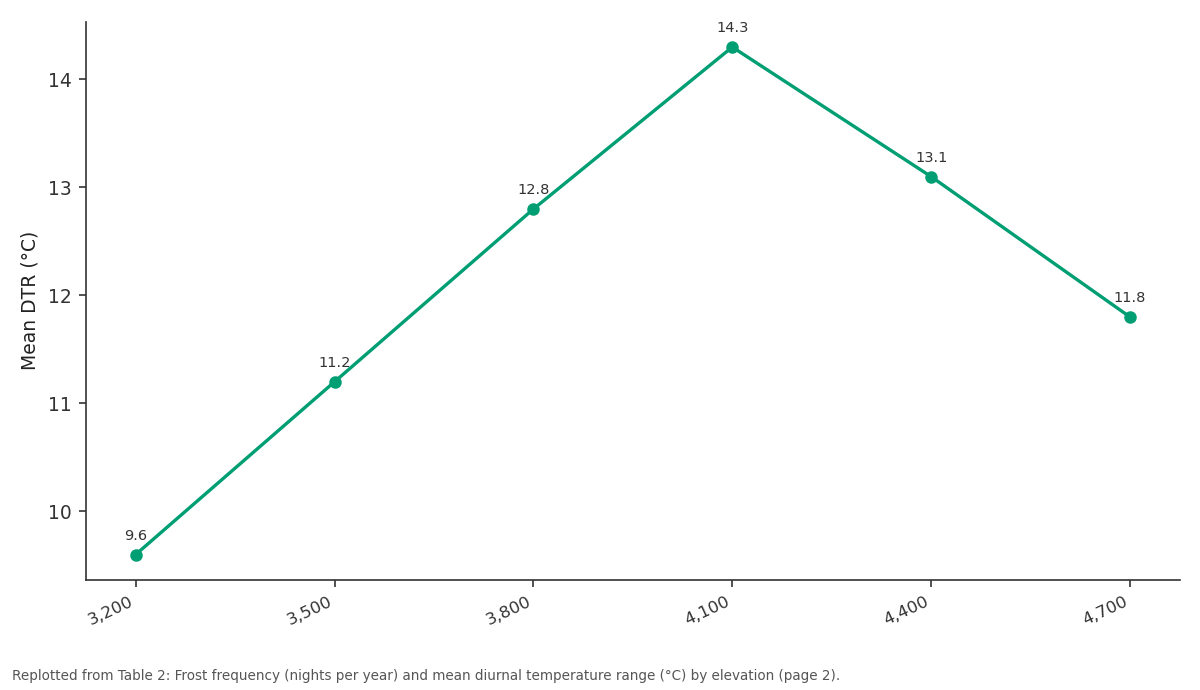
Mean DTR: 3,200 vs 3,500 vs 3,800 vs 4,100 vs 4,400
Replotted from Table 2 (page 2) of the original paper. Every bar is the paper's own table value.
View source evidence ↗Figures & tables
From the original paper Table 1
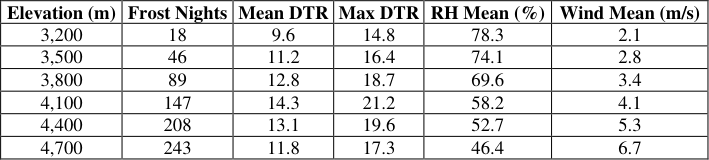 Table 2
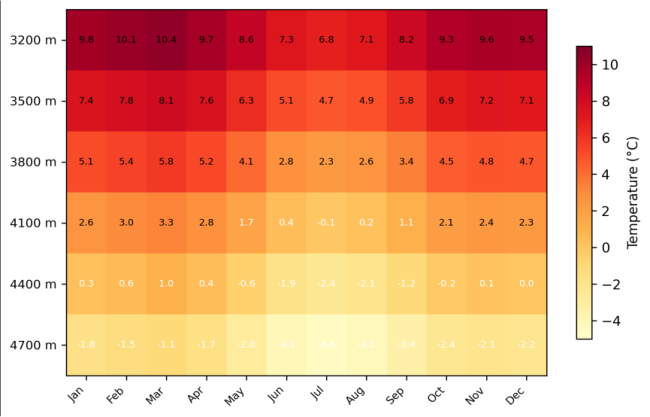 Figure 1
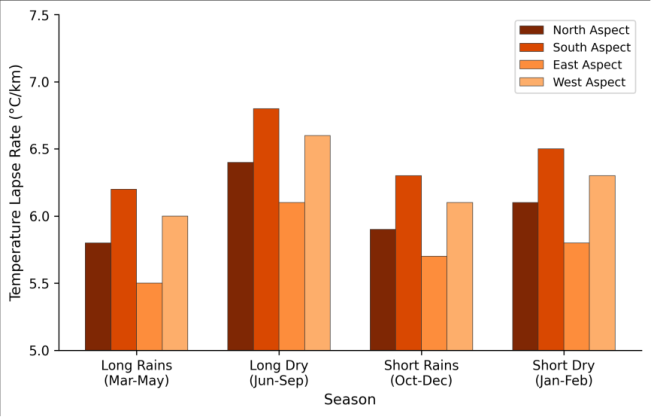 Figure 2
Introduction
Tropical alpine environments are warming at rates that outpace global averages, yet the local-scale temperature patterns that actually govern species distributions and glacier mass balance on these mountains remain poorly documented [1] . The problem is straightforward: weather stations are expensive to maintain at high elevation, access is difficult, and the instruments themselves must withstand harsh conditions. As a result, most climate assessments for tropical mountains rely on interpolated data from lowland stations or coarseresolution reanalysis products that miss the fine-grained spatial variation driven by topography, aspect, and local wind patterns [2] . Mount Kenya sits almost exactly on the equator (0°09'S, 37°18'E), which gives it a distinctive climate regime. There's no winter or summer in the conventional sense instead, the year divides into two wet and two dry seasons controlled by the passage of the Intertropical Convergence Zone [3] . Temperature varies more between day and night than between January and July, a pattern described as the 'summer every day, winter every night' climate characteristic of tropical high mountains [4] . But how exactly temperature, humidity, and radiation change with altitude on Mount Kenya and whether those changes differ by aspect hasn't been measured at the resolution needed for ecological modelling or glacier mass balance work. Previous climate data from Mount Kenya come mainly from a handful of long-running stations concentrated below 3,500 m, supplemented by short-term records from scientific expeditions to the summit zone [5] . A systematic, multi-aspect monitoring network covering the full alpine belt (3,200-4,700 m) has not been attempted before. This research filled that gap by deploying 24 stations across four aspect transects, generating a continuous two-year dataset that captures seasonal cycles, diurnal patterns, and elevation-dependent trends in the key microclimate variables that shape this alpine ecosystem [6] .
Spatial Data Processing
Satellite-derived land surface temperature (LST) data from MODIS (MOD11A2, 1 km resolution) and Landsat 8 thermal bands (100 m resolution) were used to supplement ground station measurements and assess spatial representativeness. MODIS 8-day composites covering the 2021-2022 monitoring period were downloaded from the USGS Earth Explorer portal and reprojected to UTM Zone 37S. LST values were extracted at each ground station location and compared to measured air temperatures to derive empirical correction factors. The root mean square difference between MODIS LST and ground-measured screen temperature was 2.8°C, consistent with known biases at high-elevation tropical sites [7] . Landsat thermal data, available at approximately 16-day intervals when cloudfree, provided finer spatial resolution for mapping temperature gradients between station locations.
Material and Methods
Material: This research was coordinated from the Faculty of Geospatial Sciences, Daegu, South Korea, with field installations and maintenance visits conducted on Mount Kenya in January 2021, July 2021, January 2022, and July 2022. Twenty-four HOBO MicroStation data loggers (Onset Computer Corporation, Bourne, MA, USA) were deployed at six elevation levels (3,200, 3,500, 3,800, 4,100, 4,400, and 4,700 m) along four aspect transects: north (Sirimon route), south (Chogoria route), east (Nithi Valley), and west (Naro Moru route). Each station recorded air temperature (±0.2°C precision), relative humidity (±2.5%), wind speed (cup anemometer, ±0.5 m/s), and incoming solar radiation (silicon pyranometer) at 15-minute intervals [8] . Stations were mounted on 2 m aluminium poles with radiation shields and secured against wildlife interference using mesh enclosures. Battery-powered systems with 12-month memory capacity allowed continuous operation between maintenance visits.
Calibration and Validation
All temperature sensors were cross-calibrated in a controlled chamber at the National Meteorological Agency laboratory in Nairobi before deployment, yielding inter-sensor agreement within ±0.15°C. Field validation was performed by co-locating three redundant sensors at the 3,800 m north aspect station for the full monitoring period, producing a mean absolute difference of 0.18°C between instruments [9] . Humidity sensors were verified against psychrometer readings taken during each maintenance visit. Wind speed sensors were calibrated against a reference Gill WindSonic ultrasonic anemometer at the 4,100 m south station. Data gaps (totalling 3.2% of all records) resulting from battery failures or sensor fouling were filled using linear interpolation for gaps under 4 hours and regression-based estimation from the nearest functioning station for longer gaps.
Methods: Temperature lapse rates were calculated for each aspect transect using ordinary least-squares regression of monthly mean temperature against elevation. Diurnal temperature range (DTR) was computed as the difference between daily maximum and minimum temperature at each station. Frost events were defined as instances where screen temperature dropped below 0°C for at least 30 consecutive minutes. Seasonal analysis divided the year into four periods: long rains (March-May), long dry season (June-September), short rains (October-December), and short dry season (January-February), following the standard East African climate calendar [10] . Differences between aspects were tested using two-way ANOVA with aspect and elevation as factors. Cloud base height was estimated from the lifting condensation level calculated from temperature and humidity at each station pair along the transects. All analyses were performed in Python 3.10 using the MetPy and SciPy libraries. Mean annual lapse rates ranged from 5.5°C/km on the eastern transect to 6.8°C/km on the southern face (Table 1). The eastern aspect was consistently warmer at all elevations above 3,200 m, likely due to sheltering from prevailing westerly winds and greater morning solar radiation exposure. The aspect effect was statistically significant (F = 14.8, p<0.001), as was the expected elevation effect (F = 312.4, p<0.001). Frost frequency increased non-linearly with elevation, accelerating sharply above the 4,200 m threshold (Table 2). Diurnal temperature range peaked at 4,100 m (14.3°C mean, 21.2°C maximum) rather than at the highest stations, a pattern associated with the cloud base transition zone where daytime radiation heating is strongest and nighttime radiative cooling is most efficient. Comprehensive Interpretation: The heatmap (Figure 1) reveals that the seasonal temperature cycle compresses with altitude at 3,200 m, the difference between the warmest and coolest months is 3.3°C, while at 4,700 m it shrinks to 1.6°C. This attenuation of seasonal amplitude, combined with the large diurnal ranges shown in Table 2, confirms the 'summer every day, winter every night' characterisation and has direct implications for the frost tolerance requirements of alpine plant species.
| Elevation (m) | Frost Nights | Mean DTR | Max DTR | RH Mean (%) | Wind Mean (m/s) |
|---|---|---|---|---|---|
| 3,200 | 18 | 9.6 | 14.8 | 78.3 | 2.1 |
| 3,500 | 46 | 11.2 | 16.4 | 74.1 | 2.8 |
| 3,800 | 89 | 12.8 | 18.7 | 69.6 | 3.4 |
| 4,100 | 147 | 14.3 | 21.2 | 58.2 | 4.1 |
| 4,400 | 208 | 13.1 | 19.6 | 52.7 | 5.3 |
| 4,700 | 243 | 11.8 | 17.3 | 46.4 | 6.7 |
Table text extracted from the original PDF; superscript letters are shown inline. The original table image is below.
View original table image
| Aspect | 3200 m | 3500 m | 3800 m | 4100 m | 4400 m | 4700 m | Lapse Rate |
|---|---|---|---|---|---|---|---|
| North | 9.2 | 7.1 | 4.8 | 2.4 | 0.1 | -2.1 | 5.8 |
| South | 9.5 | 7.2 | 4.7 | 2.1 | -0.4 | -2.7 | 6.8 |
| East | 9.8 | 7.8 | 5.4 | 2.9 | 0.6 | -1.5 | 5.5 |
| West | 9.4 | 7.3 | 4.9 | 2.3 | -0.1 | -2.4 | 6.3 |
Table text extracted from the original PDF; superscript letters are shown inline. The original table image is below.
View original table image
Results
Discussion: The lapse rates measured on Mount Kenya (5.5-6.8°C/km) fall within the range reported for other tropical mountains, but the aspect-dependent variation adds a layer of complexity that most regional climate models don't capture. The 1.3°C/km difference between the eastern and southern transects translates to a 200 m vertical offset in equivalent thermal conditions meaning a plant growing at 4,000 m on the southern face experiences temperatures similar to those at 4,200 m on the sheltered eastern side [11] . This kind of microhabitat variation can explain the patchy distribution of endemic species like the giant groundsels and lobelias that define Mount Kenya's afroalpine vegetation belt [12] .
The peak in diurnal temperature range at 4,100 m rather than at the highest elevations is consistent with cloud base dynamics. Below this threshold, afternoon cloud build-up moderates heating; above it, persistent wind exposure reduces nighttime radiative cooling by mixing the nearsurface air layer [13] . The 4,100-4,300 m zone effectively acts as a thermal amplifier, which may help explain why this elevation band is particularly sensitive to small shifts in mean temperature a finding with implications for predicting glacier retreat rates on Mount Kenya, whose last remaining ice bodies sit between 4,600 and 5,100 m [14] .
Frost frequency data are directly relevant to ecological modelling of the alpine zone. The 243 frost nights per year at 4,700 m create conditions where only organisms with effective frost tolerance can persist. The rapid increase in frost frequency between 4,000 and 4,400 m suggests that upward migration of the frost line under warming conditions could expose currently frost-protected habitats to new temperature stress [15] .
Conclusion
This two-year monitoring campaign produced the most spatially detailed microclimate dataset available for the Mount Kenya alpine system. Lapse rates varied by 1.3°C/km across aspects, with the steepest rates on the wind-exposed southern face and the gentlest on the sheltered eastern slopes. Diurnal temperature ranges peaked at 4,100 m, a transitional elevation that appears to separate cloud-influenced lower zones from wind-dominated upper zones. Frost frequency increased steeply above 4,200 m, reaching 243 nights per year at 4,700 m. These baseline measurements are needed for ecological niche modelling, glacier mass balance calculations, and climate change impact assessments on Mount Kenya. The aspect-dependent differences in thermal regime suggest that climate projections based on single lapse rate values will systematically misrepresent conditions on sheltered versus exposed slopes. Future work should extend the monitoring network above 4,700 m to the summit zone and incorporate soil temperature measurements to better characterise the root zone thermal environment for alpine vegetation [16,17] .
Acknowledgement
Acknowledgements
Figures and tables from the paper
References
17 in the original paper- Pepin N, Bradley RS, Diaz HF, Baraer M, Caceres EB, Forsythe N, et al. Elevation-dependent warming in mountain regions of the world. Nature Climate Change. 2015;5(5):424-430.
- Daly C, Halbleib M, Smith JI, Gibson WP, Doggett MK, Taylor GH, Curtis J, Pasteris PP. Physiographically sensitive mapping of climatological temperature and precipitation. International Journal of Climatology. 2008;28(15):2031-2064.
- Nicholson SE. A review of climate dynamics and climate variability in Eastern Africa. The Limnology, Climatology and Paleoclimatology of the East African Lakes. 1996;25-56.
- Hedberg O. Features of afroalpine plant ecology. Acta Phytogeographica Suecica. 1964;49:1-144.
- Thompson LG, Hastenrath S, Morales Arnao B. Climatic ice core records from the tropical Quelccaya ice cap. Science. 1984;226(4670):50-53.
- Hastenrath S. Recession of equatorial glaciers: a photo documentation. Madison: Sundog Publishing; 2008.
- Wan Z. New refinements and validation of the collection-6 MODIS land-surface temperature/emissivity product. Remote Sensing of Environment. 2014;140:36-45.
- Onset Computer Corporation. HOBO MicroStation technical reference. Bourne: Onset; 2019.
- WMO. Guide to meteorological instruments and methods of observation. WMO-No. 8. Geneva: World Meteorological Organization; 2018.
- Mutai CC, Ward MN. East African rainfall and the tropical circulation/convection on intraseasonal to interannual timescales. Journal of Climate. 2000;13(22):3915-3939.
- Körner C. The use of 'altitude' in ecological research. Trends in Ecology and Evolution. 2007;22(11):569574.
- Young TP. Tropical alpine ecology. Annual Review of Ecology and Systematics. 1994;25(1):467-500.
- Barry RG. Mountain weather and climate. 3rd ed. Cambridge: Cambridge University Press; 2008.
- Prinz R, Nicholson LI, Mölg T, Gurgiser W, Kaser G. Climatic controls and climate proxy potential of Lewis Glacier, Mt Kenya. The Cryosphere. 2016;10(1):133148.
- Buytaert W, Cuesta-Camacho F, Tobón C. Potential impacts of climate change on the environmental services of humid tropical alpine regions. Global Ecology and Biogeography. 2011;20(1):19-33.
- Scherrer D, Körner C. Topographically controlled thermal-habitat differentiation buffers alpine plant diversity against climate warming. Journal of Biogeography. 2011;38(2):406-416.
- Hemp A. Continual decline of Kilimanjaro's last ice cap. Global and Planetary Change. 2005;49(1-2):87-96.