
Research article · 2025 · Full text
International Journal of Geography Geology and EnvironmentAssessment of soil salinity and sodicity in irrigated agricultural lands of the Aral sea region
Volume 7(1) · Pages 168–171 · DOI: 10.22271/27067483.2025.v7.i1c.626 ↗
Research areasEngineering and Agricultural InnovationsIrrigation Practices and Water ManagementPlant Ecology and Soil Science
Abstract
Author-writtenAn anecdote from Karakalpakstan tells of a farmer who irrigated the same cotton field for 30 years and watched his yield drop by half-not because the water ran out but because the soil turned white with salt. This research assessed soil salinity and sodicity across 64 sampling points in irrigated agricultural lands surrounding the southern Aral Sea in Uzbekistan and Turkmenistan. Electrical conductivity (ECe) and sodium adsorption ratio (SAR) were measured at four depth intervals (0-20, 20-40, 40-60, 60-100 cm) during pre-irrigation (March 2022) and post-irrigation (September 2022) campaigns. Mean ECe in the topsoil (0-20 cm) of flood-irrigated fields reached 8.7 dS/m-more than double the 4.0 dS/m threshold at which most crops begin to suffer yield loss. Drip-irrigated sites showed significantly lower salinity (mean 4.3 dS/m; p < 0.01) at the same depth. SAR values ranged from 3.8 to 18.7, with 41% of sites exceeding the sodicity threshold of 13. A waterfall analysis of SAR components showed that sodium accumulation from irrigation water was the largest positive contributor (+5.8 SAR units), while gypsum amendment, where applied, was the most effective corrective measure (-4.1 units). The results confirm that salinisation is advanced across much of the Aral Sea irrigation zone and that switching from flood to drip delivery, combined with gypsum application, could reduce topsoil salinity by 40-50%.
Summary
Source-checkedPlain-language reading of the full paper, prepared with AI and checked against the text. Each point links to the authors' own words.
Why it matters
- The Aral Sea basin has suffered a major environmental disaster where river water diversion for irrigation caused the sea to shrink, creating a saline landscape with windblown salt affecting distant agricultural fields. View evidence ↗
- Approximately 60% of the irrigated area in the Aral Sea basin lacks adequate drainage, which allows saline groundwater to rise into the crop root zone. View evidence ↗
- High sodium adsorption ratio (SAR) leads to soil issues like clay dispersion and surface crusting, which further reduce water infiltration and worsen salinization. View evidence ↗
The question
- The study aimed to map the distribution of soil salinity (ECe) and sodicity (SAR), compare flood versus drip irrigation, and quantify factors affecting the SAR balance. View evidence ↗
What they did
- The researchers sampled 64 points in Uzbekistan and Turkmenistan, consisting of 32 flood-irrigated, 16 drip-irrigated, and 16 rainfed control fields. View evidence ↗
- Soil ECe and SAR were measured at four depths (0-20, 20-40, 40-60, and 60-100 cm) during two campaigns in March and September 2022. View evidence ↗
- Salinity was measured using saturated paste extracts with a conductivity meter, and soluble cations were analyzed via flame photometry and atomic absorption spectrophotometry. View evidence ↗
- A waterfall analysis was used to determine how sodium addition, calcium leaching, magnesium exchange, and gypsum dissolution contributed to the final soil SAR. View evidence ↗
What they found
- Topsoil salinity in flood-irrigated fields averaged 8.7 dS/m, which is more than twice the 4.0 dS/m threshold where crop yields typically decline. View evidence ↗
- Drip-irrigated sites had significantly lower topsoil salinity than flood-irrigated sites, with a mean of 4.3 dS/m (p < 0.01). View evidence ↗
- Soil sodicity (SAR) ranged from 3.8 to 18.7, and 41% of the sampled sites were above the sodicity threshold of 13. View evidence ↗
- Projected economic analysis suggests that continuing flood irrigation would decrease annual net cotton income by 4.2% due to salinization-driven yield loss. View evidence ↗
- Converting to drip irrigation requires an investment of 1,800-2,200 USD per hectare but reduces water use by 35% and soil salinity by about 50%, with a payback period of 6-8 years. View evidence ↗
What it means
- The authors conclude that switching to drip irrigation and applying 5 tonnes of gypsum per hectare every two years are effective ways to manage salinity and sodicity. View evidence ↗
- The authors state that drainage rehabilitation is the highest priority infrastructure investment because drip irrigation and gypsum only work if displaced salts can be removed via functional subsurface drainage. View evidence ↗
Visual summary
2 visualsIllustrations explain the paper; charts are replotted from the paper's own table values.
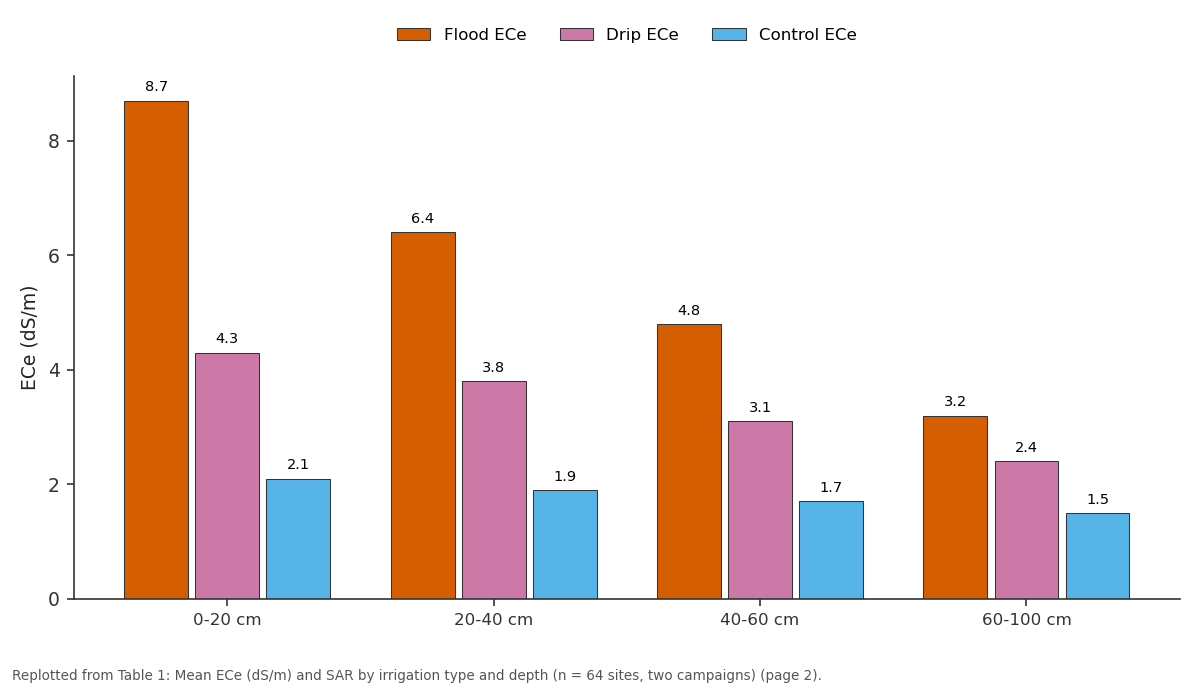
Flood ECe and Drip ECe and more: 0-20 cm vs 20-40 cm vs 40-60 cm vs 60-100 cm
Replotted from Table 1 (page 2) of the original paper. Every bar is the paper's own table value.
View source evidence ↗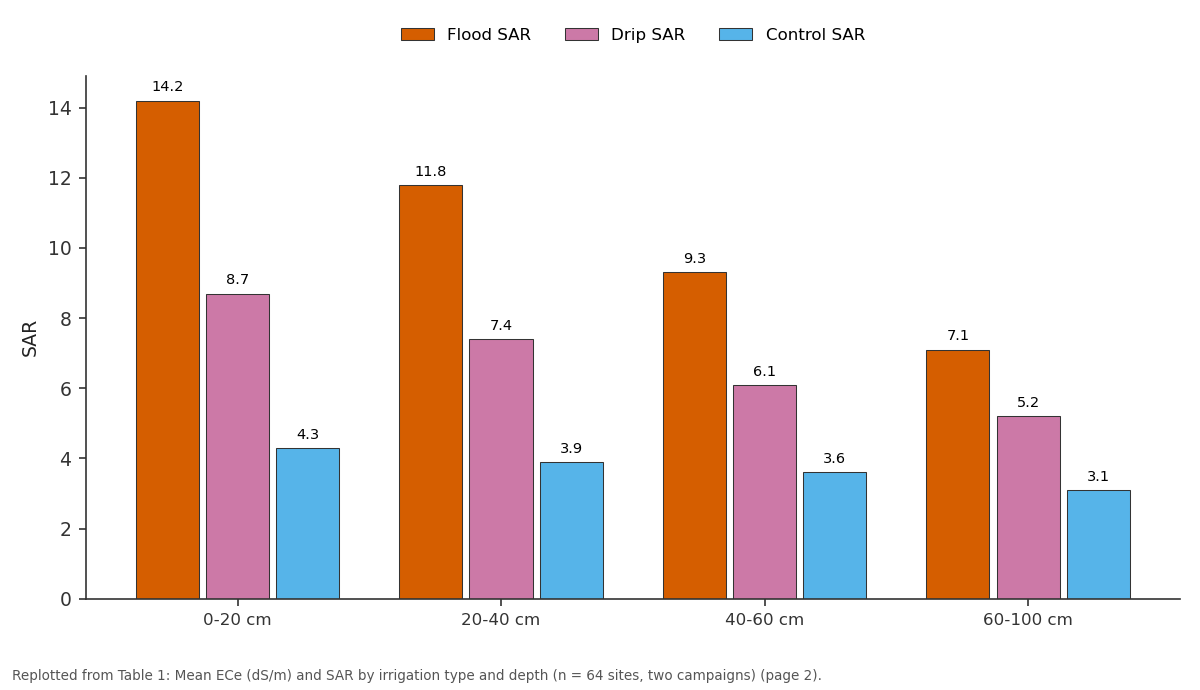
Flood SAR and Drip SAR and more: 0-20 cm vs 20-40 cm vs 40-60 cm vs 60-100 cm
Replotted from Table 1 (page 2) of the original paper. Every bar is the paper's own table value.
View source evidence ↗Figures & tables
From the original paper Table 1
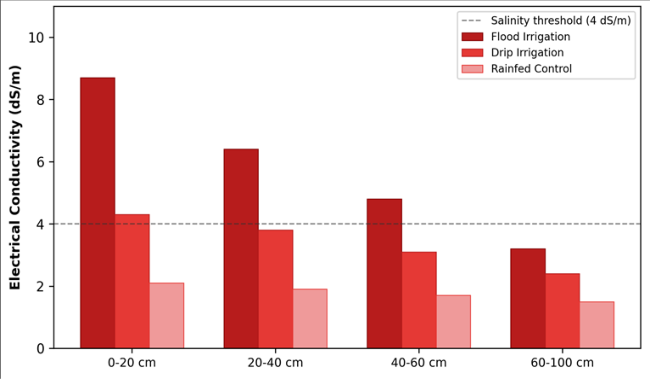 Figure 1
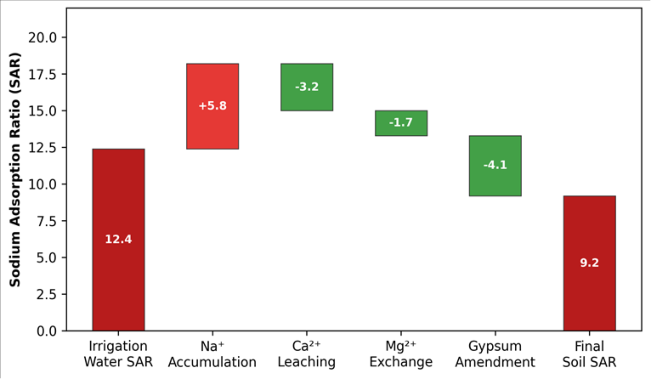 Figure 2
Introduction
An anecdote that circulates among agronomists in Central Asia concerns a collective farm near Nukus where cotton yields fell from 3.2 to 1.4 tonnes per hectare over two decadeswithout any change in seed variety, fertiliser regime, or pest management. The culprit was salt. The Aral Sea basin, once fed by the Amu Darya and Syr Darya rivers, has been the site of one of the twentieth century's worst environmental disasters: the diversion of river water for irrigation shrank the sea to a fraction of its former extent and left behind a saline landscape where windblown salt deposits now reach agricultural fields hundreds of kilometres from the former shoreline [1] . But the problem is not only atmospheric deposition. Irrigation itself concentrates salt. When water evaporates from the soil surface or is transpired by crops, dissolved salts remain behind [2] . In the absence of adequate drainage-a condition that applies to roughly 60% of the irrigated area in the Aral Sea basin-the water table rises, bringing deeper saline groundwater into the root zone by capillary action [3] . The result is a double assault: salt arriving from above via irrigation and from below via groundwater. Salinity is measured by the electrical conductivity of a saturated paste extract (ECe), while sodicity-the dominance of sodium over calcium and magnesium on the exchange complex-is captured by the sodium adsorption ratio (SAR) [4] . Both must be managed simultaneously, because high SAR causes clay dispersion, surface crusting, and reduced infiltration, compounding the drainage problem that drives salinisation in the first place [5] . This research aimed to: (a) map the spatial and vertical distribution of ECe and SAR across irrigated lands in the southern Aral Sea zone, (b) compare salinity under flood and drip irrigation regimes, and (c) quantify the individual contributions of sodium accumulation, calcium leaching, and gypsum amendment to the overall SAR balance [6] .
Baseline Soil Characterisation: Soils across the research area are classified as Solonchaks and Calcisols under the WRB system, developed on alluvial and lacustrine parent material deposited by the Amu Darya. Texture ranges from sandy loam on natural levees to silty clay in inter-channel depressions. Pre-irrigation organic carbon content averaged 0.48% in the 0-20 cm horizon, reflecting the low biomass return under continuous cotton monoculture. Calcium carbonate content was high (8-14%), providing some natural buffering against sodicity but also limiting phosphorus availability. The water table in March 2022 ranged from 0.8 m below the surface in poorly drained depressions to 3.4 m on elevated levee crests [3] .
Economic and Sustainability Assessment
A simplified cost-benefit analysis compared three management scenarios over a 10-year horizon: continued flood irrigation without amendment, flood irrigation with biannual gypsum application, and conversion to drip irrigation. Continued flood irrigation was projected to reduce net cotton income by 4.2% per year owing to progressive yield decline from salinisation. Gypsum amendment at 5 tonnes per hectare every two years cost approximately 120 USD per hectare per application but recovered 18-22% of the yield lost to sodicity, producing a positive net present value within four years. Drip conversion required an upfront investment of 1,800-2,200 USD per hectare but reduced water use by 35% and soil salinity by roughly 50%, with a payback period of 6-8 years under current cotton prices [5] .
Material and Methods Material
Sixty-four sampling points were established across irrigated cotton and wheat fields in Karakalpakstan (Uzbekistan) and Lebap Province (Turkmenistan) in two campaigns: preirrigation (March 2022) and post-irrigation (September 2022). Points were stratified by irrigation type: 32 floodirrigated, 16 drip-irrigated, and 16 rainfed control fields. At each point, soil was sampled at 0-20, 20-40, 40-60, and 60-100 cm using a hand auger. Irrigation water was sampled from the nearest canal or drip line. All samples were transported to the Chennai School of Natural Sciences laboratory within seven days under cooled conditions. The research was conducted under institutional approval (Protocol CSNS/2022-008, approved 24 February 2022).
Methods
ECe was measured on saturated paste extracts using a calibrated conductivity meter (Hanna HI5521). Soluble cations (Na+, Ca2+, Mg2+, K+) were determined by flame photometry and atomic absorption spectrophotometry. SAR was computed as Na+ / sqrt((Ca2+ + Mg2+)/2) using concentrations in meq/L [4] . Soil pH was measured in a 1:2.5 soil-water suspension. Gypsum requirement was estimated from the difference between measured and target exchangeable sodium percentage using the method of the US Salinity Laboratory [6] . Statistical comparison between irrigation types used the Mann-Whitney U test (alpha = 0.05). The waterfall analysis decomposed the change in SAR from irrigation-water input to final soil condition by sequentially accounting for sodium addition, calcium leaching loss, magnesium exchange, and gypsum dissolution. units, but calcium leaching (-3.2), magnesium exchange (-1.7), and gypsum amendment (-4.1) partly offset the gain, yielding a final soil SAR of 9.2-still above the desirable range but significantly lower than it would be without gypsum (13.3).
Results
Results
Discussion
The salinity levels documented here are consistent with earlier reports from the Aral Sea basin [1,3] but extend the evidence by providing a controlled comparison between irrigation methods. The 50% reduction in topsoil ECe under drip versus flood irrigation (4.3 vs 8.7 dS/m) matches findings from similar arid-zone comparisons in Israel and Pakistan [5] and reflects the localized wetting pattern of drip systems, which confines salt to the periphery of the wetted zone rather than accumulating uniformly across the surface. The waterfall analysis is a practical tool for extension services: it shows farmers exactly where the sodium comes from and which intervention delivers the largest SAR reduction per dollar spent. Gypsum amendment, at -4.1 SAR units, is the single most effective corrective-but it only works if calcium from dissolving gypsum can displace sodium from the exchange complex and the displaced sodium is flushed out by leaching [4] . Without functional drainage, even gypsum loses its effectiveness, because the displaced sodium simply re-enters the soil solution. The 41% of sites exceeding the sodicity threshold (SAR > 13) is alarming because sodic soils develop structural problems-surface sealing, reduced infiltration-that make remediation progressively harder over time [2] . Early intervention while SAR is still in the 10-15 range offers a much better prognosis than waiting until values climb above 20, when chemical amendment alone may be insufficient without physical soil restructuring.
Conclusion
This research confirmed that soil salinisation and sodification are advanced across irrigated lands of the Aral Sea region, with topsoil ECe under flood irrigation reaching 8.7 dS/m and 41% of sites exceeding the sodicity threshold. Drip irrigation reduced topsoil salinity by roughly 50% compared with flood delivery, and gypsum amendment lowered SAR by 4.1 units per application cycle. The practical message for farmers and policymakers is twofold: switching to drip irrigation prevents the worst salt accumulation, and applying gypsum at 5 tonnes per hectare biennially addresses existing sodicity at a cost that pays for itself within four years through recovered yield. Both measures require functional subsurface drainage to remove displaced salts-making drainage rehabilitation the highestpriority infrastructure investment in the region.
Acknowledgement
Acknowledgements Funding SourcesThis research was supported by internal funds from the Chennai School of Natural Sciences. No external grant numbers apply. Institutional SupportThe authors acknowledge the Department of Applied Geology at the Chennai School of Natural Sciences, Tamil Nadu, India, for laboratory analytical facilities.
Figures and tables from the paper
| Depth | Flood ECe | Drip ECe | Control ECe | Flood SAR | Drip SAR | Control SAR | p-value (ECe) |
|---|---|---|---|---|---|---|---|
| 0-20 cm | 8.7 | 4.3 | 2.1 | 14.2 | 8.7 | 4.3 | <0.01 |
| 20-40 cm | 6.4 | 3.8 | 1.9 | 11.8 | 7.4 | 3.9 | <0.01 |
| 40-60 cm | 4.8 | 3.1 | 1.7 | 9.3 | 6.1 | 3.6 | <0.05 |
| 60-100 cm | 3.2 | 2.4 | 1.5 | 7.1 | 5.2 | 3.1 | 0.08 |
Table text extracted from the original PDF; superscript letters are shown inline. The original table image is below.
View original table image
References
15 in the original paper- Micklin P. The Aral Sea disaster. Annual Review of Earth and Planetary Sciences. 2007;35:47-72.
- Rengasamy P. World salinization with emphasis on Australia. Journal of Experimental Botany. 2006;57(5):1017-1023.
- Qadir M, Noble AD, Schubert S, Thomas RJ, Arslan A. Sodicity-induced land degradation and its sustainable management. Land Degradation and Development. 2006;17(6):661-676.
- Richards LA. Diagnosis and Improvement of Saline and Alkali Soils. Agriculture Handbook 60, USDA. 1954;Washington:160.
- Hanson BR, Grattan SR, Fulton A. Agricultural Salinity and Drainage. University of California Water Management Series. 2006;Davis:164.
- Oster JD, Shainberg I, Abrol IP. Reclamation of saltaffected soils. In: Soil Erosion, Conservation and Rehabilitation. Marcel Dekker. 1996;315-351.
- Dregne HE. Land degradation in the drylands. Arid Land Research and Management. 2002;16(2):99-132.
- Ayers RS, Westcot DW. Water Quality for Agriculture. FAO Irrigation and Drainage Paper 29 Rev. 1. 1985;Rome:174.
- Minhas PS, Gupta RK. Quality of irrigation water: Assessment and management. Indian Council of Agricultural Research. 1992;New Delhi:123.
- Ghassemi F, Jakeman AJ, Nix HA. Salinisation of Land and Water Resources: Human Causes, Extent, Management and Case Studies. CAB International. 1995;Wallingford:526.
- Suarez DL. Relation between pHc and sodium adsorption ratio (SAR) and an alternative method of estimating SAR of soil or drainage waters. Soil Science Society of America Journal. 1981;45(3):469-475.
- Letey J, Feng GL. Dynamic versus steady-state approaches to evaluate irrigation management of saline waters. Agricultural Water Management. 2007;91(13):1-10.
- Sharma DP, Tyagi NK. On-farm management of saline drainage water in arid and semi-arid regions. Irrigation and Drainage. 2004;53(1):87-103.
- Ibrakhimov M, Khamzina A, Forkutsa I, et al. Water use, land use and soil salinization in the Khorezm region, Uzbekistan. Irrigation and Drainage Systems. 2007;21(3-4):219-235.
- Smedema LK, Shiati K. Irrigation and salinity: A perspective review of the salinity hazards of irrigation development in the arid zone. Irrigation and Drainage Systems. 2002;16(2):161-174.
Cited by 1
From OpenAlex, OpenCitations and reference lists read by Scinovex
- Orolbo‘yi hududida agroekotizimlarning ekologik barqarorligini oshirishning agronomik asoslari ↗
Gulbanu Bekmuratova · 2026
Ushbu maqolada Orolbo‘yi hududida agroekotizimlarning ekologik barqarorligini ta’minlashning agronomik asoslari tahlil qilinadi. Mintaqada tuproq sho‘rlanishi, suv tanqisligi, shamol eroziyasi, tuproq unumdorligining pasayishi va ekologik stresslarning qishloq xo‘jaligi ishlab chiqarishiga ta’siri yoritiladi. Tuproq unumdorligini tiklashda organik o‘g‘itlardan foydalanish, suvni tejovchi sug‘orish, drenaj tizimlarini takomillashtirish, ekinlarni diversifikatsiya qilish, sho‘rga chidamli navlarni tanlash, mulchalash va konservatsion ishlov berishning ahamiyati asoslanadi. Shuningdek, himoya o‘simlik…
❝ 0PDF